Archive for Forex and Currency News – Page 285

Forex Technical Analysis & Forecast 26.04.2021

Article By RoboForex.com

EURUSD, “Euro vs US Dollar”

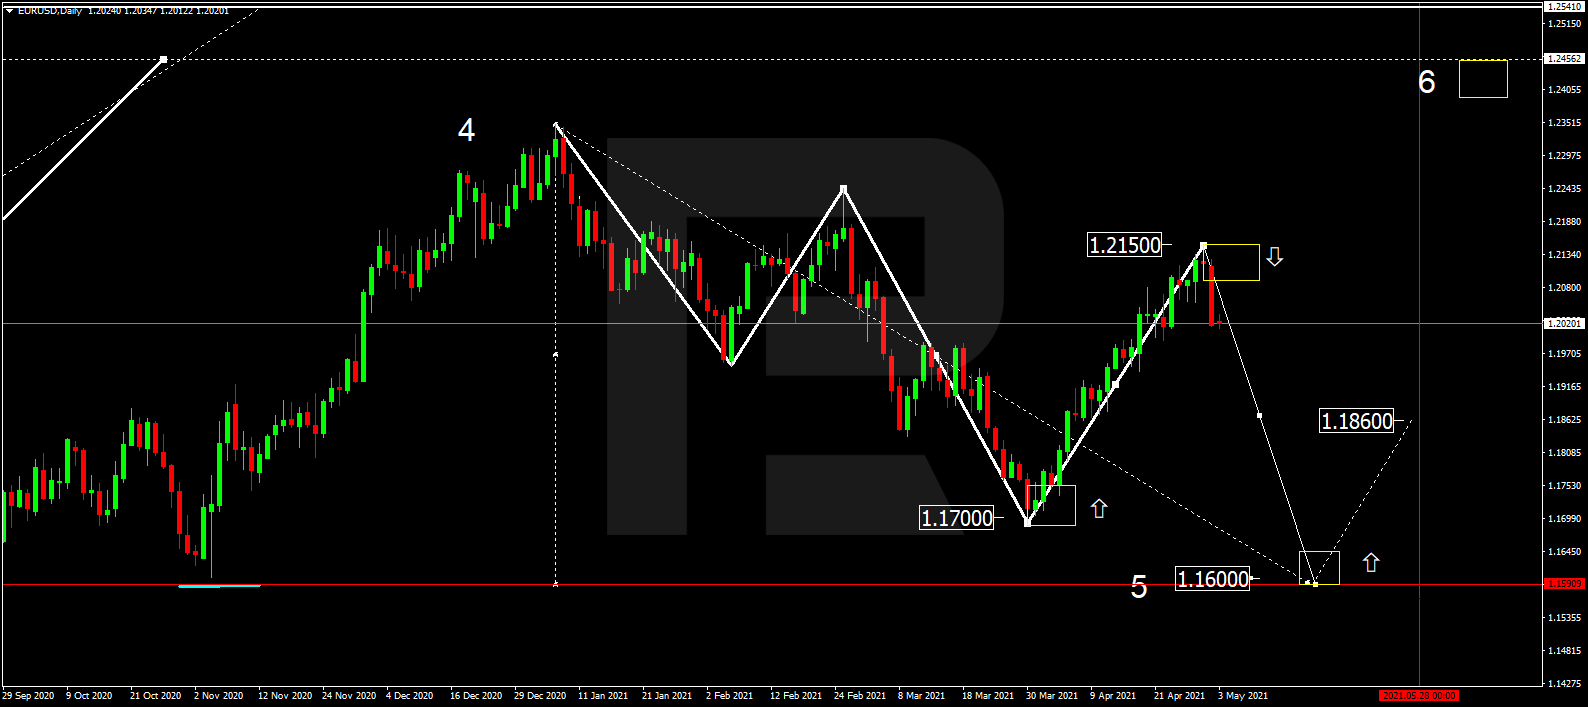
After breaking 1.2060 to the upside, EURUSD is moving upwards and may expand the range up to 1.2128. Later, the market may start a new correction to return to 1.2060.

EURUSD
Risk Warning: the result of previous trading operations do not guarantee the same results in the future

GBPUSD, “Great Britain Pound vs US Dollar”

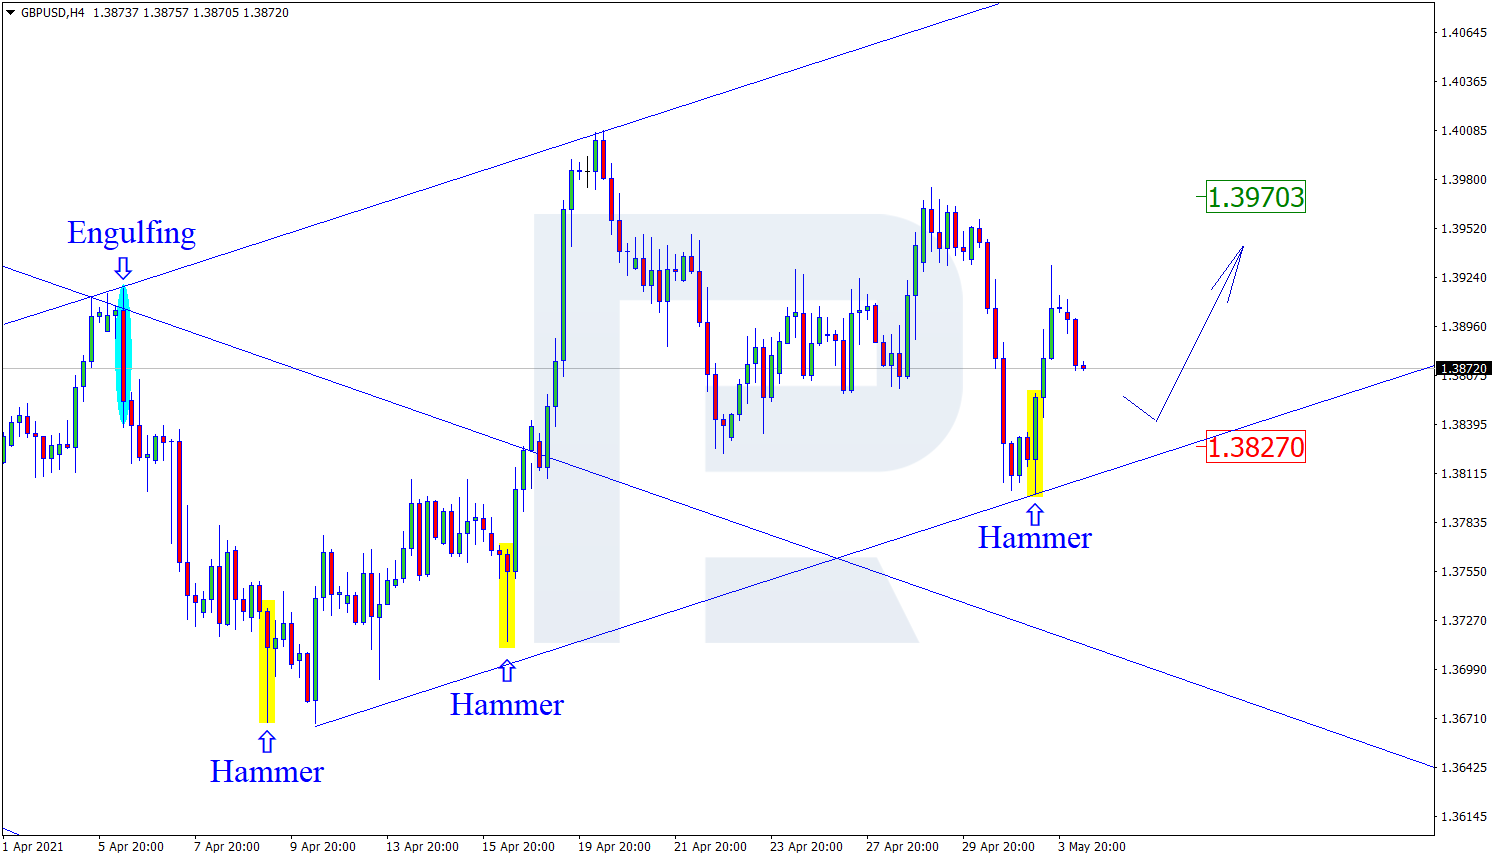
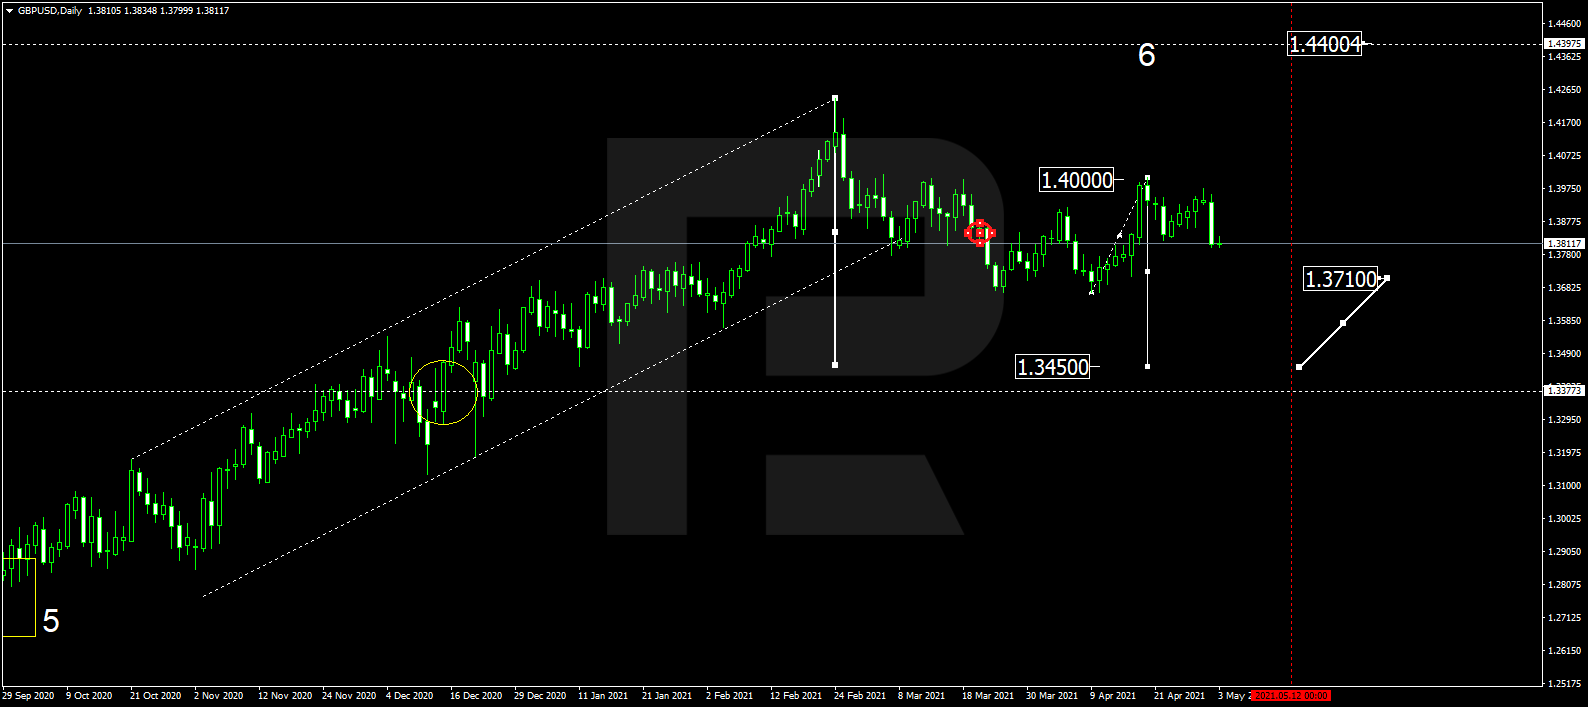
GBPUSD is correcting towards 1.3915 and may later fall to reach 1.3841. If the price breaks this range to the downside, the market may resume falling towards 1.3764; if to the upside – continue the correction with the target at 1.4010.

GBPUSD
Risk Warning: the result of previous trading operations do not guarantee the same results in the future

USDRUB, “US Dollar vs Russian Ruble”

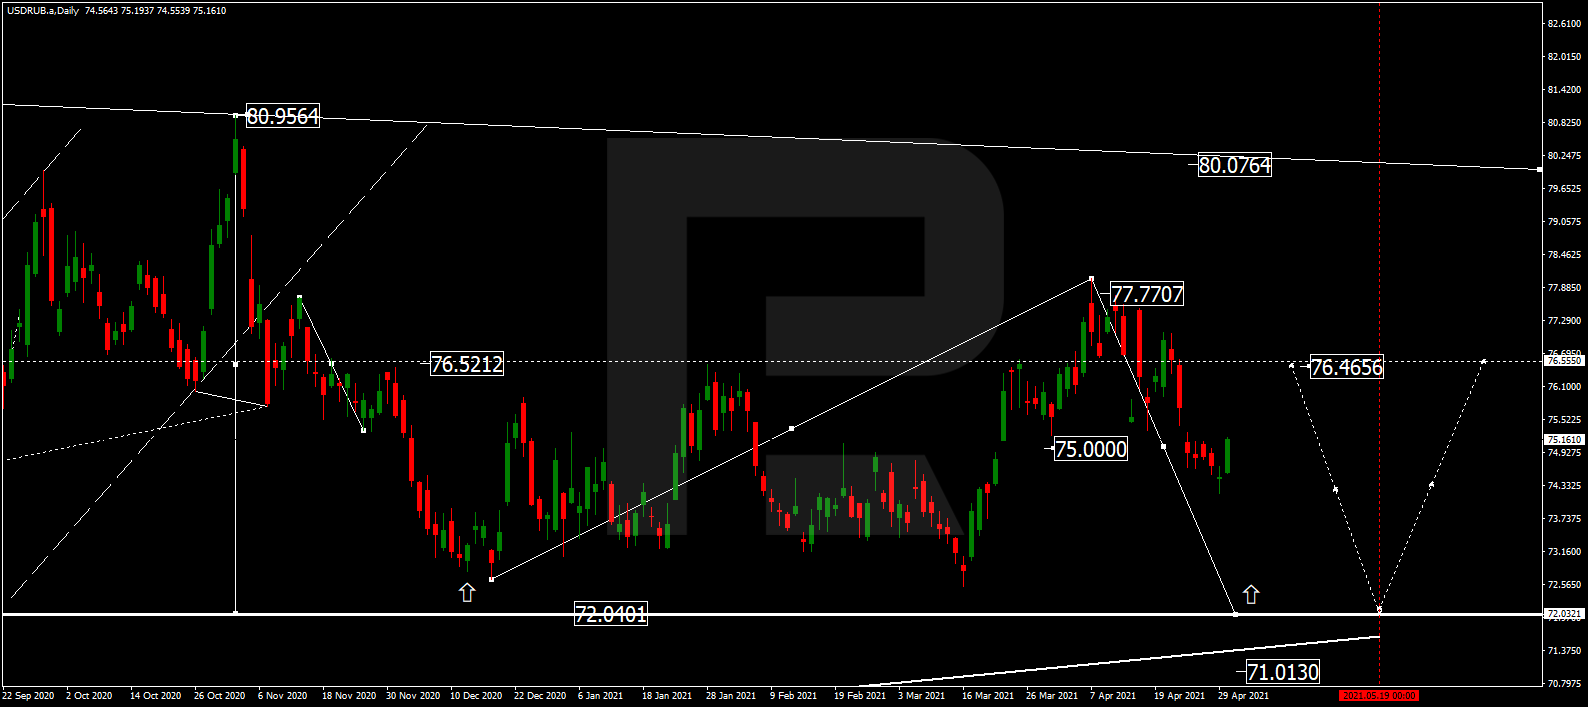
After completing the descending wave at 75.00, USDRUB is consolidating around this level. If the price breaks this range to the upside, the market may correct towards 76.50; if to the downside – form a new descending structure with the target at 73.08.

USDRUB
Risk Warning: the result of previous trading operations do not guarantee the same results in the future

USDJPY, “US Dollar vs Japanese Yen”

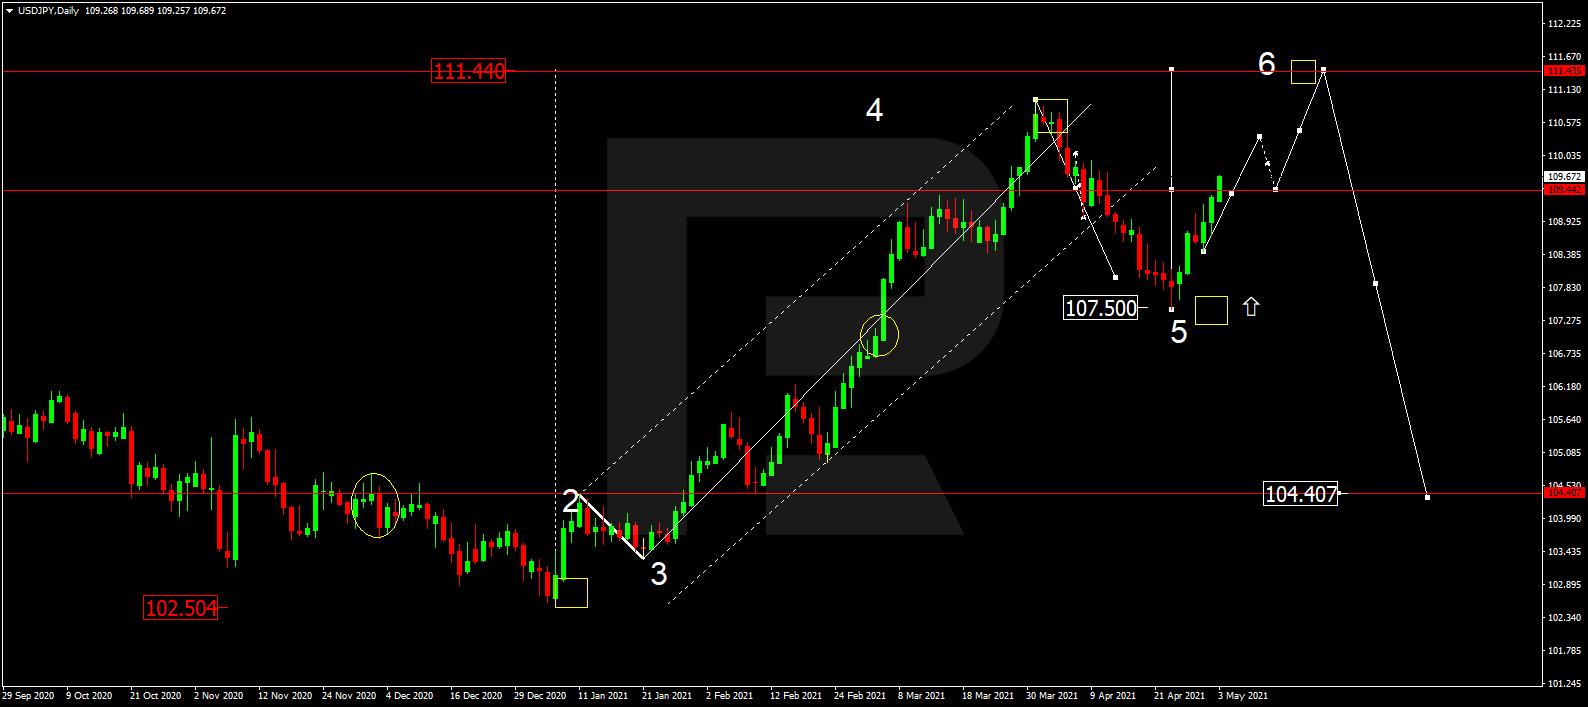
After finishing the descending wave at 107.55 along with the ascending impulse towards 108.08, USDJPY is correcting to reach 107.70. If the price breaks this range to the upside, the market may resume growing towards 108.80; if to the downside – start a new decline with the target at 107.00.

USDJPY
Risk Warning: the result of previous trading operations do not guarantee the same results in the future

USDCHF, “US Dollar vs Swiss Franc”

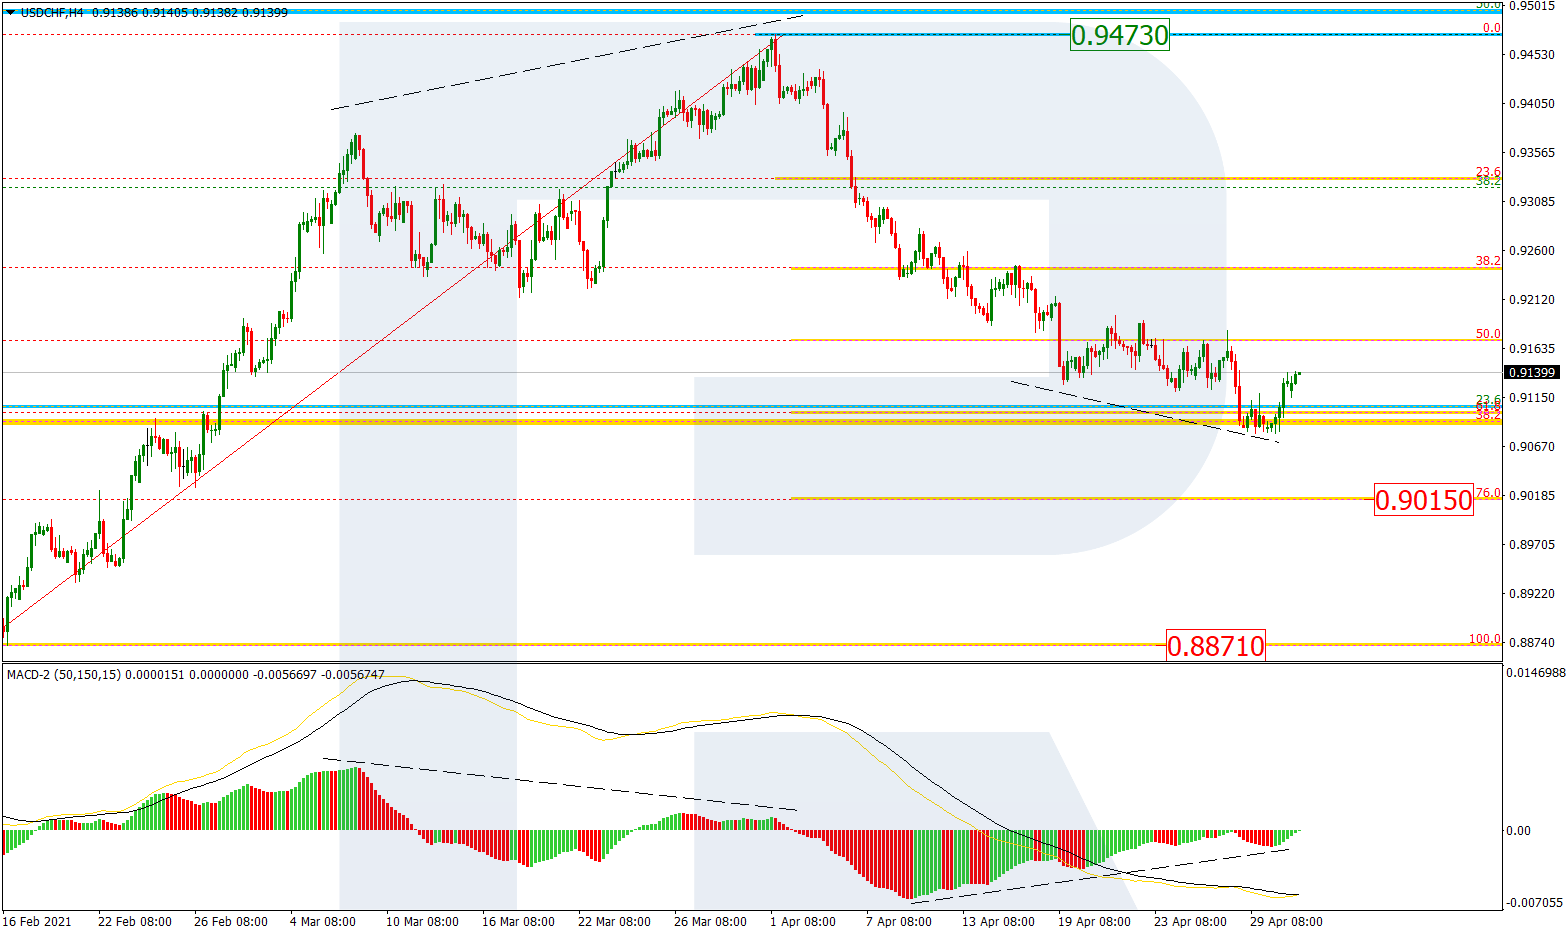
USDCHF is still consolidating around 0.9157; it has already expanded the range down to 0.9119. Possibly, today the pair may grow and break 0.9170 and then continue growing with the target at 0.9191.

USDCHF
Risk Warning: the result of previous trading operations do not guarantee the same results in the future

AUDUSD, “Australian Dollar vs US Dollar”

After rebounding from 0.7696, AUDUSD is growing towards 0.7777. Possibly, the pair may break the latter level to the upside and continue the correction to reach 0.7863. Later, the market may resume trading downwards with the target at 0.7696.

AUDUSD
Risk Warning: the result of previous trading operations do not guarantee the same results in the future

BRENT

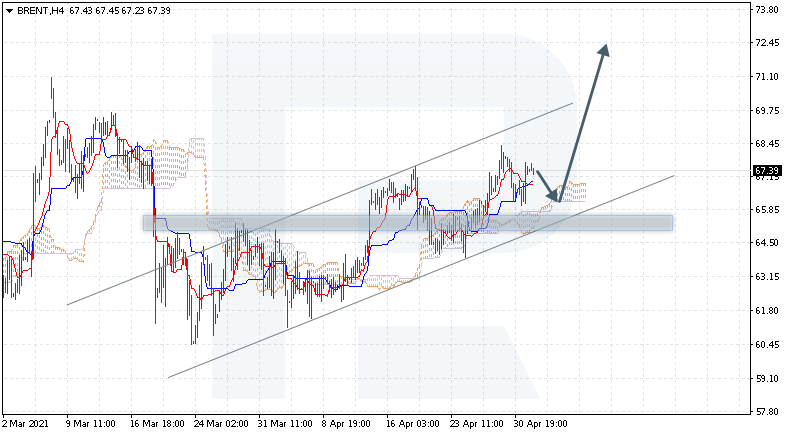
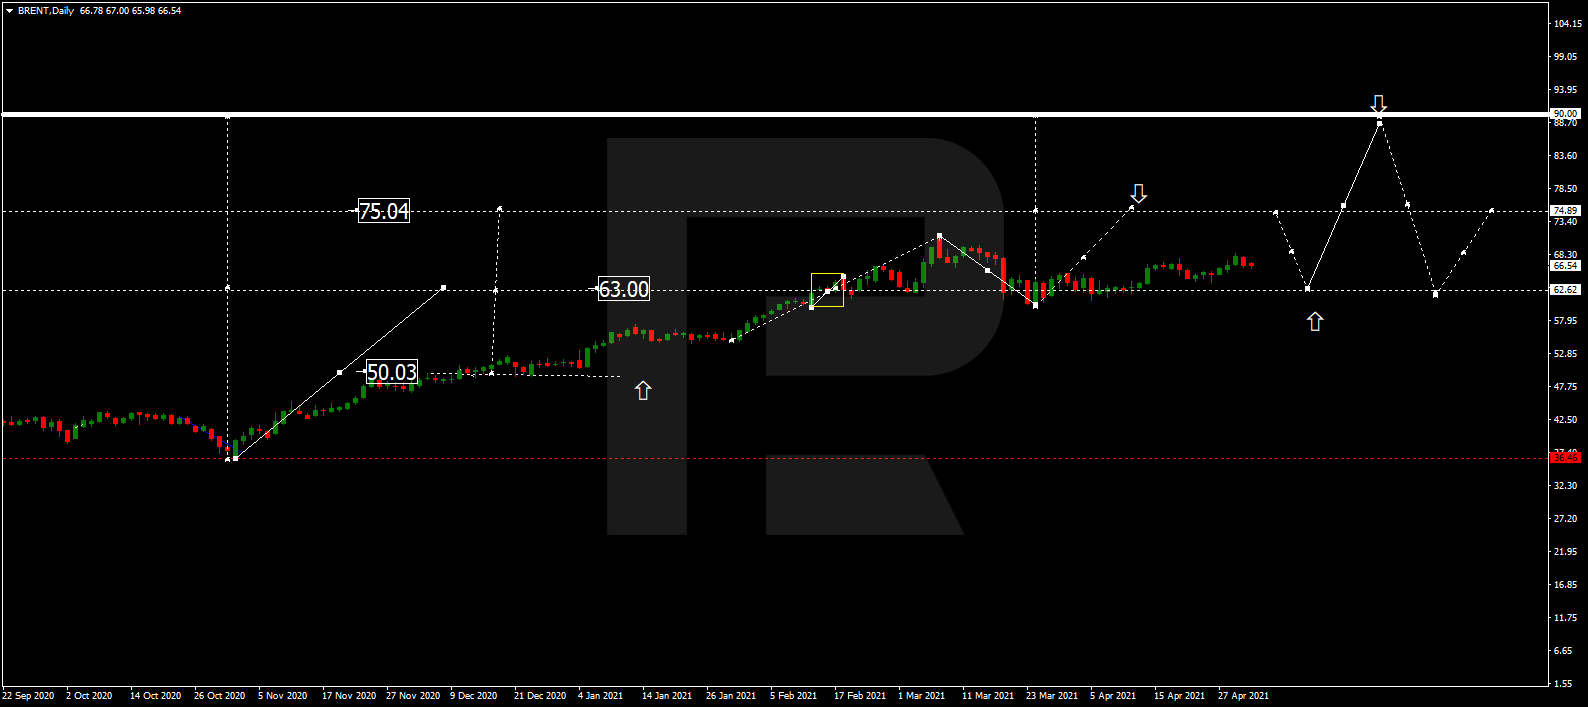
Brent has finished the ascending structure at 65.55; right now, it is falling towards 64.64. Possibly, the asset may break this level to the downside and continue the correction to reach 63.63. After that, the instrument may start a new growth with the target at 68.40.

BRENT
Risk Warning: the result of previous trading operations do not guarantee the same results in the future

XAUUSD, “Gold vs US Dollar”

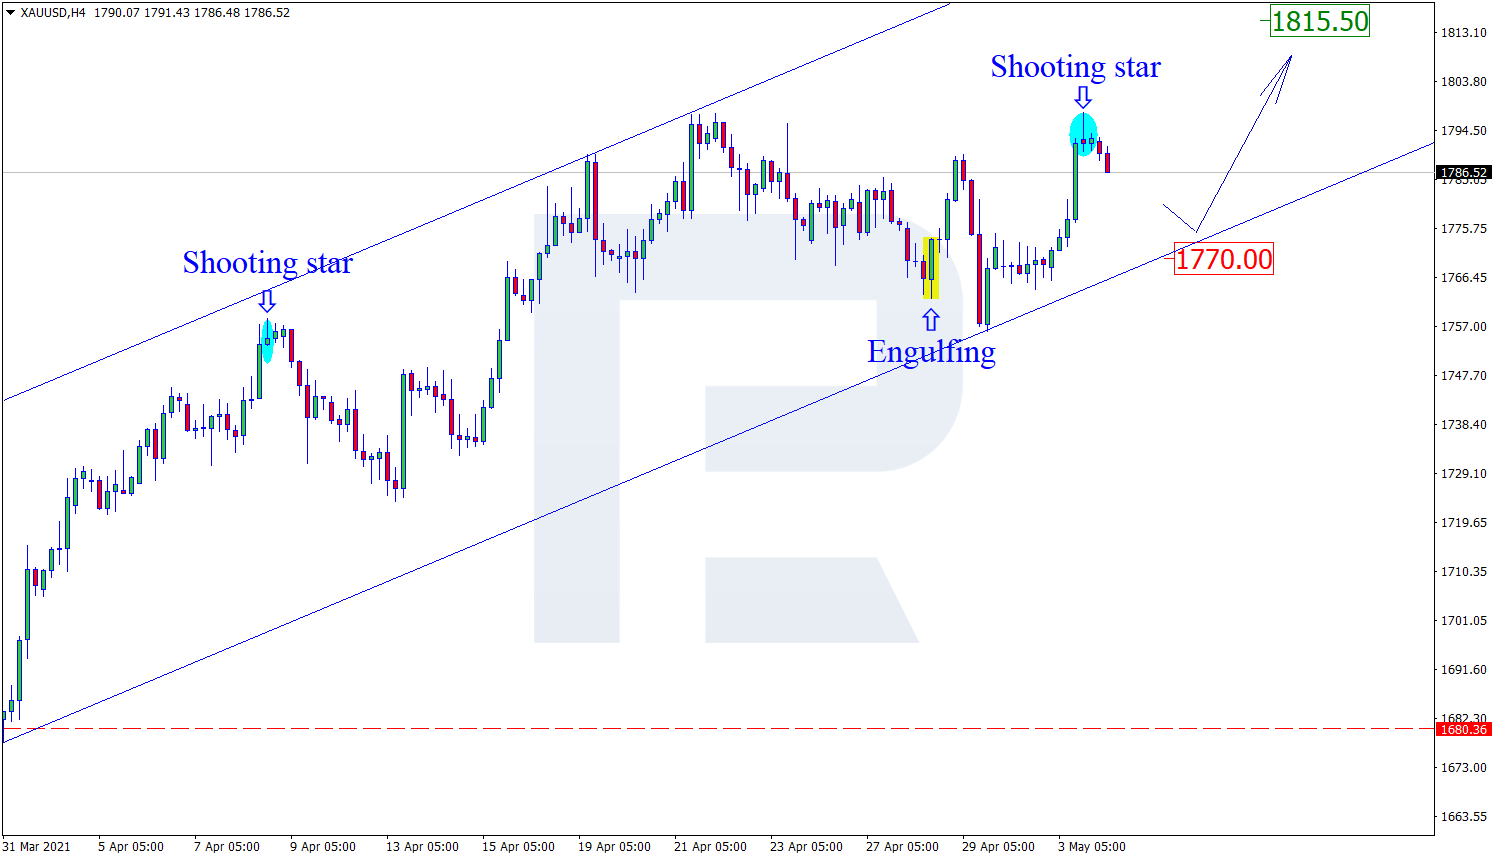
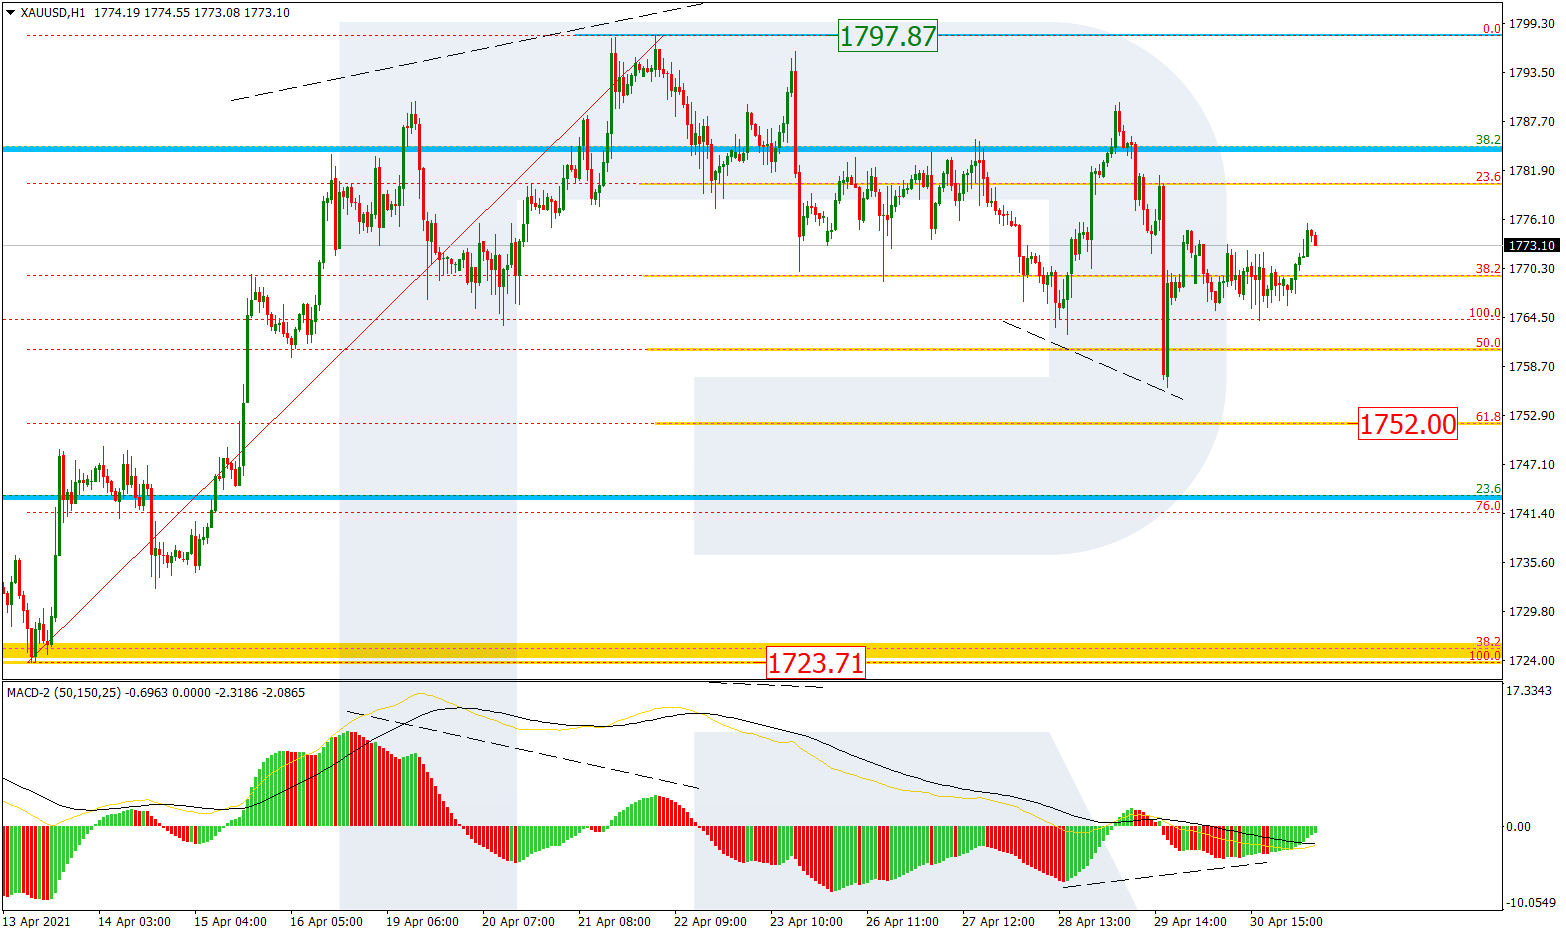
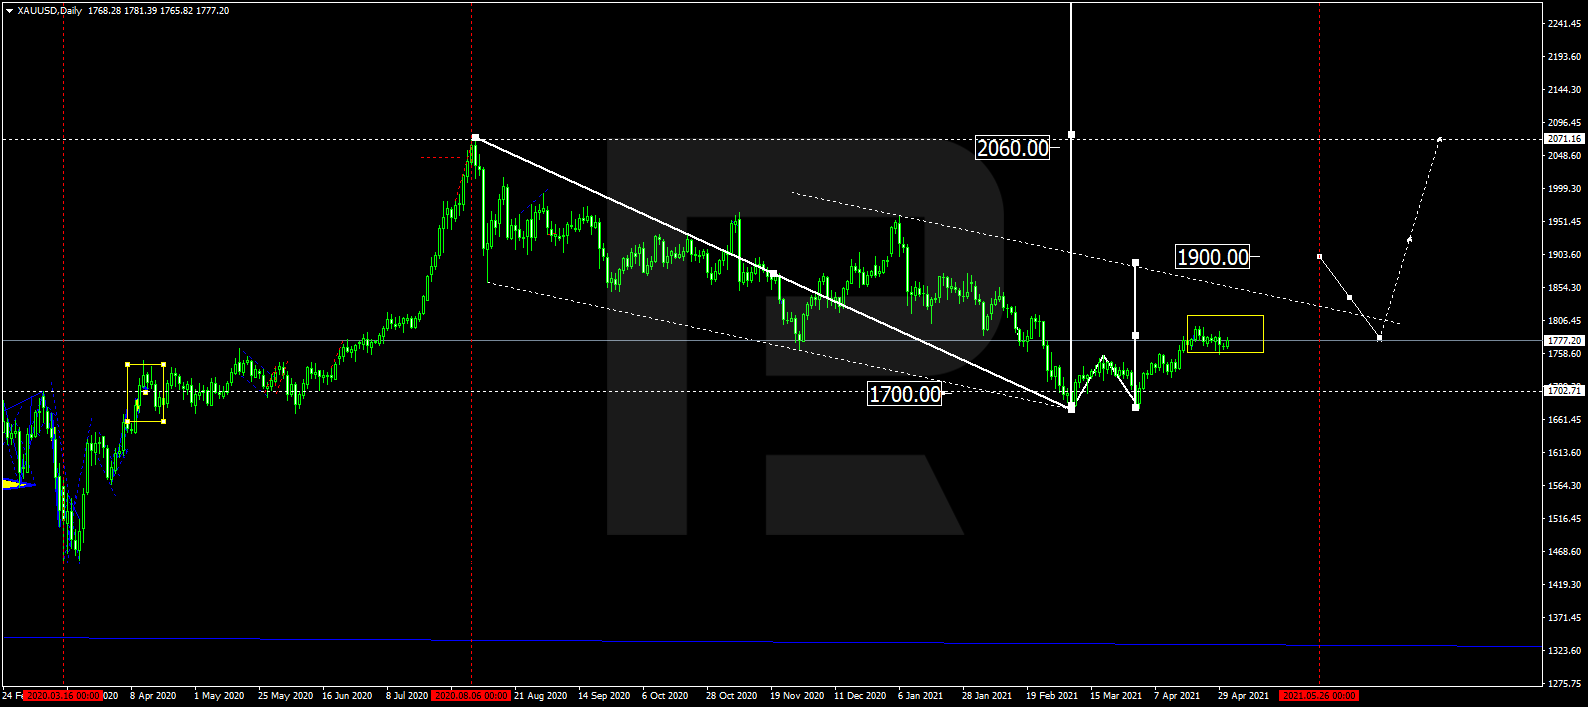
Gold is still consolidating around 1780.20. Possibly, the metal may break this range to the upside and resume trading within the uptrend towards 1825.99 or even reach the short-term 1840.00.

GOLD
Risk Warning: the result of previous trading operations do not guarantee the same results in the future

S&P 500

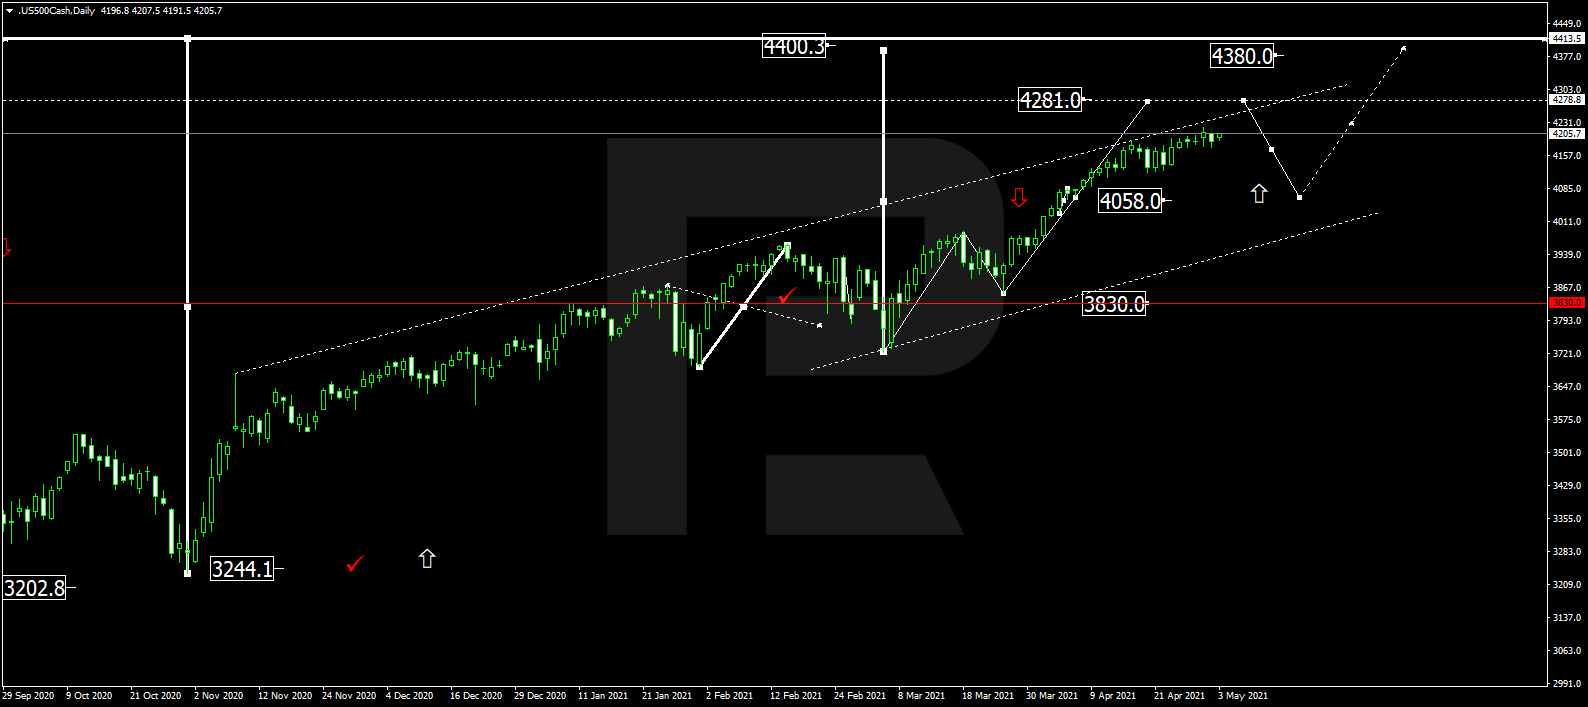
The S&P index is still consolidating around 4152.4. Today, the asset may expand the range up to 4203.0 and then start a new correction towards 4070.0. Later, the market may form one more ascending structure with the target at 4330.5.

S&P 500

Article By RoboForex.com

Attention!
Forecasts presented in this section only reflect the author’s private opinion and should not be considered as guidance for trading. RoboForex LP bears no responsibility for trading results based on trading recommendations described in these analytical reviews.

Ichimoku Cloud Analysis 26.04.2021 (AUDUSD, CADCHF, XAGUSD)

Article By RoboForex.com

AUDUSD, “Australian Dollar vs US Dollar”

AUDUSD is trading at 0.7766; the instrument is moving above Ichimoku Cloud, thus indicating an ascending tendency. The markets could indicate that the price may test the cloud’s upside border at 0.7745 and then resume moving upwards to reach 0.7895. Another signal in favor of a further uptrend will be a rebound from the support level. However, the bullish scenario may no longer be valid if the price breaks the cloud’s downside border and fixes below 0.7665. In this case, the pair may continue falling towards 0.7575. To confirm further growth, the asset must break the descending channel’s upside border and fix above 0.7805.

AUDUSD
Risk Warning: the result of previous trading operations do not guarantee the same results in the future

CADCHF, “Canadian Dollar vs Swiss Franc”

CADCHF is trading at 0.7326; the instrument is moving below Ichimoku Cloud, thus indicating a descending tendency. The markets could indicate that the price may test the cloud’s downside border at 0.7330 and then resume moving downwards to reach 0.7180. Another signal in favor of a further downtrend will be a rebound from the descending channel’s upside border. However, the bearish scenario may no longer be valid if the price breaks the cloud’s upside border and fixes above 0.7365. In this case, the pair may continue growing towards 0.7455. To confirm further decline, the asset must break the downside border of a Triangle pattern and fix below 0.7245.

CADCHF
Risk Warning: the result of previous trading operations do not guarantee the same results in the future

XAGUSD, “Silver vs US Dollar”

XAGUSD is trading at 25.93; the instrument is moving above Ichimoku Cloud, thus indicating an ascending tendency. The markets could indicate that the price may test the cloud’s upside border at 25.85 and then resume moving upwards to reach 27.50. Another signal in favor of a further uptrend will be a rebound from the rising channel’s downside border. However, the bullish scenario may no longer be valid if the price breaks the cloud’s downside border and fixes below 25.15. In this case, the pair may continue falling towards 24.25.

XAGUSD

Article By RoboForex.com

Attention!
Forecasts presented in this section only reflect the author’s private opinion and should not be considered as guidance for trading. RoboForex LP bears no responsibility for trading results based on trading recommendations described in these analytical reviews.

Major investors and hedge funds remain bullish on US indices

by JustForex

On Thursday, despite the fact that the stock market fell by an average of 1% concerning the news on Biden’s plans to raise the capital gains tax, the market rebounded very strongly on Friday, showing that investors continue to believe in rising indices. Also, the S&P 500 index was able to update its historical maximum.

Last week, oil prices fell sharply because of the news that the U.S. is drafting an anti-trust bill against OPEC. The U.S. government does not like OPEC’s restrictions on oil production. The price was decreased by 3% concerning the news on the huge imbalance of aggressive selling. And if the price goes below 60.50 (CL futures), the oil local downtrend is likely to continue. The OPEC+ meeting is expected to take place this week, and it will probably determine the oil’s fate, whether the uptrend in oil will continue or not.

Asia-Pacific stock markets closed Friday’s trading with upward movement, reacting optimistically to Chinese President Xi Jinping’s ecology-related statements. But Japan’s index declined because of the expectations of new “coronavirus” economic losses.

Main market quotes:

S&P 500 (F) 4,180.17 +45.19 (+1.09%)

Dow Jones 34,043.49 +227.59 (+0.67%)

DAX 15,279.62 -40.90 (-0.27%)

FTSE 100 6,938.56 +0.32 (+0.0046%)

USD Index 90.76 -0.1 (-0.11%)

Important events:
  • – US Core Durable Goods Orders at 15:30 (GMT+3).

by JustForex


This article reflects a personal opinion and should not be interpreted as an investment advice, and/or offer, and/or a persistent request for carrying out financial transactions, and/or a guarantee, and/or a forecast of future events.

The Analytical Overview of the Main Currency Pairs on 2021.04.26

by JustForex

The EUR/USD currency pair

Technical indicators of the currency pair:
  • Prev Open: 1.2014
  • Prev Close: 1.2097
  • % chg. over the last day: +0.69%

On Friday EUR/USD closed the day with +0.69%. One of the main reasons for that raise was positive data on German PMI. On the H1 and H4 timeframes the price is above the moving average, the MACD is in the positive zone, and local trend line also indicates an up-trend.

Trading recommendations
  • Support levels: 1.2075, 1.2049, 1.1994, 1.1957
  • Resistance levels: 1.2109, 1.2176, 1.2212, 1.2243

On the last trading day of last week the EUR/USD currency pair showed a good upward impulse movement, which indicates the strength of buyers. The priority remains upward, but the price is in front of the resistance level, so the recommendation is to look for entry buy points after pullback to the nearest support levels.

Alternate scenario: if the price breaks down through the 1.2049 level and holds below, with a high probability the price can go down to 1.1994, thereby forming a flat with the range of 1.1994-1.2075.

EUR/USD
There is no news feed for today.

The GBP/USD currency pair

Technical indicators of the currency pair:
  • Prev Open: 1.3834
  • Prev Close: 1.3874
  • % chg. over the last day: +0.29%

On Friday, the GBP/USD currency pair was trading in a relatively wide range 1.3835-1.3894. On the 4H chart, the price tested the moving average without a breakdown, which indicates the presence of buyers and protection of the support level. However on the H1, the moving average was broken on both sides, which is a sign of sideways movement. But today in the Asian session the local downtrend line was broken, which indicates local bullish pressure.

Trading recommendations
  • Support levels: 1.3835, 1.3794, 1.3756, 1.3690
  • Resistance levels: 1.3894, 1.3944, 1.3996, 1.4149

The priority remains upward. The price broke up the 1.3894 resistance and helds above the local downtrend line. On a pullback to the broken level, it is possible to look for buy trades.

Alternative scenario: if the price breaks down through the support level of 1.3835 and consolidates below it, with a high probability the price will go to 1.3756 for the test. Going below 1.3756 would cancel the bullish scenario.

GBP/USD
There is no news feed for today.

The USD/JPY currency pair

Technical indicators of the currency pair:
  • Prev Open: 107.92
  • Prev Close: 107.86
  • % chg. over the last day: -0.01%

Friday’s daily candlestick on the USD/JPY currency pair closed with a large tail down, and that indicated a sharp rejection of the price and the buyers initiative. Also don’t forget about the divergence in the MACD indicator. But on the H4 and H1, the price is still below the moving average. Also the lows and the highs are going down, and there is a downward channel.

Trading recommendations
  • Support levels: 107.47, 107.04, 105.92
  • Resistance levels: 108.19, 108.54, 109.36

The priority is still downward, but there are already the first signs of a reversal. But as long as there is no breakout of the nearest resistance level, it is better to continue open sell positions.

Alternative scenario: if the price breaks out and holds above 108.19, a local up-trend might be formed for at least a week.

USD/JPY
There is no news feed for today.

The USD/CAD currency pair

Technical indicators of the currency pair:
  • Prev Open: 1.2504
  • Prev Close: 1.2474
  • % chg. over the last day: -0.24%

Same as on Thursday, the USD/CAD currency pair continued to trade in a narrow range. On the H1 and H4, the price is still below the moving average, and inside the day sales impulse prevailed. The priority remains bearish, but there are small buyers pressure from the lower border of the flat, alse there is a hidden divergence on the MACD on H1.

Trading recommendations
  • Support levels: 1.2460, 1.2435, 1.2379
  • Resistance levels: 1.2509, 1.2519, 1.2574

The priority is still down, but the best way to sell is to wait for a pullback to the broken 1.2460 support level, which can now act as resistance or look to sell from the upper boundary of the range from the 1.2509 level.

Alternative scenario: if the price breaks out and holds above 1.2509, a local up-trend might be formed for at least a week.

USD/CAD
There is no news feed for today.

by JustForex


This article reflects a personal opinion and should not be interpreted as an investment advice, and/or offer, and/or a persistent request for carrying out financial transactions, and/or a guarantee, and/or a forecast of future events.

USD is Looking Weak

By Dmitriy Gurkovskiy, Chief Analyst at RoboForex

Early in the final week of April, EUR/USD is falling a little bit but still remains close to its seven-week highs. The asset is trading mostly at 1.2091.

The USD remains weak despite the stable statistics from the USA and the US 10-year bond yield. At the same time, the European currency is supported by the attitude of global investors to risks. The number from the Euro Area published last Friday showed that the April PMI reports in the region turned out to be better than expected, thus providing support to the Euro.

This week, market players will be focused on the US Federal Reserve System Meeting. Most likely, the Fed Chairman Jerome Powell will hint at the fact that expectations of earlier reduction of the regulator’s stimulus programs have no grounds. It may put some additional pressure on the “greenback”.

In the H4 chart, after completing the ascending wave at 1.2120, EUR/USD is consolidating at its top. If the price breaks this range to the downside, the market may resume trading downwards with the first target at 1.1890. From the technical point of view, this scenario is confirmed by MACD Oscillator: its signal line is moving above 0 outside the histogram area so far. Later, the line is expected to break leave the area and continue falling towards 0, a breakout of which will result in further decline.

As we can see in the H1 chart, EUR/USD is forming a descending impulse towards 1.2055. After that, the instrument may correct to reach 1.12085 to complete the correction. Later, the market may fall to break 1.2055 and then continue trading downwards with the target at 1.1994. From the technical point of view, this scenario is confirmed by the Stochastic Oscillator: after breaking 50 to the downside, its signal line is steadily falling towards 20.

Disclaimer

Any forecasts contained herein are based on the author’s particular opinion. This analysis may not be treated as trading advice. RoboForex bears no responsibility for trading results based on trading recommendations and reviews contained herein.

COT Currency Futures Charts: US Dollar, Euro, Canadian Dollar, New Zealand Dollar, Peso

By CountingPips.com COT Home | Data Tables | Data Downloads | Newsletter

Here are the latest charts and statistics for the Commitment of Traders (COT) data published by the Commodities Futures Trading Commission (CFTC).

The latest COT data is updated through Tuesday April 20 2021 and shows a quick view of how large traders (for-profit speculators and commercial entities) were positioned in the futures markets. All currency positions are in direct relation to the US dollar where, for example, a bet for the euro is a bet that the euro will rise versus the dollar while a bet against the euro will be a bet that the euro will decline versus the dollar.


US Dollar Index Futures:


The US Dollar Index large speculator standing this week was a net position of 3,518 contracts in the data reported through Tuesday. This was a weekly fall of -2,435 contracts from the previous week which had a total of 5,953 net contracts.

This week’s current strength score (the trader positioning range over the past three years, measured from 0 to 100) shows the speculators are currently Bearish with a score of 31.9 percent. The commercials are Bullish with a score of 63.4 percent and the small traders (not shown in chart) are Bullish with a score of 61.2 percent.

US DOLLAR INDEX StatisticsSPECULATORSCOMMERCIALSSMALL TRADERS
– Percent of Open Interest Longs:67.25.517.7
– Percent of Open Interest Shorts:57.623.88.9
– Net Position:3,518-6,7463,228
– Gross Longs:24,7072,0176,498
– Gross Shorts:21,1898,7633,270
– Long to Short Ratio:1.2 to 10.2 to 12.0 to 1
NET POSITION TREND:
– COT Index Score (3 Year Range Pct):31.963.461.2
– COT Index Reading (3 Year Range):BearishBullishBullish
NET POSITION MOVEMENT INDEX:
– 6-Week Change in Strength Index:21.4-22.413.5


Euro Currency Futures:

Euro Currency Futures
The Euro Currency Futures large speculator standing this week was a net position of 80,808 contracts in the data reported through Tuesday. This was a weekly advance of 13,957 contracts from the previous week which had a total of 66,851 net contracts.

This week’s current strength score (the trader positioning range over the past three years, measured from 0 to 100) shows the speculators are currently Bullish with a score of 59.8 percent. The commercials are Bearish with a score of 39.2 percent and the small traders (not shown in chart) are Bullish with a score of 75.5 percent.

EURO Currency StatisticsSPECULATORSCOMMERCIALSSMALL TRADERS
– Percent of Open Interest Longs:29.855.313.8
– Percent of Open Interest Shorts:17.674.86.5
– Net Position:80,808-129,23248,424
– Gross Longs:197,137365,75491,482
– Gross Shorts:116,329494,98643,058
– Long to Short Ratio:1.7 to 10.7 to 12.1 to 1
NET POSITION TREND:
– COT Index Score (3 Year Range Pct):59.839.275.5
– COT Index Reading (3 Year Range):BullishBearishBullish
NET POSITION MOVEMENT INDEX:
– 6-Week Change in Strength Index:-6.58.0-12.4


British Pound Sterling Futures:

British Pound Sterling Futures
The British Pound Sterling large speculator standing this week was a net position of 25,178 contracts in the data reported through Tuesday. This was a weekly decrease of -412 contracts from the previous week which had a total of 25,590 net contracts.

This week’s current strength score (the trader positioning range over the past three years, measured from 0 to 100) shows the speculators are currently Bullish-Extreme with a score of 92.1 percent. The commercials are Bearish-Extreme with a score of 1.8 percent and the small traders (not shown in chart) are Bullish-Extreme with a score of 100.0 percent.

BRITISH POUND StatisticsSPECULATORSCOMMERCIALSSMALL TRADERS
– Percent of Open Interest Longs:37.237.124.5
– Percent of Open Interest Shorts:21.864.612.3
– Net Position:25,178-45,19620,018
– Gross Longs:61,05360,90940,167
– Gross Shorts:35,875106,10520,149
– Long to Short Ratio:1.7 to 10.6 to 12.0 to 1
NET POSITION TREND:
– COT Index Score (3 Year Range Pct):92.11.8100.0
– COT Index Reading (3 Year Range):Bullish-ExtremeBearish-ExtremeBullish-Extreme
NET POSITION MOVEMENT INDEX:
– 6-Week Change in Strength Index:-6.3-0.520.4


Japanese Yen Futures:


The Japanese Yen large speculator standing this week was a net position of -59,819 contracts in the data reported through Tuesday. This was a weekly decrease of -1,507 contracts from the previous week which had a total of -58,312 net contracts.

This week’s current strength score (the trader positioning range over the past three years, measured from 0 to 100) shows the speculators are currently Bearish with a score of 33.4 percent. The commercials are Bullish with a score of 70.6 percent and the small traders (not shown in chart) are Bearish with a score of 25.1 percent.

JAPANESE YEN StatisticsSPECULATORSCOMMERCIALSSMALL TRADERS
– Percent of Open Interest Longs:16.471.111.2
– Percent of Open Interest Shorts:53.124.421.2
– Net Position:-59,81976,083-16,264
– Gross Longs:26,617115,71518,258
– Gross Shorts:86,43639,63234,522
– Long to Short Ratio:0.3 to 12.9 to 10.5 to 1
NET POSITION TREND:
– COT Index Score (3 Year Range Pct):33.470.625.1
– COT Index Reading (3 Year Range):BearishBullishBearish
NET POSITION MOVEMENT INDEX:
– 6-Week Change in Strength Index:-40.030.92.0


Swiss Franc Futures:

Swiss Franc Futures:

The Swiss Franc large speculator standing this week was a net position of -1,642 contracts in the data reported through Tuesday. This was a weekly reduction of -2,466 contracts from the previous week which had a total of 824 net contracts.

This week’s current strength score (the trader positioning range over the past three years, measured from 0 to 100) shows the speculators are currently Bullish with a score of 70.8 percent. The commercials are Bearish with a score of 41.9 percent and the small traders (not shown in chart) are Bearish with a score of 36.7 percent.

SWISS FRANC StatisticsSPECULATORSCOMMERCIALSSMALL TRADERS
– Percent of Open Interest Longs:27.349.323.1
– Percent of Open Interest Shorts:31.319.548.9
– Net Position:-1,64212,276-10,634
– Gross Longs:11,26420,3299,550
– Gross Shorts:12,9068,05320,184
– Long to Short Ratio:0.9 to 12.5 to 10.5 to 1
NET POSITION TREND:
– COT Index Score (3 Year Range Pct):70.841.936.7
– COT Index Reading (3 Year Range):BullishBearishBearish
NET POSITION MOVEMENT INDEX:
– 6-Week Change in Strength Index:-24.918.5-3.8


Canadian Dollar Futures:


The Canadian Dollar large speculator standing this week was a net position of 13,246 contracts in the data reported through Tuesday. This was a weekly advance of 10,840 contracts from the previous week which had a total of 2,406 net contracts.

This week’s current strength score (the trader positioning range over the past three years, measured from 0 to 100) shows the speculators are currently Bullish with a score of 66.0 percent. The commercials are Bearish with a score of 21.2 percent and the small traders (not shown in chart) are Bullish-Extreme with a score of 88.9 percent.

CANADIAN DOLLAR StatisticsSPECULATORSCOMMERCIALSSMALL TRADERS
– Percent of Open Interest Longs:31.141.526.9
– Percent of Open Interest Shorts:23.465.310.7
– Net Position:13,246-41,15027,904
– Gross Longs:53,82471,85846,500
– Gross Shorts:40,578113,00818,596
– Long to Short Ratio:1.3 to 10.6 to 12.5 to 1
NET POSITION TREND:
– COT Index Score (3 Year Range Pct):66.021.288.9
– COT Index Reading (3 Year Range):BullishBearishBullish-Extreme
NET POSITION MOVEMENT INDEX:
– 6-Week Change in Strength Index:1.91.0-5.6


Australian Dollar Futures:


The Australian Dollar large speculator standing this week was a net position of -1,806 contracts in the data reported through Tuesday. This was a weekly reduction of -5,565 contracts from the previous week which had a total of 3,759 net contracts.

This week’s current strength score (the trader positioning range over the past three years, measured from 0 to 100) shows the speculators are currently Bullish with a score of 79.8 percent. The commercials are Bearish-Extreme with a score of 9.2 percent and the small traders (not shown in chart) are Bullish-Extreme with a score of 92.5 percent.

AUSTRALIAN DOLLAR StatisticsSPECULATORSCOMMERCIALSSMALL TRADERS
– Percent of Open Interest Longs:41.734.023.3
– Percent of Open Interest Shorts:43.044.511.4
– Net Position:-1,806-14,29016,096
– Gross Longs:56,72346,34931,677
– Gross Shorts:58,52960,63915,581
– Long to Short Ratio:1.0 to 10.8 to 12.0 to 1
NET POSITION TREND:
– COT Index Score (3 Year Range Pct):79.89.292.5
– COT Index Reading (3 Year Range):BullishBearish-ExtremeBullish-Extreme
NET POSITION MOVEMENT INDEX:
– 6-Week Change in Strength Index:-11.05.67.2


New Zealand Dollar Futures:


The New Zealand Dollar large speculator standing this week was a net position of 4,322 contracts in the data reported through Tuesday. This was a weekly lift of 1,802 contracts from the previous week which had a total of 2,520 net contracts.

This week’s current strength score (the trader positioning range over the past three years, measured from 0 to 100) shows the speculators are currently Bullish with a score of 78.5 percent. The commercials are Bearish with a score of 20.8 percent and the small traders (not shown in chart) are Bullish with a score of 74.6 percent.

NEW ZEALAND DOLLAR StatisticsSPECULATORSCOMMERCIALSSMALL TRADERS
– Percent of Open Interest Longs:53.431.512.9
– Percent of Open Interest Shorts:42.846.98.2
– Net Position:4,322-6,2281,906
– Gross Longs:21,69512,8165,227
– Gross Shorts:17,37319,0443,321
– Long to Short Ratio:1.2 to 10.7 to 11.6 to 1
NET POSITION TREND:
– COT Index Score (3 Year Range Pct):78.520.874.6
– COT Index Reading (3 Year Range):BullishBearishBullish
NET POSITION MOVEMENT INDEX:
– 6-Week Change in Strength Index:-21.520.6-6.4


Mexican Peso Futures:


The Mexican Peso large speculator standing this week was a net position of -3,554 contracts in the data reported through Tuesday. This was a weekly rise of 8,424 contracts from the previous week which had a total of -11,978 net contracts.

This week’s current strength score (the trader positioning range over the past three years, measured from 0 to 100) shows the speculators are currently Bearish-Extreme with a score of 13.0 percent. The commercials are Bullish-Extreme with a score of 85.4 percent and the small traders (not shown in chart) are Bullish with a score of 64.5 percent.

MEXICAN PESO StatisticsSPECULATORSCOMMERCIALSSMALL TRADERS
– Percent of Open Interest Longs:46.447.15.4
– Percent of Open Interest Shorts:48.848.11.9
– Net Position:-3,554-1,5015,055
– Gross Longs:68,01268,9597,910
– Gross Shorts:71,56670,4602,855
– Long to Short Ratio:1.0 to 11.0 to 12.8 to 1
NET POSITION TREND:
– COT Index Score (3 Year Range Pct):13.085.464.5
– COT Index Reading (3 Year Range):Bearish-ExtremeBullish-ExtremeBullish
NET POSITION MOVEMENT INDEX:
– 6-Week Change in Strength Index:-2.70.915.3


Brazilian Real Futures:


The Brazilian Real large speculator standing this week was a net position of -25,995 contracts in the data reported through Tuesday. This was a weekly boost of 596 contracts from the previous week which had a total of -26,591 net contracts.

This week’s current strength score (the trader positioning range over the past three years, measured from 0 to 100) shows the speculators are currently Bearish with a score of 41.8 percent. The commercials are Bullish with a score of 60.0 percent and the small traders (not shown in chart) are Bullish with a score of 74.4 percent.

BRAZIL REAL StatisticsSPECULATORSCOMMERCIALSSMALL TRADERS
– Percent of Open Interest Longs:27.465.55.8
– Percent of Open Interest Shorts:80.612.95.3
– Net Position:-25,99525,743252
– Gross Longs:13,40732,0292,850
– Gross Shorts:39,4026,2862,598
– Long to Short Ratio:0.3 to 15.1 to 11.1 to 1
NET POSITION TREND:
– COT Index Score (3 Year Range Pct):41.860.074.4
– COT Index Reading (3 Year Range):BearishBullishBullish
NET POSITION MOVEMENT INDEX:
– 6-Week Change in Strength Index:-4.44.7-1.8


Russian Ruble Futures:


The Russian Ruble large speculator standing this week was a net position of 6,852 contracts in the data reported through Tuesday. This was a weekly gain of 539 contracts from the previous week which had a total of 6,313 net contracts.

This week’s current strength score (the trader positioning range over the past three years, measured from 0 to 100) shows the speculators are currently Bearish with a score of 29.6 percent. The commercials are Bullish with a score of 69.9 percent and the small traders (not shown in chart) are Bearish with a score of 41.9 percent.

RUSSIAN RUBLE StatisticsSPECULATORSCOMMERCIALSSMALL TRADERS
– Percent of Open Interest Longs:30.063.07.0
– Percent of Open Interest Shorts:5.087.97.1
– Net Position:6,852-6,831-21
– Gross Longs:8,21217,2331,929
– Gross Shorts:1,36024,0641,950
– Long to Short Ratio:6.0 to 10.7 to 11.0 to 1
NET POSITION TREND:
– COT Index Score (3 Year Range Pct):29.669.941.9
– COT Index Reading (3 Year Range):BearishBullishBearish
NET POSITION MOVEMENT INDEX:
– 6-Week Change in Strength Index:20.0-18.2-17.1


Bitcoin Futures:

Bitcoin Futures

The Bitcoin Futures large speculator standing this week was a net position of -2,272 contracts in the data reported through Tuesday. This was a weekly advance of 193 contracts from the previous week which had a total of -2,465 net contracts.

This week’s current strength score (the trader positioning range over the past three years, measured from 0 to 100) shows the speculators are currently Bearish with a score of 40.0 percent. The commercials are Bullish-Extreme with a score of 81.0 percent and the small traders (not shown in chart) are Bullish with a score of 53.6 percent.

BITCOIN StatisticsSPECULATORSCOMMERCIALSSMALL TRADERS
– Percent of Open Interest Longs:58.46.030.1
– Percent of Open Interest Shorts:84.12.38.1
– Net Position:-2,2723311,941
– Gross Longs:5,1475302,652
– Gross Shorts:7,419199711
– Long to Short Ratio:0.7 to 12.7 to 13.7 to 1
NET POSITION TREND:
– COT Index Score (3 Year Range Pct):40.081.053.6
– COT Index Reading (3 Year Range):BearishBullish-ExtremeBullish
NET POSITION MOVEMENT INDEX:
– 6-Week Change in Strength Index:-10.123.95.9


Article By CountingPips.comReceive our weekly COT Reports by Email

*COT Report: The COT data, released weekly to the public each Friday, is updated through the most recent Tuesday (data is 3 days old) and shows a quick view of how large speculators or non-commercials (for-profit traders) were positioned in the futures markets.

The CFTC categorizes trader positions according to commercial hedgers (traders who use futures contracts for hedging as part of the business), non-commercials (large traders who speculate to realize trading profits) and nonreportable traders (usually small traders/speculators).

Find CFTC criteria here: (http://www.cftc.gov/MarketReports/CommitmentsofTraders/ExplanatoryNotes/index.htm).

Ichimoku Cloud Analysis 23.04.2021 (EURUSD, AUDNZD, XAUUSD)

Article By RoboForex.com

EURUSD, “Euro vs US Dollar”

EURUSD is trading at 1.2025; the instrument is moving above Ichimoku Cloud, thus indicating an ascending tendency. The markets could indicate that the price may test the cloud’s downside border at 1.1975 and then resume moving upwards to reach 1.2225. Another signal in favor of a further uptrend will be a rebound from the descending channel’s upside border. However, the bullish scenario may be canceled if the price breaks the cloud’s downside border and fixes below 1.1950. In this case, the pair may continue falling towards 1.1860. To confirm further growth, the asset must break the descending trendline and fix above 1.2150.

EURUSD
Risk Warning: the result of previous trading operations do not guarantee the same results in the future

AUDNZD, “Australian Dollar vs New Zealand Dollar”

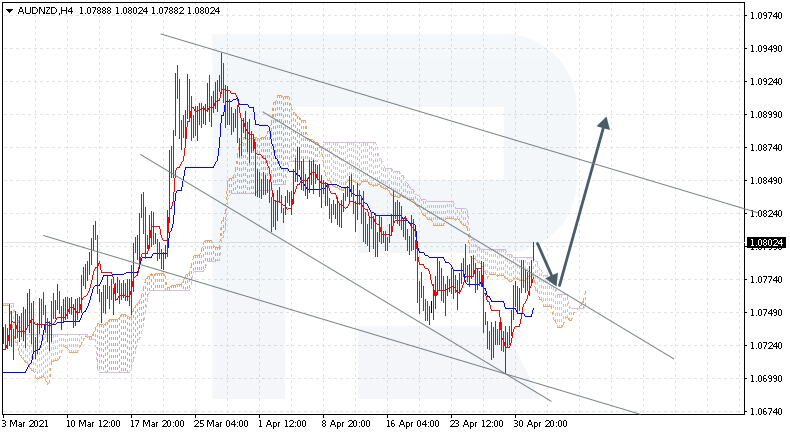
AUDNZD is trading at 1.0769; the instrument is moving below Ichimoku Cloud, thus indicating a descending tendency. The markets could indicate that the price may test the cloud’s downside border at 1.0790 and then resume moving downwards to reach 1.0710. Another signal in favor of a further downtrend will be a rebound from the descending channel’s upside border. However, the bearish scenario may no longer be valid if the price breaks the cloud’s upside border and fixes above 1.0825. In this case, the pair may continue growing towards 1.0915.

AUDNZD
Risk Warning: the result of previous trading operations do not guarantee the same results in the future

XAUUSD, “Gold vs US Dollar”

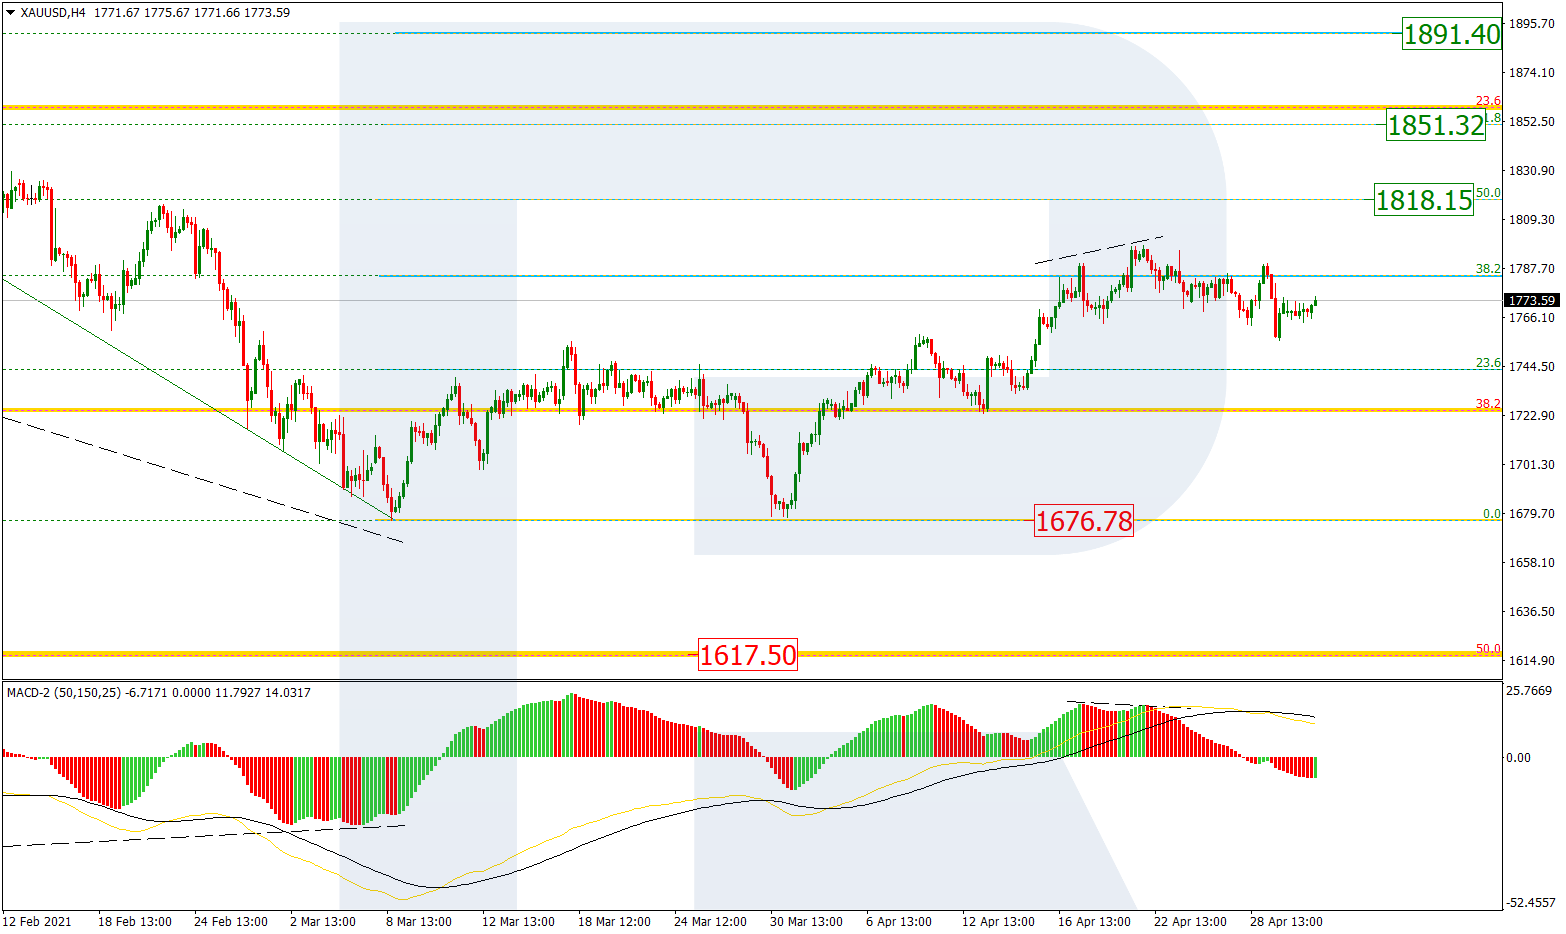
XAUUSD is trading at 1784.00; the instrument is moving above Ichimoku Cloud, thus indicating an ascending tendency. The markets could indicate that the price may test the cloud’s upside border at 1765.00 and then resume moving upwards to reach 1845.00. Another signal in favor of a further uptrend will be a rebound from the rising channel’s downside border. However, the bullish scenario may no longer be valid if the price breaks the cloud’s downside border and fixes below 1745.00. In this case, the pair may continue falling towards 1665.00.

XAUUSD

Article By RoboForex.com

Attention!
Forecasts presented in this section only reflect the author’s private opinion and should not be considered as guidance for trading. RoboForex LP bears no responsibility for trading results based on trading recommendations described in these analytical reviews.

The Analytical Overview of the Main Currency Pairs on 2021.04.23

by JustForex

The EUR/USD currency pair

Technical indicators of the currency pair:
  • Prev Open: 1.2029
  • Prev Close: 1.2015
  • % chg. over the last day: -0.11%

Yesterday the EUR/USD pair was trading in a downtrend and closed the day with -0.11%. On the H1 and the H4 timeframes, the price is above the moving average. The MACD on the H4 is in the positive zone. Buying is the priority.

Trading recommendations
  • Support levels: 1.1990, 1.1927, 1.1860, 1.1797, 1.1700
  • Resistance levels: 1.2080, 1.2100, 1.2242

Yesterday, the currency pair tested the 1.1990 support level and showed an uptrend on lower timeframes. In the future, we recommend looking for entry points for buying after the price breaks out and gains a foothold above the level of 1.2080.

Alternative scenario: after the price breaks through the 1.1990 level, the price may go to the 1.1927 support level.

EUR/USD
News feed for 2021.04.23:
  • – US New Home Sales (Mar) at 17:00 (GMT+3);
  • – A Speech by Christine Lagarde, President of the ECB at 17:30 (GMT+3).

The GBP/USD currency pair

Technical indicators of the currency pair:
  • Prev Open: 1.3922
  • Prev Close: 1.3839
  • % chg. over the last day: -0.59%

Yesterday, the GBP/USD currency pair was trading in a downtrend and closed the day with a result of -0.59%. On the hourly chart, GBP/USD is trading above the 200-day moving average. The situation is similar on the four-hour chart. At this point, it is best to consider buying the instrument.

Trading recommendations
  • Support levels: 1.3807, 1.3750, 1.3667
  • Resistance levels: 1.3884, 1.3918, 1.4008

Yesterday, the currency pair tested the moving averages on the H1 and H4 timeframes. We assume that the pair will continue to grow. It is best to consider buying entry points after the price breaks out and fixes above the level of 1.3918.

Alternative scenario: after the price breaks down and consolidates below the level of 1.3807, short positions to 1.3750 can be considered.

GBP/USD
News feed for 2021.04.23:
  • – US New Home Sales (Mar) at 17:00 (GMT+3).

The USD/JPY currency pair

Technical indicators of the currency pair:
  • Prev Open: 108.05
  • Prev Close: 107.96
  • % chg. over the last day: -0.08%

Yesterday, the USD/JPY pair traded in a narrow range, showing a change of -0.08%. On the H1 and H4 timeframes, the price is below the moving average, which tells us about the continuation of the downward movement. It is best to look for entry points to sell.

Trading recommendations
  • Support levels: 107.87, 107.00
  • Resistance levels: 108.60, 109.08, 109.75

At the moment, we are considering selling the instrument. The main scenario is looking for a sell entry point after price correction to 108.60 or after breaking through the level of 107.87. It is also worth paying attention to the MACD divergence, which may signal a trend reversal.

Alternative scenario: if the price breaks through and consolidates above the level of 108.60, it is worth considering buying to the level of 109.08.

USD/JPY
News feed for 2021.04.23:
  • – US New Home Sales (Mar) at 17:00 (GMT+3).

The USD/CAD currency pair

Technical indicators of the currency pair:
  • Prev Open: 1.2495
  • Prev Close: 1.2503
  • % chg. over the last day: +0.07%

Yesterday, the USD/CAD pair was trading in a narrow range of 1.2475 – 1.2515, showing a +0.07% change. At the moment, the currency pair is below the moving average. The MACD indicator is in the negative zone. It is worth considering selling the instrument.

Trading recommendations
  • Support levels: 1.2475, 1.2364
  • Resistance levels: 1.2531, 1.2628

At the moment, we are considering selling the instrument. The entry point should be looked for after the price breaks down and consolidates below the level of 1.2475.

Alternative scenario: after breaking out and consolidating above the level of 1.2531, you can open buy deals to 1.2628.

USD/CAD
News feed for 2021.04.23:
  • – US New Home Sales (Mar) at 17:00 (GMT+3).

by JustForex


This article reflects a personal opinion and should not be interpreted as an investment advice, and/or offer, and/or a persistent request for carrying out financial transactions, and/or a guarantee, and/or a forecast of future events.

Fibonacci Retracements Analysis 23.04.2021 (AUDUSD, USDCAD)

Article By RoboForex.com

AUDUSD, “Australian Dollar vs US Dollar”

As we can see in the H4 chart, a convergence on MACD made AUDUSD return to 23.6% fibo and form another pullback there, which may be later followed by a further uptrend towards the high at 0.8007 and the long-term 50.0% fibo at 0.8292. On the other hand, the instrument may yet rebound from the high and resume its decline towards 50.0% and 61.8% fibo at 0.7500 and 0.7380 respectively.

AUDUSD_H4
Risk Warning: the result of previous trading operations do not guarantee the same results in the future

The H1 chart shows that convergence on MACD is signaling that the local correction may be over. Later, the price may continue growing towards 61.8% and 76.0% fibo at 0.7826 and 0.7893 respectively. The local support is the low at 0.7532.

AUDUSD_H1
Risk Warning: the result of previous trading operations do not guarantee the same results in the future

USDCAD, “US Dollar vs Canadian Dollar”

In the H4 chart, USDCAD is trading sideways and correcting after finishing the descending wave. The asset is stuck between 23.6% and 50.0% fibo. Also, there is a divergence on MACD, which may indicate a possible wave to the downside towards the local and fractal lows at 1.2365 and 1.2061 respectively. However, if the price rebounds from the low, the pair may resume growing to reach 61.8% and 76.0% fibo at 1.2683 and 1.2757 respectively but the key upside target is the local high at 1.2881.

USDCAD_H4
Risk Warning: the result of previous trading operations do not guarantee the same results in the future

The H1 chart shows a more detailed structure of the current bearish impulse, which has already reached 61.8% fibo. Later, the asset may resume falling towards 76.0% fibo at 1.2434, a rebound from which may result in a new rising movement to reach the local high at 1.2654.

USDCAD_H1

Article By RoboForex.com

Attention!
Forecasts presented in this section only reflect the author’s private opinion and should not be considered as guidance for trading. RoboForex LP bears no responsibility for trading results based on trading recommendations described in these analytical reviews.

US stock market declined because of the reports of Biden’s plans to raise taxes for the wealthy people

by JustForex

On Thursday, the American stock market decreased by an average of 1% after the reports of US President Joe Biden’s plans to a capital gains tax from 20% to 39.6%.

Last week, the number of initial jobless claims decreased by 39 thousand – to 547 thousand American people. In March, sales in the secondary housing market fell by 3.7% and amounted to 6.01 million homes with reference to the yearly rate in the United States.

The median purchase price of the house in the secondary market increased by a record 17.2% in a year – to the maximum in the history of $329.1 thousand. The prices have increased all over the country.

The Russian ruble has strengthened to the level of 75.02 against the background of yesterday’s statements about the withdrawal of Russian troops from the borders of Ukraine.

Oil prices are rising on Friday, but end the week with a decline amid mixed signals about near-term demand prospects. Since the beginning of this week, Brent has lost 1.4% ($65.82), WTI – 1.9% ($61.83).

On Friday morning, stocks in the Asia-Pacific region went up, stabilizing after the sweeping decline of their American counterparts.

Main market quotes:

S&P 500 (F) 4,138.12 +10.37 (+0.25%)

Dow Jones 33,815.90 -321.41 (-0.94%)

DAX 15,301.90 -18.62 (-0.12%)

FTSE 100 6,924.04 -14.20 (-0.20%)

USD Index 91.025 -0.296 (-0.32%)

Important events:
  • – UK PMI at 11:30 (GMT+3);
  • – USA PMI at 16:45 (GMT+3);
  • – European Central Bank President Lagarde Speech at 17:00 (GMT+3).

by JustForex


This article reflects a personal opinion and should not be interpreted as an investment advice, and/or offer, and/or a persistent request for carrying out financial transactions, and/or a guarantee, and/or a forecast of future events.