Archive for Forex and Currency News – Page 280

Technical Outlook: GBPUSD Surges Above 1.41

By Lukman Otunuga Research Analyst, ForexTime

Pound bulls dominated the scene on Monday as investors welcomed an easing political risk for the United Kingdom.

The falling likelihood of a second Scottish independence referendum in the near term following last week’s election boosted buying sentiment towards Sterling. A broadly weaker dollar also played a role in propelling the GBPUSD to its highest level since February 25th.

With Covid-19 cases falling, two-thirds of UK adults receiving a first dose of the vaccine and the next phase of lockdown easing scheduled on May 17th, the economic outlook for the post-pandemic UK remains bright. This may translate into a stronger Pound over the next few weeks.

Can the GBPUSD push higher?

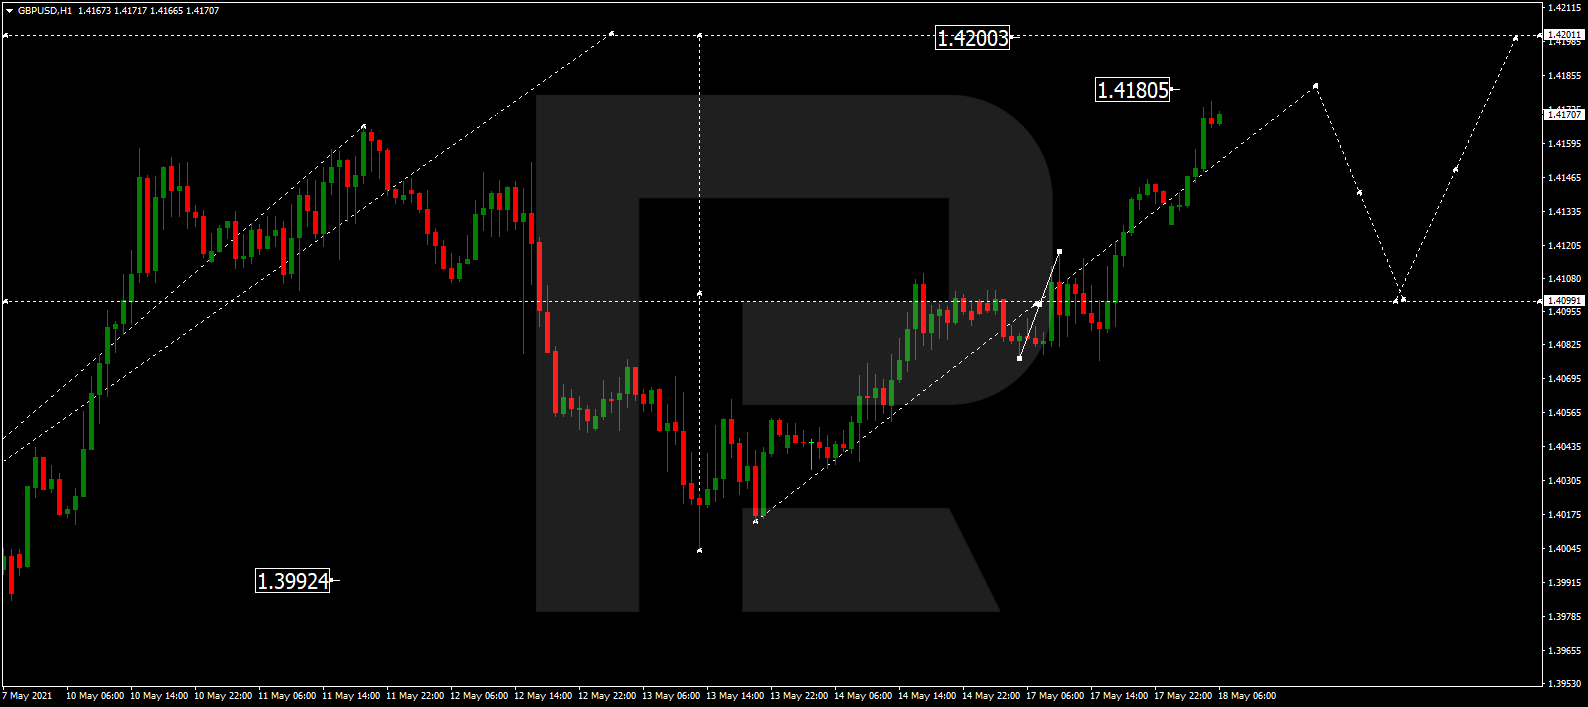
Looking at the daily charts, the technicals are heavily bullish. The GBPUSD has jumped over 150 pips today and a total of 350+ pips since the start of May! Prices are trading comfortably above the 20-day and 50-day Simple Moving Average while the MACD trades above zero. A solid daily close above 1.4100 could provide a platform for bulls to springboard prices towards 1.4200 and the 2021 high of 1.4240.

One thing to keep in mind is that the Relative Strength Index (RSI) is very close to hitting 70 which suggests that the GBPUSD is overbought and may be primed for a technical pullback. Should prices fail to keep above 1.4100, a decline back towards 1.4000 and lower could be on the cards.

Zooming out on the weekly charts, there have been consistently higher highs and higher lows. Prices are trading above the 20-week Simple Moving Average while the MACD trades above zero. A strong weekly close above the 1.4000 resistance could encourage an incline towards 1.4240 which is the 2021 high. A move beyond this point could see the GBPUSD test 1.4350 – a level not seen April 2018.

Disclaimer: The content in this article comprises personal opinions and should not be construed as containing personal and/or other investment advice and/or an offer of and/or solicitation for any transactions in financial instruments and/or a guarantee and/or prediction of future performance. ForexTime (FXTM), its affiliates, agents, directors, officers or employees do not guarantee the accuracy, validity, timeliness or completeness, of any information or data made available and assume no liability as to any loss arising from any investment based on the same.


Forex-Time-LogoArticle by ForexTime

ForexTime Ltd (FXTM) is an award winning international online forex broker regulated by CySEC 185/12 www.forextime.com

After a good first quarter in April the dollar lost ground against the main currencies

By Admiral Markets

If during the first quarter of this year we commented that the U.S. dollar was experiencing a rebound against the main currencies, and as we commented in past analyses, during last April, the dollar yielded 2.11% compared to the main currencies with a decrease reflected in the dollar index from the $93.36 with which it opened last April to the $91.27 rate at the end of the month.

This decline can be explained by the relaxation in the yields of North American bonds and the uncertainty in relation to whether or not the Federal Reserve will finally make a decision on its current monetary policy, in terms of tightening it due to the economic recovery. However, these doubts seem to have dissipated for the moment, following the bad unemployment data on Friday.

Specifically, in the employment data for last April, we can see that not only were they not lower than those of last month, but they fell far short of market expectations after creating 266,000 jobs compared to the 770,000 expected, negatively impacting the dollar.

EURUSD analysis

Market attention last week focused mainly on employment data from the United States after the important NFP was released on Friday. This data was especially bad, since 266,000 jobs were created compared to the 770,000 expected, affecting the dollar significantly, so the EURUSD managed to overcome the medium-term downtrend line.

Technically speaking, the break of this trend line can cause a new upward momentum that takes the price to levels not seen since the beginning of the year, although for this we must be attentive as to whether the price is able to maintain this break. On the contrary, the loss of the 18 session average would in turn endanger the 1.20 level and open the doors to a further decline.

Source: Daily chart of the EURUSD of the Admiral Markets MetaTrader 5 platform from January 23, 2020 to May 10, 2021. Taken on May 10 at 12:45 CEST. Note: Past performance is not a reliable indicator of future results, or future performance.


Evolution of the last 5 years:

  • 2020 = + 8.93%
  • 2019 = -2.21%
  • 2018 = -4.47%
  • 2017 = + 14.09%
  • 2016 = -3.21%

GBPUSD analysis

In the case of GBPUSD, we can see that this pair is following a very clear upward trend since it marked minimums on March 20, 2020 around the level of 1.14100 until it almost reached the level of 1.42366, which led it to exceed its long-term downtrend line (in dotted red).

As we can see in the weekly chart, after marking maximums last February, the EURUSD price began a correction that led it to lose the important level of 1.40. This was in search of its average of 18 sessions, where it has found an important support point to start a new momentum that has led it to break above not only the 1.40 level but also to trade at levels close to 1.41.

As long as the price does not lose its average of 18, the feeling will continue to be bullish. The final loss of the 1.40 and the 18 average would unlock a further correction to the previous resistance level in red.

Source: GBPUSD weekly chart from Admiral Markets MetaTrader 5 platform from September 28, 2014 to May 10, 2021. Taken on May 10 at 1:10 p.m. CEST Note: Past performance is not a reliable indicator of future results, or future performance.


Evolution of the last 5 years:

  • 2020 = + 3.10%
  • 2019 = + 3.95%
  • 2018 = -5.54%
  • 2017 = + 9.43%
  • 2016 = -16.26%

USDJPY Analysis

Finally, if we take a look at the USDJPY pair, we can observe how the Japanese Yen was one of the currencies that was greatly affected by the increases in the dollar. This is because, during the rises in February and March, it went from trading at levels close to 102,700 to trading at levels close to 111,000. As we can see in the weekly chart, after facing its important support level for a long time, represented by the red band, the price definitely bounced past the 200 red average and the long-term downtrend line.

As we have commented previously, during the month of April this currency pair fell by 1.29%, leading the price to find the coincident zone of its 200 session average and the downtrend line, thus leaving the accumulated overbought.

Technically speaking, we must pay attention to the evolution of the price in the coming weeks, since if the price confirms the upward break of the previous resistance levels that currently act as the main support, the price could look for the upper band of the lateral channel in green. On the contrary, if the price re-enters lower levels, we could obtain a greater correction.

Source: Weekly USDJPY chart from Admiral Markets MetaTrader 5 platform from December 14, 2014 to May 10, 2021. Taken on May 10 at 1:15 PM CEST. Note: Past performance is not a reliable indicator of future results, or future performance.


Evolution of the last 5 years:

  • 2020 = -4.95%
  • 2019 = -0.88%
  • 2018 = -2.76%
  • 2017 = -3.59%
  • 2016 = -2.85%

Discover Premium Analytics

With Premium Analytics, you can follow all the important news and get the latest macroeconomic data through the news and the economic calendar offered by Dow Jones:

With the Admirals Trade.MT5 account, you can trade Contracts for Differences (CFDs) on EURUSD, GBPUSD and USDJPY and many more instruments. CFDs allow traders to try to profit from bull and bear markets, as well as the use of leverage. Click on the following banner to open an account today:


Trade With MetaTrader 5

INFORMATION ABOUT ANALYTICAL MATERIALS:

The given data provides additional information regarding all analysis, estimates, prognosis, forecasts, market reviews, weekly outlooks or other similar assessments or information (hereinafter “Analysis”) published on the websites of Admiral Markets investment firms operating under the Admiral Markets trademark (hereinafter “Admiral Markets”) Before making any investment decisions please pay close attention to the following:

  1. This is a marketing communication. The content is published for informative purposes only and is in no way to be construed as investment advice or recommendation. It has not been prepared in accordance with legal requirements designed to promote the independence of investment research, and that it is not subject to any prohibition on dealing ahead of the dissemination of investment research.
  2. Any investment decision is made by each client alone whereas Admiral Markets shall not be responsible for any loss or damage arising from any such decision, whether or not based on the content.
  3. With view to protecting the interests of our clients and the objectivity of the Analysis, Admiral Markets has established relevant internal procedures for prevention and management of conflicts of interest.
  4. The Analysis is prepared by an independent analyst, Roberto Rojas (analyst), (hereinafter “Author”) based on their personal estimations.
  5. Whilst every reasonable effort is taken to ensure that all sources of the content are reliable and that all information is presented, as much as possible, in an understandable, timely, precise and complete manner, Admiral Markets does not guarantee the accuracy or completeness of any information contained within the Analysis.
  6. Any kind of past or modeled performance of financial instruments indicated within the content should not be construed as an express or implied promise, guarantee or implication by Admiral Markets for any future performance. The value of the financial instrument may both increase and decrease and the preservation of the asset value is not guaranteed.
  7. Leveraged products (including contracts for difference) are speculative in nature and may result in losses or profit. Before you start trading, please ensure that you fully understand the risks involved.

By Admiral Markets

Ichimoku Cloud Analysis 10.05.2021 (AUDUSD, NZDJPY, USDCAD)

Article By RoboForex.com

AUDUSD, “Australian Dollar vs US Dollar”

AUDUSD is trading at 0.7854; the instrument is moving above Ichimoku Cloud, thus indicating an ascending tendency. The markets could indicate that the price may test Tenkan-Sen and Kijun-Sen at 0.7795 and then resume moving downwards to reach 0.7985. Another signal in favor of a further uptrend will be a rebound from the upside border of the descending channel, which was earlier broken by bulls to the upside. However, the bullish scenario may no longer be valid if the price breaks the cloud’s downside border and fixes below 0.7675. In this case, the pair may continue falling towards 0.7585.

AUDUSD
Risk Warning: the result of previous trading operations do not guarantee the same results in the future

NZDJPY, “New Zealand Dollar vs Japanese Yen”

NZDJPY is trading at 79.25; the instrument is moving above Ichimoku Cloud, thus indicating an ascending tendency. The markets could indicate that the price may test the cloud’s upside border at 78.45 and then resume moving upwards to reach 80.55. Another signal in favor of a further uptrend will be a rebound from the support level. However, the bullish scenario may no longer be valid if the price breaks the cloud’s downside border and fixes below 77.95. In this case, the pair may continue falling towards 76.85.

NZDJPY
Risk Warning: the result of previous trading operations do not guarantee the same results in the future

USDCAD, “US Dollar vs Canadian Dollar”

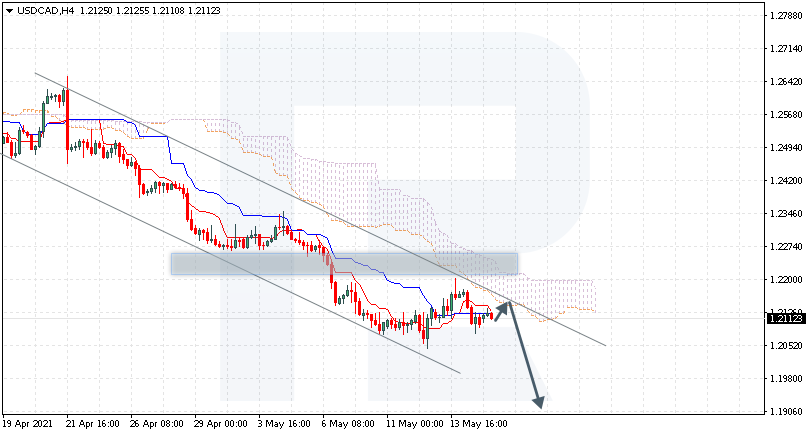
USDCAD is trading at 1.2115; the instrument is moving below Ichimoku Cloud, thus indicating a descending tendency. The markets could indicate that the price may test Tenkan-Sen and Kijun-Sen at 1.2215 and then resume moving downwards to reach 1.1865. Another signal in favor of a further downtrend will be a rebound from the descending channel’s upside border. However, the bearish scenario may no longer be valid if the price breaks the cloud’s upside border and fixes above 1.2315. In this case, the pair may continue growing towards 1.2405.

USDCAD

Article By RoboForex.com

Attention!
Forecasts presented in this section only reflect the author’s private opinion and should not be considered as guidance for trading. RoboForex LP bears no responsibility for trading results based on trading recommendations described in these analytical reviews.

Fibonacci Retracements Analysis 10.05.2021 (GOLD, USDCHF)

Article By RoboForex.com

XAUUSD, “Gold vs US Dollar”

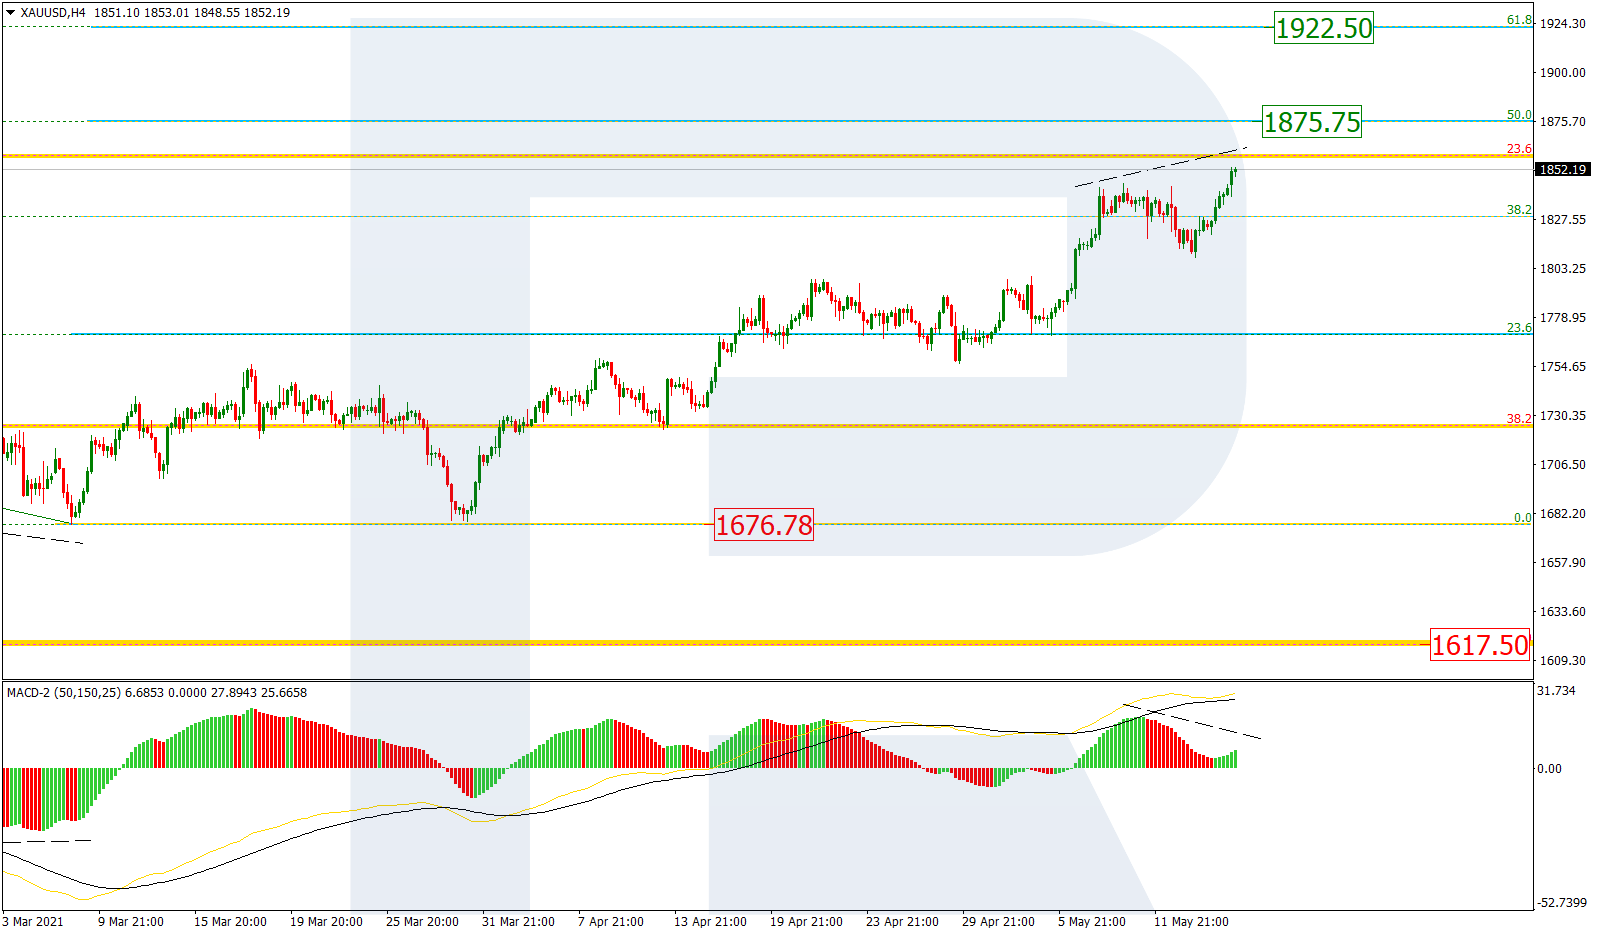
As we can see in the H4 chart, the uptrend continues. After breaking 50.0% fibo, XAUUSD is approaching 61.8% fibo at 1851.32 and may later break this level as well. In this case, the next upside target will be 76.0% fibo at 1891.40. However, despite the fact that the current uptrend is quite stable, there is a divergence on MACD, which may hint at a possible reversal. The key support is the low at 1676.78.

GOLD_H4
Risk Warning: the result of previous trading operations do not guarantee the same results in the future

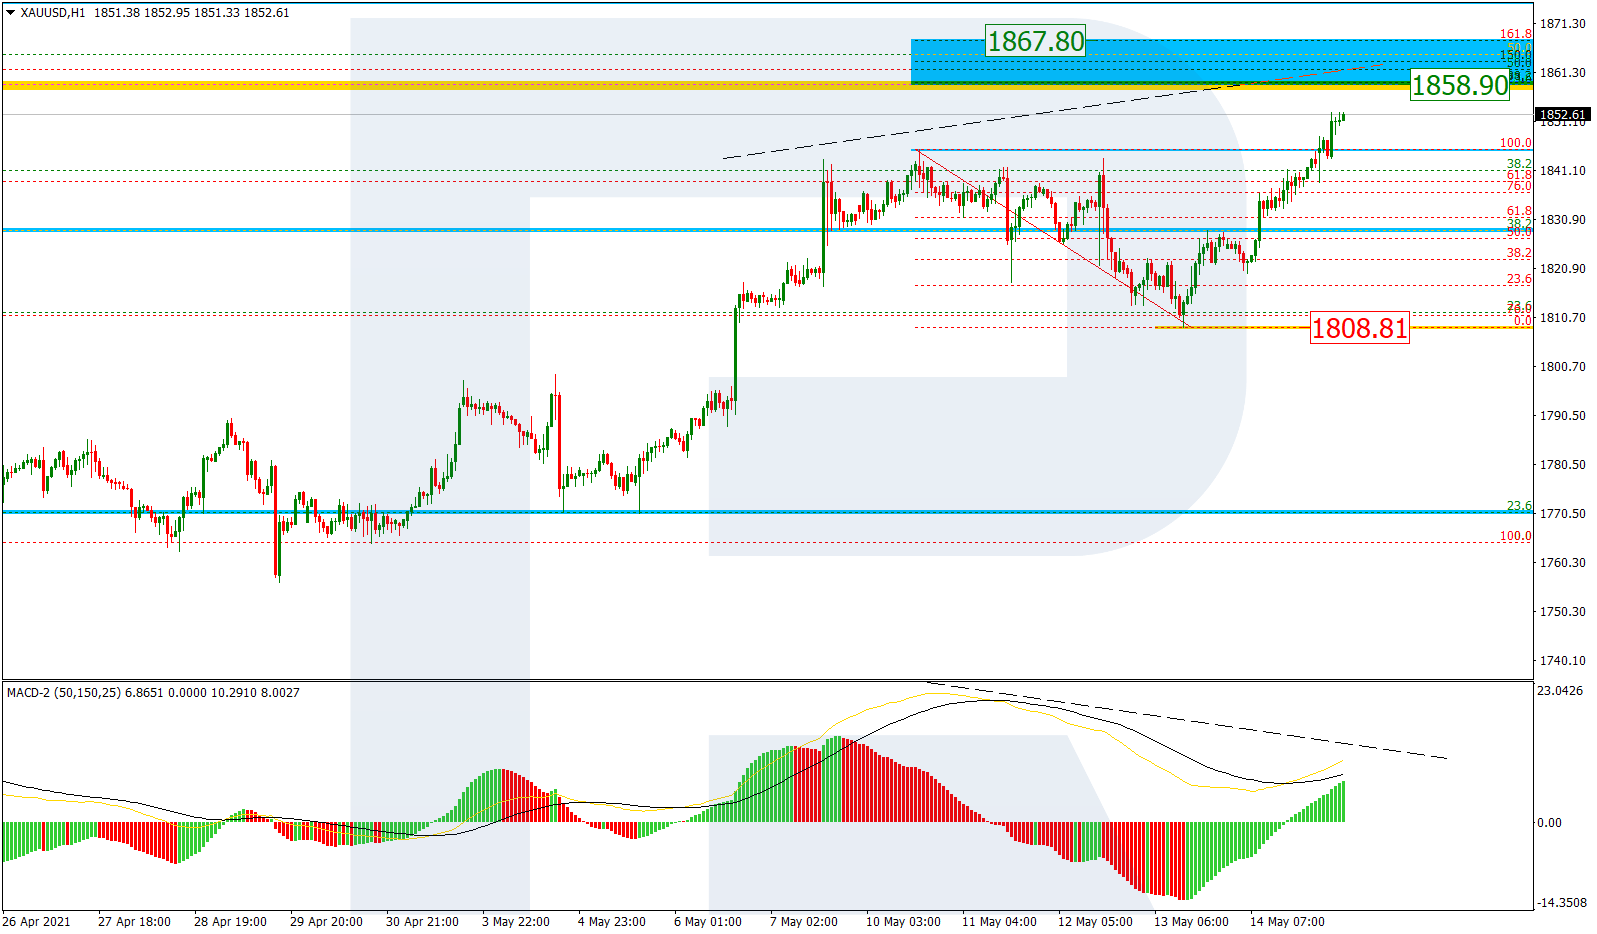
In the H1 chart, after completing the ascending impulse, the pair is forming a short-term consolidation range and may later resume growing to reach 61.8% fibo at 1851.32. However, if this range transforms into a correction, the target will be at 1818.00.

GOLD_H1
Risk Warning: the result of previous trading operations do not guarantee the same results in the future

USDCHF, “US Dollar vs Swiss Franc”

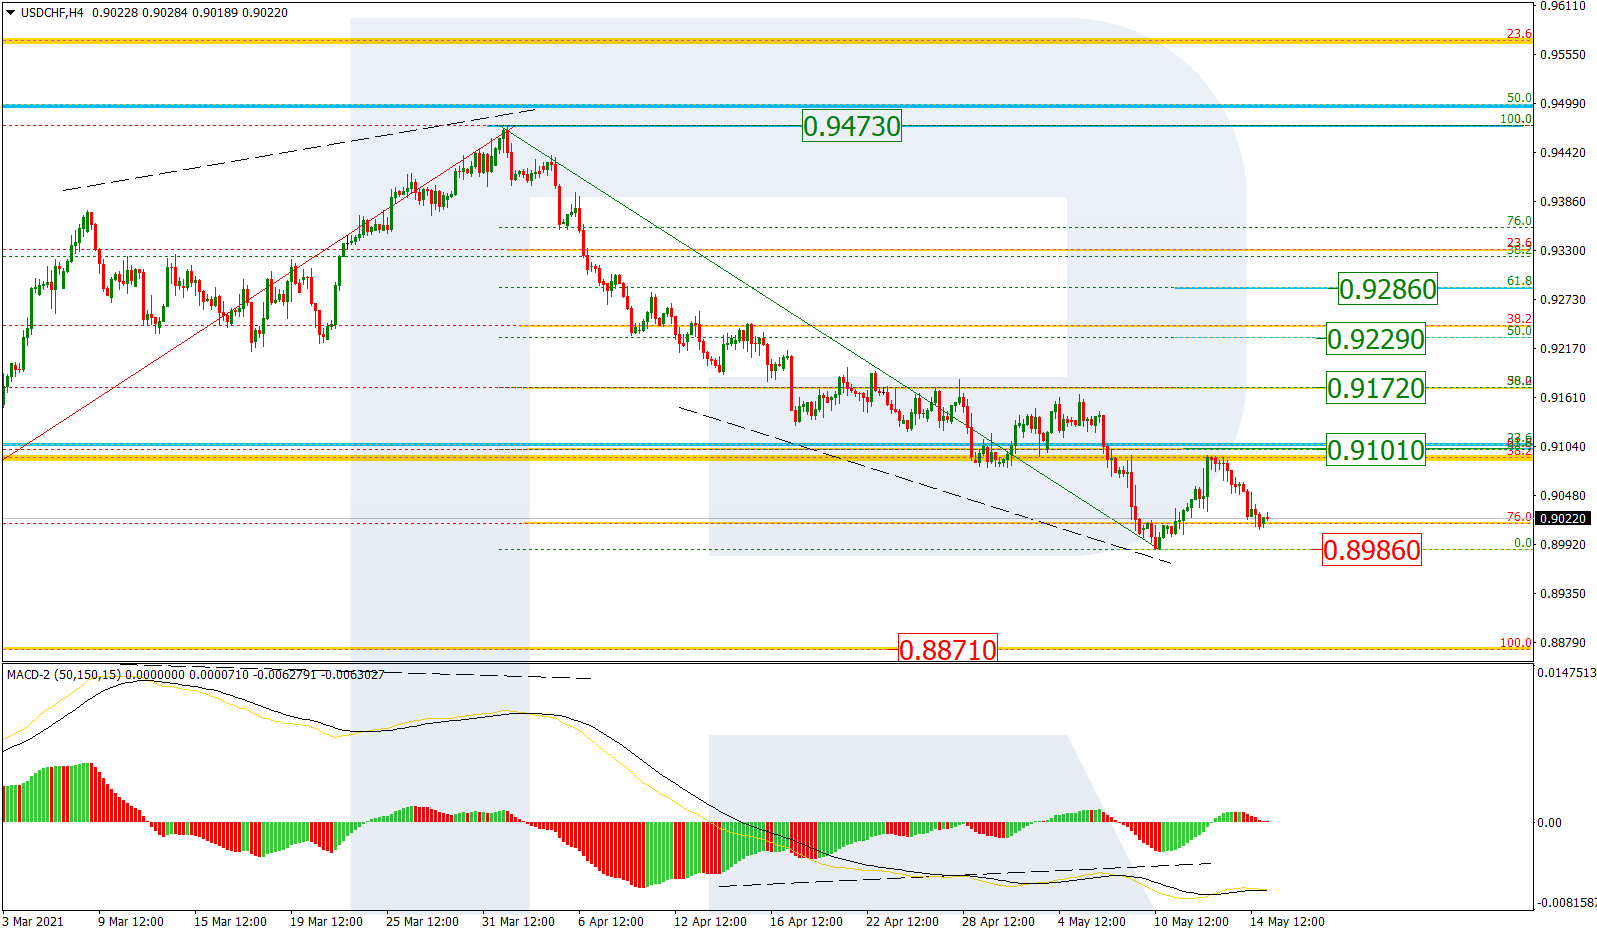
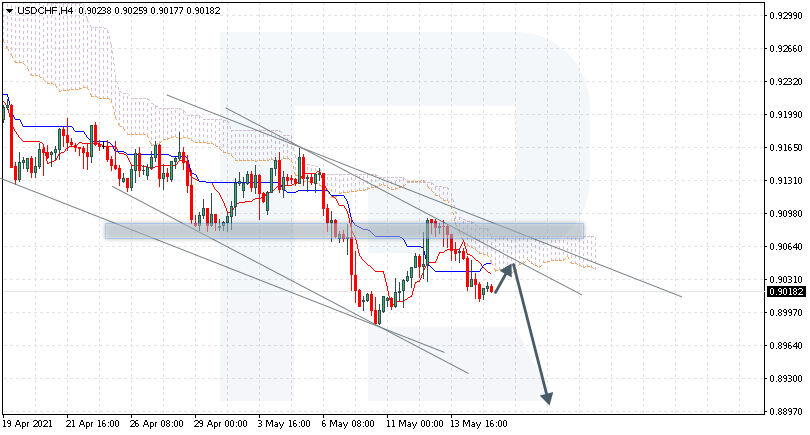
In the H4 chart, after finishing the short-term pullback, the asset is forming a new descending impulse, which has already reached 76.0% fibo. At the same time, there is a convergence on MACD, which may hint at a correctional uptrend soon. Still, the key downside target remains the fractal low at 0.8871.

USDCHF_H4
Risk Warning: the result of previous trading operations do not guarantee the same results in the future

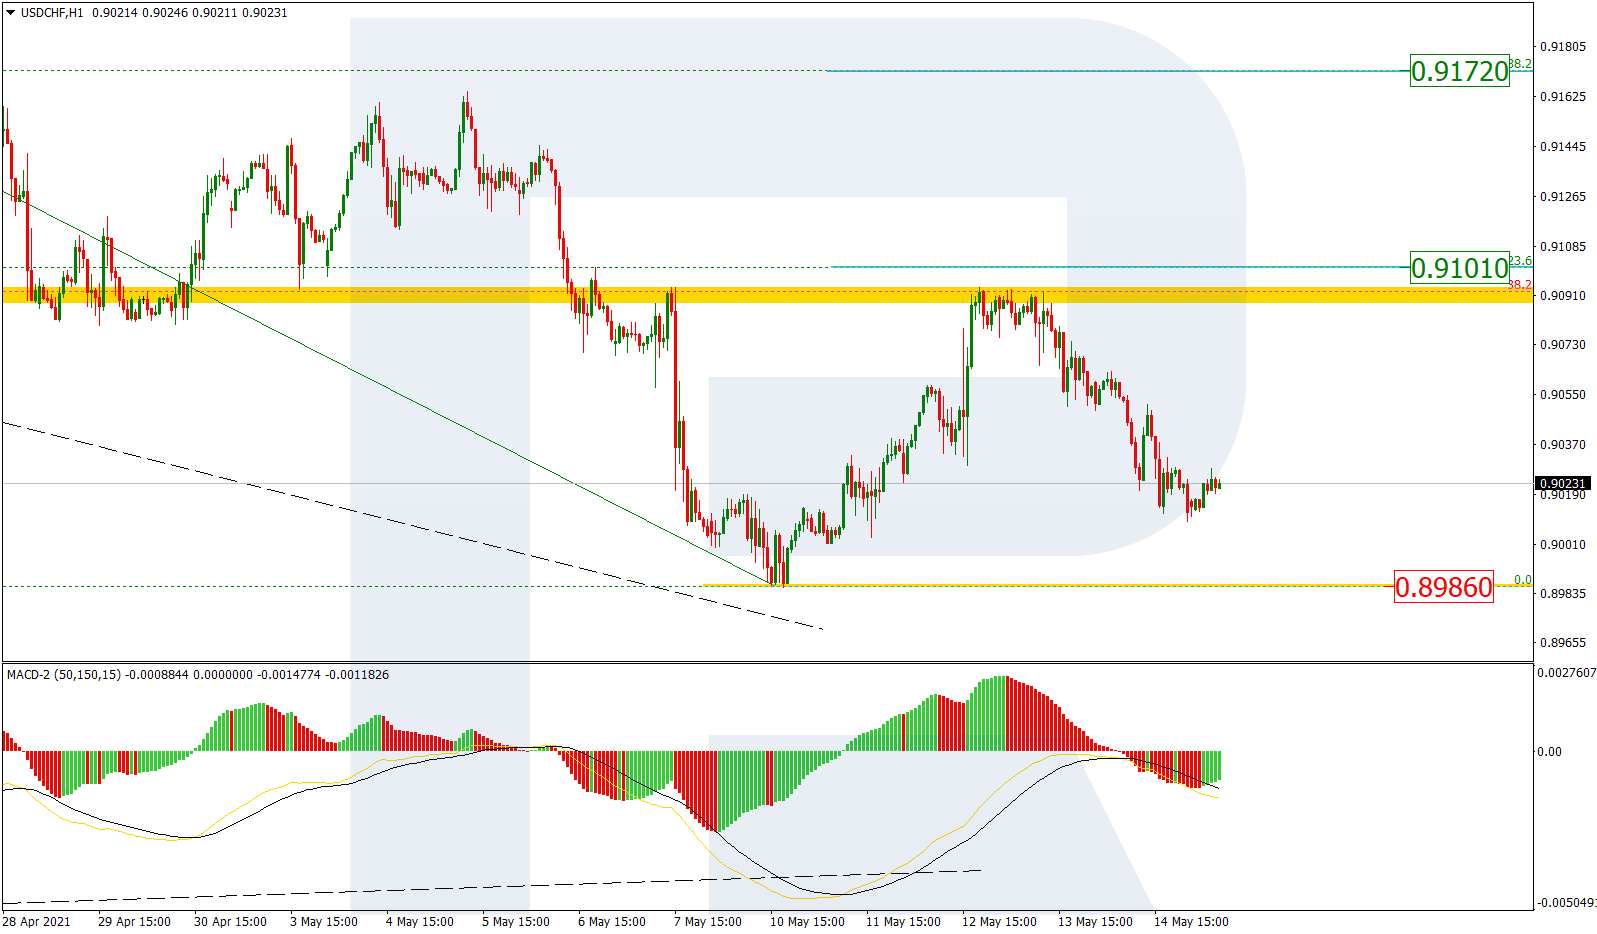
The H1 chart shows potential correctional targets after a convergence on MACD – 23.6%, 38.2%, and 50.0% fibo at 0.9112, 0.9181, and 0.9236 respectively. The local support is the low at 0.9000, a breakout of which may lead to a further downtrend.

USDCHF_H1

Article By RoboForex.com

Attention!
Forecasts presented in this section only reflect the author’s private opinion and should not be considered as guidance for trading. RoboForex LP bears no responsibility for trading results based on trading recommendations described in these analytical reviews.

The Analytical Overview of the Main Currency Pairs on 2021.05.10

by JustForex

The EUR/USD currency pair

Technical indicators of the currency pair:
  • Prev Open: 1.2058
  • Prev Close: 1.2161
  • % chg. over the last day: +0.85%

On Friday, the EUR/USD currency pair rose by 0.85%. The main bullish impulsive move was after the US unemployment report, which turned out unpleasant for the American currency.

Trading recommendations
  • Support levels: 1.2150, 1.2108, 1.2074, 1.2027, 1.2002, 1.1957, 1.1835
  • Resistance levels: 1.2176, 1.2212, 1.2243

The price confidently broke through the 1.2108 level and held above. The mid-term trend is bullish again. Traders should look only for buy positions, but it is not the most optimal entry point now. The price has strongly deviated from the moving average, which will pull it back.

Alternative scenario: if the price breaks down through the 1.2108 support level and holds below, the general uptrend is likely to be broken.

EUR/USD
There is no news feed for today.

The GBP/USD currency pair

Technical indicators of the currency pair:
  • Prev Open: 1.3885
  • Prev Close: 1.3987
  • % chg. over the last day: +0.73%

Considering the decline in the dollar index, the GBP/USD price also rose on Friday. A confident mid-term uptrend has formed now without any signs of a reversal.

Trading recommendations
  • Support levels: 1.3996, 1.3913,1.3835, 1.3801, 1.3756, 1.3690
  • Resistance levels: 1.4126, 1.4207

The best strategy on the GBP/USD currency pair would be to look for buy positions from the support levels. But taking into account the strong bullish momentum, the price will not pull back deeply, so traders should consider long deals on intraday timeframes as well.

Alternative scenario: if the price breaks down through the 1.3913 support level and holds below, the bullish scenario is likely to be canceled.

GBP/USD
There is no news feed for today.

The USD/JPY currency pair

Technical indicators of the currency pair:
  • Prev Open: 109.06
  • Prev Close: 108.60
  • % chg. over the last day: -0.42%

The USD/JPY currency pair impulsively fell on Friday after the release of the “non-farm” report. However, the buyers managed to hold the support level of 108.44 and the price slightly recovered its positions by the end of the trading session.

Trading recommendations
  • Support levels: 108.44, 108.19,107.77, 107.47, 107.04
  • Resistance levels: 108.87, 109.01, 109.40, 109.64, 109.95, 110.51

The price is trading below the moving average, the MACD is still in the negative area, but showing signs of recovery. Under such market conditions, it is possible to work in both directions, “long” from the support or “short” from the resistance levels. But if the dollar index continues to fall, the USDJPY will form a mid-term downtrend.

Alternative scenario: if the price drops below 108.44, the general downtrend is likely to resume.

USD/JPY
There is no news feed for today.

The USD/CAD currency pair

Technical indicators of the currency pair:
  • Prev Open: 1.2147
  • Prev Close: 1.2121
  • % chg. over the last day: -0.21%

At the end of the trading session on Friday, the USD/CAD currency pair broke through another support level and held under it. Only the 1.2075 support level, which is the minimum of 2017, remained below.

Trading recommendations
  • Support levels: 1.2075
  • Resistance levels: 1.2137, 1.2251, 1.2321, 1.2388, 1.2414, 1.2519, 1.2618

The trend remains bearish for USD/CAD. But the MACD indicator is already signaling about 2 divergences (mid-term and local). Considering that the Canadian dollar was the weakest of all the major currencies on Friday, it shows that sellers become less active and traders should close their short positions. But it’s too early to look for long deals because there is no initiative from the buyers yet.

Alternative scenario: if the price breaks through the 1.2321 resistance level and holds above, a local corrective uptrend is likely to form.

USD/CAD
There is no news feed for today.

by JustForex


This article reflects a personal opinion and should not be interpreted as an investment advice, and/or offer, and/or a persistent request for carrying out financial transactions, and/or a guarantee, and/or a forecast of future events.

Today, the market is not expected to be very active, so traders are better off focusing on intraday trading

by JustForex

Last week, investors were watching the changes in the U.S. Non-Farm payrolls. The report was much worse than expected, with the unemployment rate rising. But that did not stop the S&P 500 and Dow Jones indices from making new all-time highs on Friday. This is because investors are confident in the recovery of the economy as inflation expectations are not yet rising and the Fed’s easing policy will remain the same.

European indices also followed the uptrend, with the banking and auto sectors being the main drivers. French bank Societe Generale and Italian bank Unicredit published very good reports, while Volkswagen and BMW did very well in the auto sector.

Oil prices continue to rise despite the hacker attack and paralysis of Colonial Pipeline, which supplies about 45% of gasoline and diesel fuel in the United States east coast. WTI crude oil was up +2.1% last week and Brent was up +2.3%.

Gold and silver gained strength due to the weak U.S. labor market data. Gold climbed to February’s highs on Friday and the trend is likely to continue in the near future.

Main market quotes:

S&P 500 (F) 4,232.60 +30.98 (+0.74%)

Dow Jones 34,777.76 +229.23 (+0.66%)

DAX 15,399.65 +202.91 (+1.34%)

FTSE 100 7,129.71 +53.54 (+0.76%)

USD Index 90.11 -0.84 (-0.93%)

Important events:
  • – Australia Retail Sales (m/m) at 04:30 (GMT+3);
  • – China Foreign Direct Investment Report (y/y) at 10:00 (GMT+3).

by JustForex


This article reflects a personal opinion and should not be interpreted as an investment advice, and/or offer, and/or a persistent request for carrying out financial transactions, and/or a guarantee, and/or a forecast of future events.

Risk assets resume their rise as dollar suffers following payrolls miss

By Hussein Sayed Chief Market Strategist (Gulf & MENA), ForexTime

Last Friday, investors across the world were cautiously monitoring the US nonfarm payrolls report, as many market participants were anticipating a seven-digit job gain.  Unfortunately, they got a negative shock as US employers hired a quarter of the expected figure, with the headline of only 266,000 in April.

Over the past several weeks, a lot of economic data has surprised to the upside, including figures on consumer spending, business and consumer confidence, the housing market and manufacturing and services activity. That had led some economists to anticipate far more than a one million jobs to have been added. Indeed, if we exclude March 2020, this was the worst negative surprise in 24 years since the survey started.

While the trajectory continues to show improvement in the labour market, the US may not return to full employment by next year if the jobs recovery starts to show fragility. For investors, this is not necessarily bad news. In fact, it should be seen as positive for risk assets and negative for the US currency.

The US 10-year breakeven rate serves as an indication of the markets’ inflation expectations over the 10- year horizon and this reached a new eight year high of 2.49%. The latest spike in inflation expectations is now driven by two factors, the big surge in commodity prices and expectations of extended easy monetary policy. The Fed is now set to delay tapering of its asset purchases until the end of the year instead of the third quarter and that is why the S&P 500 and Dow Jones Industrial Average closed at new record highs despite the gloomy jobs report.  The next big data point will be released on Wednesday with US inflation expected to have soared 3.6% compared to a year ago. However, this is due to base effects which means investors should monitor monthly changes instead to see if there are any signs of prices moving sharply higher.

When looking at base metals, prices are running hot with iron ore and copper continuing to record new highs. This should further benefit stocks in the mining industry, but also raises some doubts over the Federal Reserve statements which say inflation will be “transitory”.

Asian stocks rose today on expectations of lower rates for longer with European and US indices are also set for a positive start to the week.  Meanwhile, the dollar continues to feel the pain from Friday’s disappointing jobs report with the dollar index (DXY) only 0.3% higher from where it started the year, having retreated 3.45% from the March peak.

Given the current environment, expect the selling of the DXY to resume with the first big test around 89.20. A break below this level will send the greenback to a three-year low. Unless we see a sharp correction in equities or a new surge in US bond yields, expect the dollar to remain under considerable pressure.

Disclaimer: The content in this article comprises personal opinions and should not be construed as containing personal and/or other investment advice and/or an offer of and/or solicitation for any transactions in financial instruments and/or a guarantee and/or prediction of future performance. ForexTime (FXTM), its affiliates, agents, directors, officers or employees do not guarantee the accuracy, validity, timeliness or completeness, of any information or data made available and assume no liability as to any loss arising from any investment based on the same.


Forex-Time-LogoArticle by ForexTime

ForexTime Ltd (FXTM) is an award winning international online forex broker regulated by CySEC 185/12 www.forextime.com

COT Currency Futures Charts: US Dollar Index, Euro, Yen, Swiss Franc, Mexican Peso, New Zealand Dollar

By CountingPips.com COT Home | Data Tables | Data Downloads | Newsletter

Here are the latest charts and statistics for the Commitment of Traders (COT) data published by the Commodities Futures Trading Commission (CFTC).

The latest COT data is updated through Tuesday May 04 2021 and shows a quick view of how large traders (for-profit speculators and commercial entities) were positioned in the futures markets. All currency positions are in direct relation to the US dollar where, for example, a bet for the euro is a bet that the euro will rise versus the dollar while a bet against the euro will be a bet that the euro will decline versus the dollar.


US Dollar Index Futures:


The US Dollar Index large speculator standing this week was a net position of 2,055 contracts in the data reported through Tuesday. This was a weekly decrease of -691 contracts from the previous week which had a total of 2,746 net contracts.

This week’s current strength score (the trader positioning range over the past three years, measured from 0 to 100) shows the speculators are currently Bearish with a score of 29.3 percent. The commercials are Bullish with a score of 65.7 percent and the small traders (not shown in chart) are Bullish with a score of 61.9 percent.

US DOLLAR INDEX StatisticsSPECULATORSCOMMERCIALSSMALL TRADERS
– Percent of Open Interest Longs:64.49.417.4
– Percent of Open Interest Shorts:58.425.07.8
– Net Position:2,055-5,3413,286
– Gross Longs:22,0163,2035,963
– Gross Shorts:19,9618,5442,677
– Long to Short Ratio:1.1 to 10.4 to 12.2 to 1
NET POSITION TREND:
– COT Index Score (3 Year Range Pct):29.365.761.9
– COT Index Reading (3 Year Range):BearishBullishBullish
NET POSITION MOVEMENT INDEX:
– 6-Week Change in Strength Index:-5.75.41.3


Euro Currency Futures:

euro forex zachary storella
The Euro Currency large speculator standing this week was a net position of 84,829 contracts in the data reported through Tuesday. This was a weekly boost of 3,862 contracts from the previous week which had a total of 80,967 net contracts.

This week’s current strength score (the trader positioning range over the past three years, measured from 0 to 100) shows the speculators are currently Bullish with a score of 61.0 percent. The commercials are Bearish with a score of 35.6 percent and the small traders (not shown in chart) are Bullish-Extreme with a score of 91.1 percent.

EURO Currency StatisticsSPECULATORSCOMMERCIALSSMALL TRADERS
– Percent of Open Interest Longs:30.553.914.3
– Percent of Open Interest Shorts:18.074.95.8
– Net Position:84,829-142,15857,329
– Gross Longs:206,472364,94796,919
– Gross Shorts:121,643507,10539,590
– Long to Short Ratio:1.7 to 10.7 to 12.4 to 1
NET POSITION TREND:
– COT Index Score (3 Year Range Pct):61.035.691.1
– COT Index Reading (3 Year Range):BullishBearishBullish-Extreme
NET POSITION MOVEMENT INDEX:
– 6-Week Change in Strength Index:-2.6-1.222.1


British Pound Sterling Futures:

sterling futures zac storella python
The British Pound Sterling large speculator standing this week was a net position of 19,848 contracts in the data reported through Tuesday. This was a weekly lowering of -9,370 contracts from the previous week which had a total of 29,218 net contracts.

This week’s current strength score (the trader positioning range over the past three years, measured from 0 to 100) shows the speculators are currently Bullish-Extreme with a score of 88.3 percent. The commercials are Bearish-Extreme with a score of 6.1 percent and the small traders (not shown in chart) are Bullish-Extreme with a score of 96.0 percent.

BRITISH POUND StatisticsSPECULATORSCOMMERCIALSSMALL TRADERS
– Percent of Open Interest Longs:34.238.726.2
– Percent of Open Interest Shorts:21.263.514.3
– Net Position:19,848-37,99318,145
– Gross Longs:52,26259,05540,052
– Gross Shorts:32,41497,04821,907
– Long to Short Ratio:1.6 to 10.6 to 11.8 to 1
NET POSITION TREND:
– COT Index Score (3 Year Range Pct):88.36.196.0
– COT Index Reading (3 Year Range):Bullish-ExtremeBearish-ExtremeBullish-Extreme
NET POSITION MOVEMENT INDEX:
– 6-Week Change in Strength Index:-1.4-3.215.5


Japanese Yen Futures:

japanese yen futures zach storella
The Japanese Yen large speculator standing this week was a net position of -41,492 contracts in the data reported through Tuesday. This was a weekly rise of 7,017 contracts from the previous week which had a total of -48,509 net contracts.

This week’s current strength score (the trader positioning range over the past three years, measured from 0 to 100) shows the speculators are currently Bearish with a score of 44.5 percent. The commercials are Bullish with a score of 60.3 percent and the small traders (not shown in chart) are Bearish with a score of 31.7 percent.

JAPANESE YEN StatisticsSPECULATORSCOMMERCIALSSMALL TRADERS
– Percent of Open Interest Longs:20.464.913.3
– Percent of Open Interest Shorts:47.629.321.7
– Net Position:-41,49254,331-12,839
– Gross Longs:31,20899,09220,288
– Gross Shorts:72,70044,76133,127
– Long to Short Ratio:0.4 to 12.2 to 10.6 to 1
NET POSITION TREND:
– COT Index Score (3 Year Range Pct):44.560.331.7
– COT Index Reading (3 Year Range):BearishBullishBearish
NET POSITION MOVEMENT INDEX:
– 6-Week Change in Strength Index:7.3-8.812.5


Swiss Franc Futures:

swiss franc currency futures cot
The Swiss Franc large speculator standing this week was a net position of 56 contracts in the data reported through Tuesday. This was a weekly increase of 742 contracts from the previous week which had a total of -686 net contracts.

This week’s current strength score (the trader positioning range over the past three years, measured from 0 to 100) shows the speculators are currently Bullish with a score of 73.4 percent. The commercials are Bearish with a score of 37.1 percent and the small traders (not shown in chart) are Bearish with a score of 44.6 percent.

SWISS FRANC StatisticsSPECULATORSCOMMERCIALSSMALL TRADERS
– Percent of Open Interest Longs:26.046.227.2
– Percent of Open Interest Shorts:25.926.746.9
– Net Position:567,707-7,763
– Gross Longs:10,27618,26010,768
– Gross Shorts:10,22010,55318,531
– Long to Short Ratio:1.0 to 11.7 to 10.6 to 1
NET POSITION TREND:
– COT Index Score (3 Year Range Pct):73.437.144.6
– COT Index Reading (3 Year Range):BullishBearishBearish
NET POSITION MOVEMENT INDEX:
– 6-Week Change in Strength Index:-4.4-1.411.3


Canadian Dollar Futures:


The Canadian Dollar large speculator standing this week was a net position of 25,947 contracts in the data reported through Tuesday. This was a weekly boost of 10,225 contracts from the previous week which had a total of 15,722 net contracts.

This week’s current strength score (the trader positioning range over the past three years, measured from 0 to 100) shows the speculators are currently Bullish with a score of 76.6 percent. The commercials are Bearish-Extreme with a score of 8.2 percent and the small traders (not shown in chart) are Bullish-Extreme with a score of 99.2 percent.

CANADIAN DOLLAR StatisticsSPECULATORSCOMMERCIALSSMALL TRADERS
– Percent of Open Interest Longs:37.735.226.6
– Percent of Open Interest Shorts:24.666.08.9
– Net Position:25,947-60,70534,758
– Gross Longs:74,28069,27952,291
– Gross Shorts:48,333129,98417,533
– Long to Short Ratio:1.5 to 10.5 to 13.0 to 1
NET POSITION TREND:
– COT Index Score (3 Year Range Pct):76.68.299.2
– COT Index Reading (3 Year Range):BullishBearish-ExtremeBullish-Extreme
NET POSITION MOVEMENT INDEX:
– 6-Week Change in Strength Index:17.4-19.412.4


Australian Dollar Futures:


The Australian Dollar large speculator standing this week was a net position of 1,476 contracts in the data reported through Tuesday. This was a weekly increase of 2,886 contracts from the previous week which had a total of -1,410 net contracts.

This week’s current strength score (the trader positioning range over the past three years, measured from 0 to 100) shows the speculators are currently Bullish-Extreme with a score of 83.4 percent. The commercials are Bearish-Extreme with a score of 8.5 percent and the small traders (not shown in chart) are Bullish-Extreme with a score of 87.2 percent.

AUSTRALIAN DOLLAR StatisticsSPECULATORSCOMMERCIALSSMALL TRADERS
– Percent of Open Interest Longs:42.434.122.5
– Percent of Open Interest Shorts:41.345.112.6
– Net Position:1,476-15,17913,703
– Gross Longs:58,38546,96931,003
– Gross Shorts:56,90962,14817,300
– Long to Short Ratio:1.0 to 10.8 to 11.8 to 1
NET POSITION TREND:
– COT Index Score (3 Year Range Pct):83.48.587.2
– COT Index Reading (3 Year Range):Bullish-ExtremeBearish-ExtremeBullish-Extreme
NET POSITION MOVEMENT INDEX:
– 6-Week Change in Strength Index:-5.03.40.9


New Zealand Dollar Futures:


The New Zealand Dollar large speculator standing this week was a net position of 8,588 contracts in the data reported through Tuesday. This was a weekly gain of 1,609 contracts from the previous week which had a total of 6,979 net contracts.

This week’s current strength score (the trader positioning range over the past three years, measured from 0 to 100) shows the speculators are currently Bullish-Extreme with a score of 85.7 percent. The commercials are Bearish-Extreme with a score of 14.1 percent and the small traders (not shown in chart) are Bullish with a score of 75.3 percent.

NEW ZEALAND DOLLAR StatisticsSPECULATORSCOMMERCIALSSMALL TRADERS
– Percent of Open Interest Longs:59.327.811.1
– Percent of Open Interest Shorts:40.051.66.7
– Net Position:8,588-10,5651,977
– Gross Longs:26,37112,3634,952
– Gross Shorts:17,78322,9282,975
– Long to Short Ratio:1.5 to 10.5 to 11.7 to 1
NET POSITION TREND:
– COT Index Score (3 Year Range Pct):85.714.175.3
– COT Index Reading (3 Year Range):Bullish-ExtremeBearish-ExtremeBullish
NET POSITION MOVEMENT INDEX:
– 6-Week Change in Strength Index:6.5-5.0-6.5


Mexican Peso Futures:


The Mexican Peso large speculator standing this week was a net position of -4,446 contracts in the data reported through Tuesday. This was a weekly fall of -5,406 contracts from the previous week which had a total of 960 net contracts.

This week’s current strength score (the trader positioning range over the past three years, measured from 0 to 100) shows the speculators are currently Bearish-Extreme with a score of 12.5 percent. The commercials are Bullish-Extreme with a score of 86.2 percent and the small traders (not shown in chart) are Bullish with a score of 61.7 percent.

MEXICAN PESO StatisticsSPECULATORSCOMMERCIALSSMALL TRADERS
– Percent of Open Interest Longs:45.248.85.0
– Percent of Open Interest Shorts:48.248.82.0
– Net Position:-4,446314,415
– Gross Longs:65,94871,2277,271
– Gross Shorts:70,39471,1962,856
– Long to Short Ratio:0.9 to 11.0 to 12.5 to 1
NET POSITION TREND:
– COT Index Score (3 Year Range Pct):12.586.261.7
– COT Index Reading (3 Year Range):Bearish-ExtremeBullish-ExtremeBullish
NET POSITION MOVEMENT INDEX:
– 6-Week Change in Strength Index:8.2-9.18.1


Brazilian Real Futures:

real futures cot zachary storella
The Brazilian Real large speculator standing this week was a net position of -9,898 contracts in the data reported through Tuesday. This was a weekly increase of 16,388 contracts from the previous week which had a total of -26,286 net contracts.

This week’s current strength score (the trader positioning range over the past three years, measured from 0 to 100) shows the speculators are currently Bullish with a score of 68.3 percent. The commercials are Bearish with a score of 31.9 percent and the small traders (not shown in chart) are Bullish-Extreme with a score of 86.9 percent.

BRAZIL REAL StatisticsSPECULATORSCOMMERCIALSSMALL TRADERS
– Percent of Open Interest Longs:38.551.49.4
– Percent of Open Interest Shorts:66.526.85.9
– Net Position:-9,8988,6801,218
– Gross Longs:13,62318,1593,316
– Gross Shorts:23,5219,4792,098
– Long to Short Ratio:0.6 to 11.9 to 11.6 to 1
NET POSITION TREND:
– COT Index Score (3 Year Range Pct):68.331.986.9
– COT Index Reading (3 Year Range):BullishBearishBullish-Extreme
NET POSITION MOVEMENT INDEX:
– 6-Week Change in Strength Index:25.4-27.012.7


Russian Ruble Futures:


The Russian Ruble large speculator standing this week was a net position of 5,509 contracts in the data reported through Tuesday. This was a weekly reduction of -869 contracts from the previous week which had a total of 6,378 net contracts.

This week’s current strength score (the trader positioning range over the past three years, measured from 0 to 100) shows the speculators are currently Bearish with a score of 26.4 percent. The commercials are Bullish with a score of 71.0 percent and the small traders (not shown in chart) are Bullish with a score of 70.2 percent.

RUSSIAN RUBLE StatisticsSPECULATORSCOMMERCIALSSMALL TRADERS
– Percent of Open Interest Longs:32.160.37.6
– Percent of Open Interest Shorts:13.981.34.8
– Net Position:5,509-6,334825
– Gross Longs:9,70218,2392,285
– Gross Shorts:4,19324,5731,460
– Long to Short Ratio:2.3 to 10.7 to 11.6 to 1
NET POSITION TREND:
– COT Index Score (3 Year Range Pct):26.471.070.2
– COT Index Reading (3 Year Range):BearishBullishBullish
NET POSITION MOVEMENT INDEX:
– 6-Week Change in Strength Index:-0.30.6-5.5


Bitcoin Futures:


The Bitcoin large speculator standing this week was a net position of -1,764 contracts in the data reported through Tuesday. This was a weekly boost of 145 contracts from the previous week which had a total of -1,909 net contracts.

This week’s current strength score (the trader positioning range over the past three years, measured from 0 to 100) shows the speculators are currently Bullish with a score of 54.3 percent. The commercials are Bullish-Extreme with a score of 82.9 percent and the small traders (not shown in chart) are Bearish with a score of 36.3 percent.

BITCOIN StatisticsSPECULATORSCOMMERCIALSSMALL TRADERS
– Percent of Open Interest Longs:59.85.727.5
– Percent of Open Interest Shorts:81.01.510.5
– Net Position:-1,7643461,418
– Gross Longs:4,9644702,286
– Gross Shorts:6,728124868
– Long to Short Ratio:0.7 to 13.8 to 12.6 to 1
NET POSITION TREND:
– COT Index Score (3 Year Range Pct):54.382.936.3
– COT Index Reading (3 Year Range):BullishBullish-ExtremeBearish
NET POSITION MOVEMENT INDEX:
– 6-Week Change in Strength Index:18.1-3.3-20.3


Article By CountingPips.comReceive our weekly COT Reports by Email

*COT Report: The COT data, released weekly to the public each Friday, is updated through the most recent Tuesday (data is 3 days old) and shows a quick view of how large speculators or non-commercials (for-profit traders) were positioned in the futures markets.

The CFTC categorizes trader positions according to commercial hedgers (traders who use futures contracts for hedging as part of the business), non-commercials (large traders who speculate to realize trading profits) and nonreportable traders (usually small traders/speculators).

Find CFTC criteria here: (http://www.cftc.gov/MarketReports/CommitmentsofTraders/ExplanatoryNotes/index.htm).

Intraday Market Analysis – US Dollar Fails To Find Support

By Orbex

USDCHF tanks to new lows

USDCHF

The US dollar falls as higher continuing jobless claims point to volatility in the labour market. The bearish MA cross from the daily chart is a reminder of the US dollar’s weakness across the board.

The latest consolidation has ended up with a breakout below 0.9110 in continuation of the downtrend. As the RSI shows an oversold situation, profit-taking could lead to a short rebound towards the resistance at 0.9145.

However, this might turn out to be a dead cat bounce if trend followers seize it as an opportunity to sell into strength. 0.9020 would be the next target in the next round of sell-off.

GBPUSD consolidates recent gains

gbpusd

Sterling found support after the BoE raised its forecast for Britain’s economy and hinted at reducing its stimulus programme.

The bullish MA cross on the daily chart may give buyers an edge as the price action wraps up its sideways action. A confirmation may come in with a breakout above 1.3960.

Strong momentum above the psychological level of 1.4000 could prompt short-term sellers to bail out. This would resume the pair’s upward trajectory.

On the downside, the demand zone between 1.3800 and 1.3840 is of interest for those wishing to bet against a soft greenback.

US 30 extends all-time high

us30

The Dow extended gains to an all-time high as investors rebalance assets away from over-stretched growth stocks.

The index continues to grind higher along the 20-day moving average as a sign of optimism.

Following its breakout above the 33700-34250 range, buyers seem to have regained control of the price action. A runaway rally gained traction after sellers closed their positions when it was still cheap to do so.

An overbought RSI may suggest a temporary pullback. 34200 is the immediate support in case of a pullback. Further down, 33770 would be a critical level to maintain the short-term bullish fever.

By Orbex

Fibonacci Retracements Analysis 07.05.2021 (AUDUSD, USDCAD)

Article By RoboForex.com

AUDUSD, “Australian Dollar vs US Dollar”

As we can see in the H4 chart, a convergence on MACD made AUDUSD grow towards 23.6% fibo; right now, the asset is still testing this level. This consolidation may offer two possible scenarios for the asset to choose from. The first one implies a further uptrend to reach the high at 0.8007. The second scenario suggests that the pair may break the range to the downside and continue the correction towards 50.0% and 61.8% fibo at 0.7500 and 0.7380 respectively.

AUDUSD_H4
Risk Warning: the result of previous trading operations do not guarantee the same results in the future

The H1 chart of UADUSD shows that after completing the correctional downtrend at 50.0% fibo, the pair is forming a new wave to the upside with the closest target at the local high (0.7818). If the price breaks this level, it may continue growing towards 61.8% and 76.0% fibo at 0.7826 and 0.7893 respectively. The local support is the low at 0.7532.

AUDUSD_H1
Risk Warning: the result of previous trading operations do not guarantee the same results in the future

USDCAD, “US Dollar vs Canadian Dollar”

As we can see in the H4 chart, the downtrend continues. After breaking the post-correctional extension area between 138.2% and 161.8% fibo at 1.2255 and 1.2186 respectively, USDCAD continues falling towards the long-term fractal low at 1.2061. At the same time, there is a convergence on MACD, which may hint at a possible pullback after the price reaches its target. The resistance is the fractal high at 1.2654.

USDCAD_H4
Risk Warning: the result of previous trading operations do not guarantee the same results in the future

The H1 chart shows a more detailed structure of the current downtrend. Possibly, after a convergence on MACD and a test of 1.2061, the asset may start a new ascending correction to reach 23.6%, 38.2%, and 50.0% fibo at 1.2201, 1.2288, and 1.2356 respectively.

USDCAD_H1

Article By RoboForex.com

Attention!
Forecasts presented in this section only reflect the author’s private opinion and should not be considered as guidance for trading. RoboForex LP bears no responsibility for trading results based on trading recommendations described in these analytical reviews.