by JustForex
The EUR/USD currency pair
- Prev Open: 1.1618
- Prev Close: 1.1597
- % chg. over the last day: -0.18%
Europe’s gas reserves are at their lowest seasonal level in more than a decade. Global gas and coal shortages are pushing energy prices higher, which in turn is negatively impacting businesses and economies in the region. Against the background of such a deficit, prices are likely to continue growing in winter. Energy independence is now the EU’s main goal.
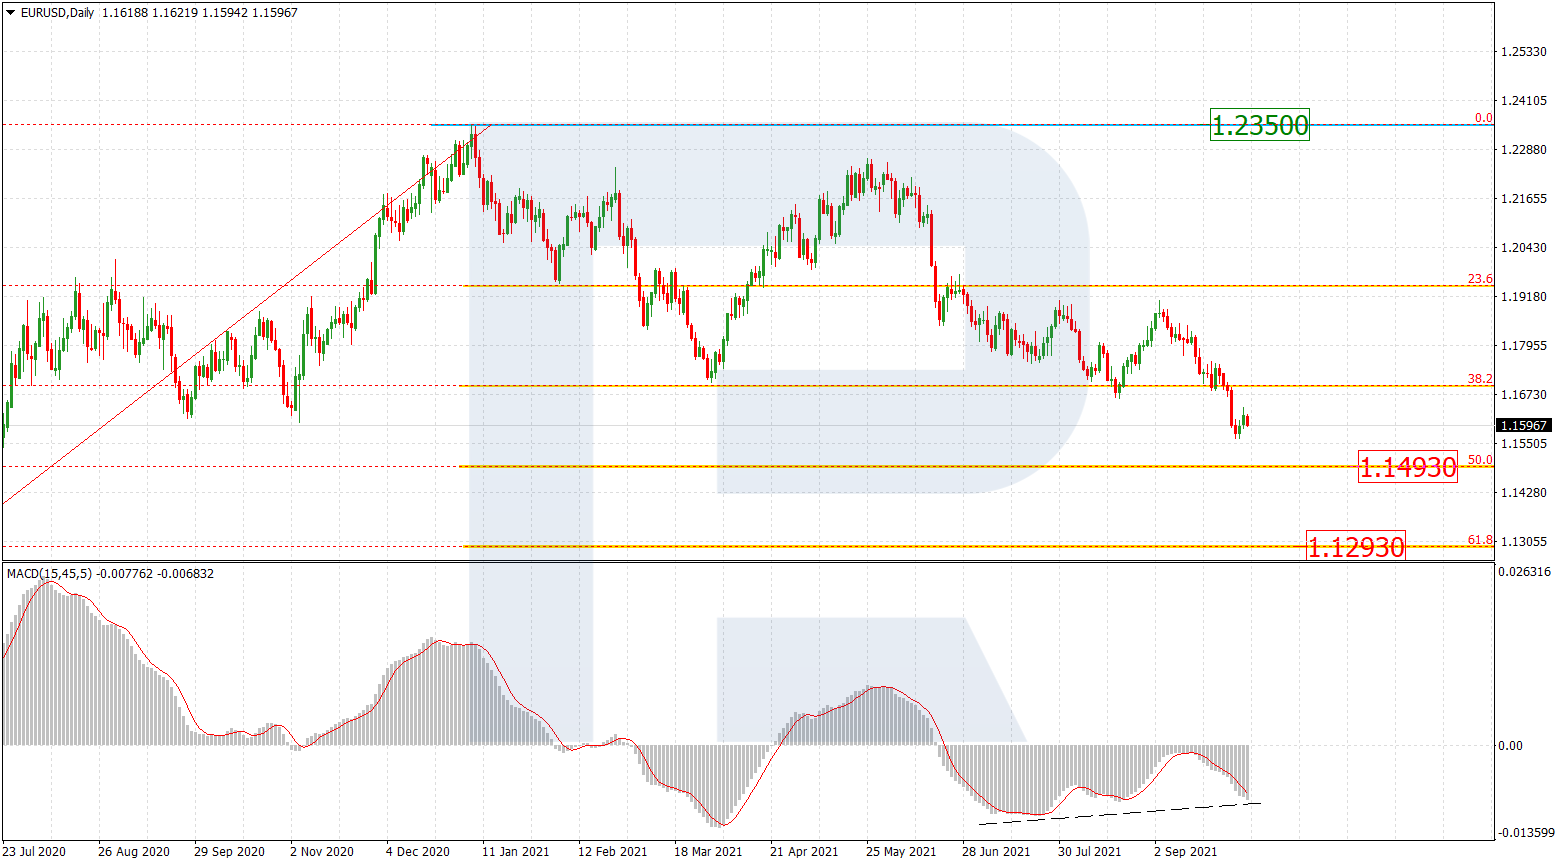
- Support levels: 1.1588, 1.1564, 1.1453
- Resistance levels: 1.1671, 1.1717, 1.1772, 1.1802, 1.1835
From the technical point of view, the EUR/USD trend is bearish. However, the MACD indicator has become inactive. It indicates that the sellers have stopped putting pressure. Under such market conditions, traders should consider sell deals from the resistance levels near the moving average, as the price has deviated from the middle line. Buy trades should be considered only from the support levels with additional confirmation in the form of a buyers’ initiative.
Alternative scenario: if the price breaks out through the 1.1717 resistance level and fixes above, the mid-term uptrend will likely resume.

- – Eurozone Retail Sales (m/m) at 12:00 (GMT+3);
- – US ADP Nonfarm Employment Change (m/m) at 15:15 (GMT+3).
The GBP/USD currency pair
- Prev Open: 1.3605
- Prev Close: 1.3625
- % chg. over the last day: +0.15%
Gas prices in the UK have risen significantly since early July. But the situation with fuel shortages at gas stations is improving. British Prime Minister Boris Johnson said that the government created reliable supply lines for Christmas.
- Support levels: 1.3532, 1.3457, 1.3360, 1.3282
- Resistance levels: 1.3639, 1.3685, 1.3759, 1.3812, 1.3886
On the hourly time frame, the GBP/USD trend is bearish. But the British currency keeps getting stronger due to oil prices growth. The MACD indicator has become positive, but there are already signs of divergence. Buy trades should be considered only throughout the day and only with short targets from the support levels after the buyer’s initiative. Sell trades can be found at the resistance levels near the moving average line.
Alternative scenario: if the price breaks out through the 1.3759 resistance level and consolidates above, the bullish scenario will likely resume.

- – UK Construction PMI (m/m) at 11:30 (GMT+3).
The USD/JPY currency pair
- Prev Open: 110.85
- Prev Close: 111.46
- % chg. over the last day: +0.55%
Japanese shares fell against the background of the market disappointment in the new government and threats for global economic growth. Rising commodity prices are increasing fears about global inflation in the region, which is also negatively affecting the Japanese Yen.
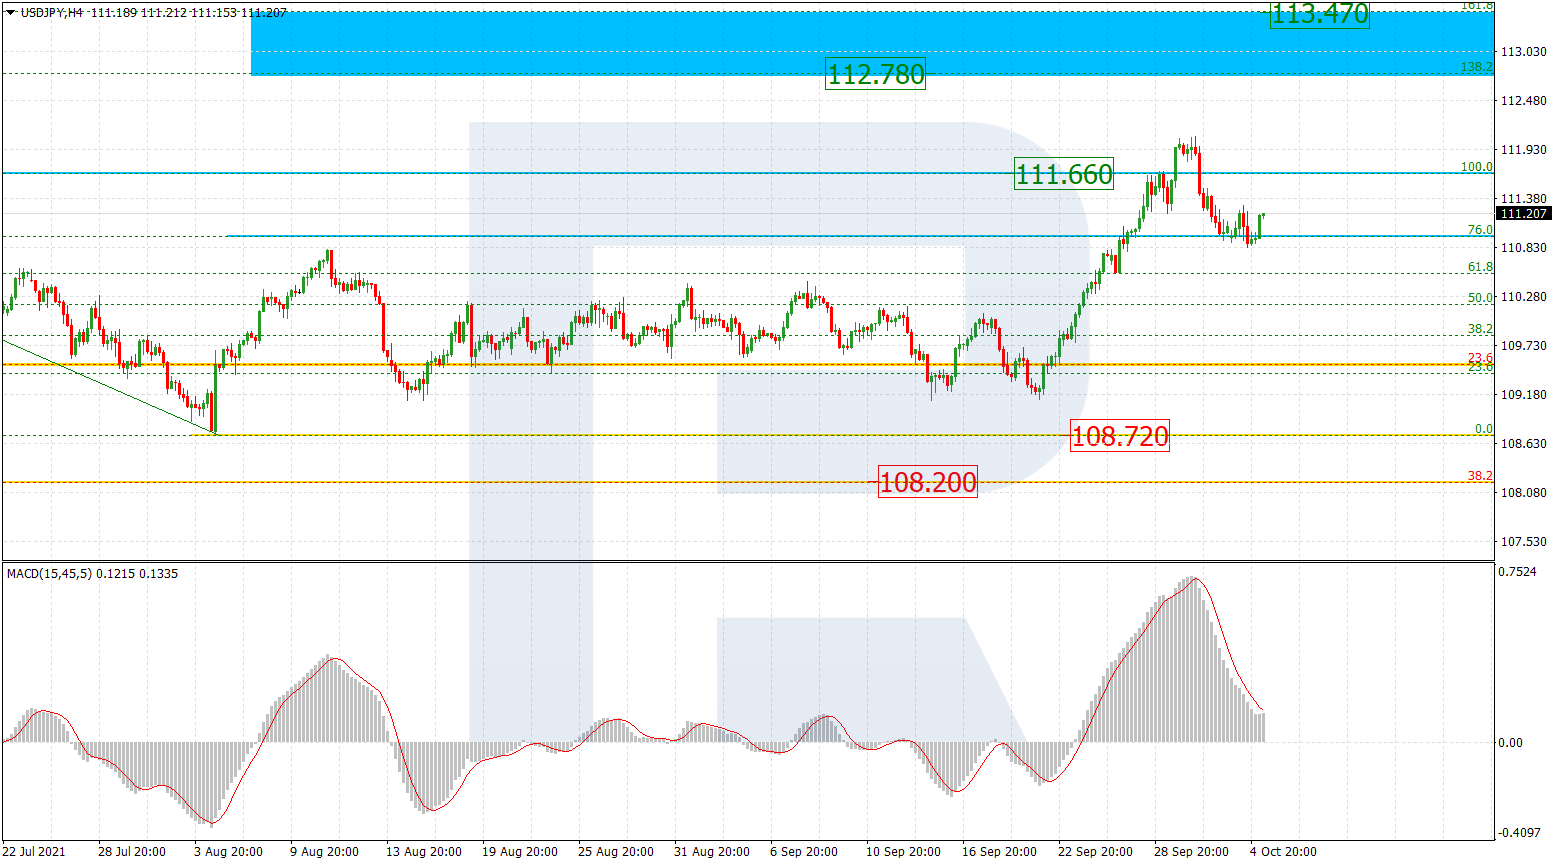
- Support levels: 110.99, 110.65, 110.40, 109.95, 109.63, 109.27
- Resistance levels: 111.67, 112.19
The main trend of the USD/JPY currency pair is bullish. The MACD indicator has become positive, and there are signs of buyer’s initiative. Under such market conditions, it’s better to look for buy positions from the support levels near the moving average. Sell positions should be considered only throughout the day from the resistance levels, given there is sellers’ initiative.
Alternative scenario: if the price falls below 110.45, the uptrend is likely to be broken.

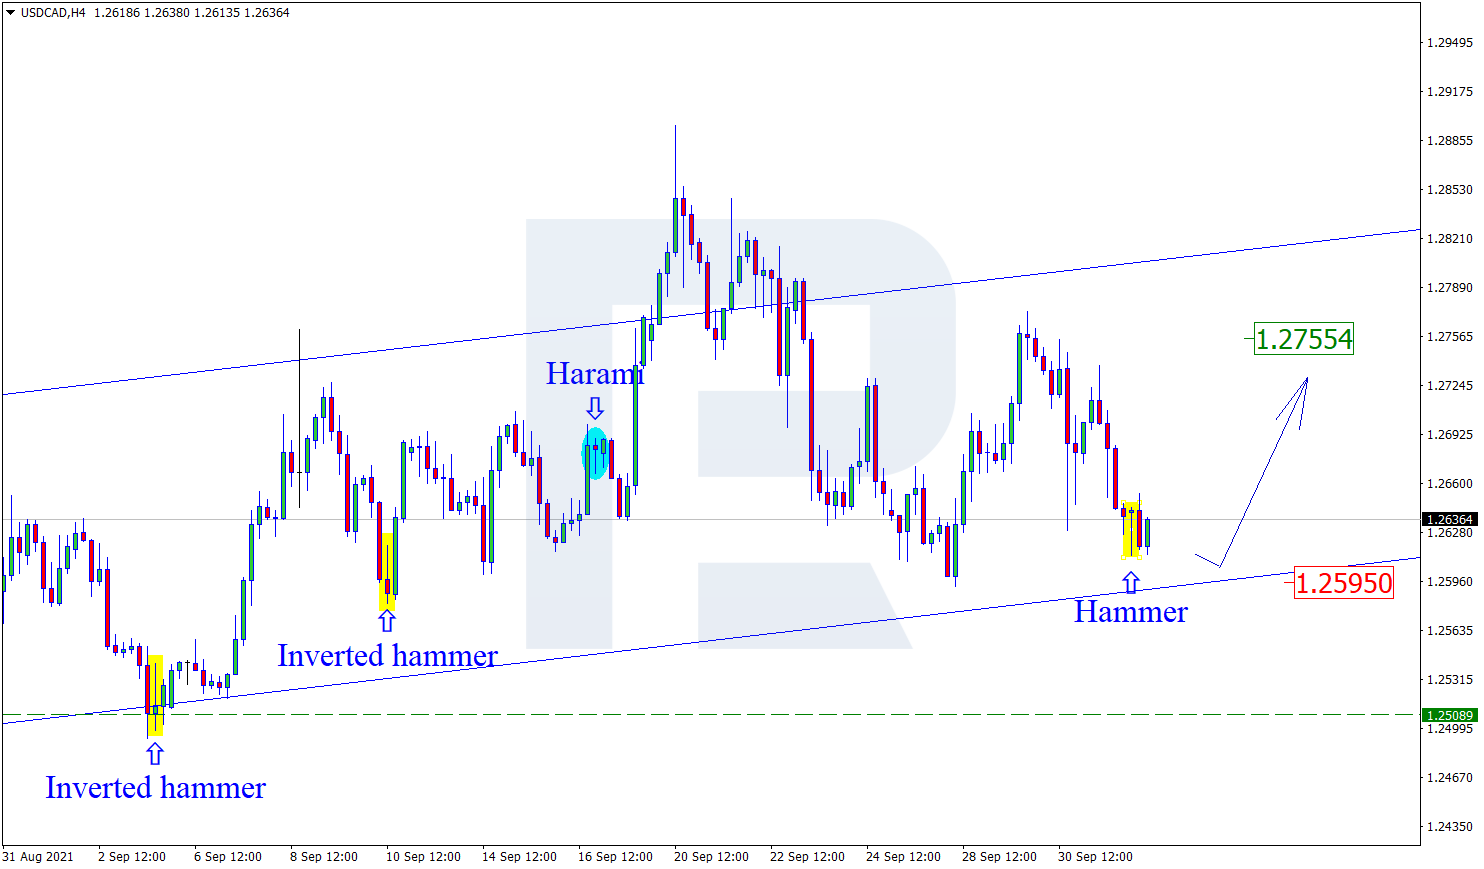
The USD/CAD currency pair
- Prev Open: 1.2588
- Prev Close: 1.2579
- % chg. over the last day: -0.07%
The Canadian dollar is a commodity currency, so USD/CAD is highly dependent on the dynamics of the dollar index and oil prices. Both the dollar index and oil prices strengthened yesterday. As a result, USD/CAD are trading flat.
- Support levels: 1.2565, 1.2518, 1.2425
- Resistance levels: 1.2611, 1.2729, 1.2774, 1.2891
From the technical point of view, the trend of the USD/CAD currency pair is bearish. But the MACD indicator is showing the divergence in the direction of buying. Under such market conditions, it is better to look for sell deals from the resistance levels near the moving average. Buy deals should be considered from the false breakdown zone but with short targets.
Alternative scenario: if the price breaks out through the 1.2774 resistance level and fixes above, the uptrend will likely resume.

- – US Crude Oil Reserves (w/w) at 17:30 (GMT+3).
by JustForex
This article reflects a personal opinion and should not be interpreted as an investment advice, and/or offer, and/or a persistent request for carrying out financial transactions, and/or a guarantee, and/or a forecast of future events.