Archive for Energy – Page 9

Trade Of The Week: Oil surges on Middle East tensions

By ForexTime

  • Oil surges over 5% on geopolitical uncertainty
  • Middle East tensions fuel concerns over crude supplies
  • Keep eye on OPEC/EIA monthly report
  • Brent gaps higher but still under pressure on D1 chart
  • Keep eye on $89.70 dynamic resistance level

Oil prices were in sharp focus on Monday after surging on geopolitical tensions following the weekend attack on Israel.

Brent initially soared more than 5%, recovering a chunk of last week’s hefty losses on fears that Hama’s surprise attack on Israel may deepen tensions across the Middle East. Given how this negative development is likely to fuel concerns over crude supplies, oil bulls could jump back into the game.

Looking at the technical picture, Brent remains under pressure on the weekly charts. However, a strong weekly close back above the $89.70 level may provide an opportunity for bulls to re-challenge $95.00.

This promises to be a wild week for oil and here are 3 reasons why:

     1. Middle East tensions

The developments over the weekend have sparked geopolitical uncertainty and escalated tensions in the Middle East, home to almost a third of global supply.

While neither Israel nor Palestine are major oil producers, there are concerns that the conflict could spread through the region – resulting in major supply disruptions. The risk of the conflict evolving into a proxy war, involving the US and Iran has also raised the risks of more supply shocks amid tightening of sanctions. It is worth keeping in mind that Iran is not only a supporter of Hamas but one of the world’s largest oil producers.

  • Should tension continue to escalate between Israel and Palestine, this could support oil prices as geopolitical uncertainty fuels fears around oil supply.
  • Any signs of easing geopolitical tensions may offer an opportunity for oil prices to close the gap created over the weekend.

     2. OPEC/EIA oil monthly report

Investors will be keeping a close eye on the monthly oil market reports from both the International Energy Agency (EIA) and the Organization of Petroleum Exporting Countries (OPEC) on Thursday.

It is worth noting that oil prices had tumbled aggressively this month, shedding over 8% before the attack on Israel. The global commodity was pressured by concerns over higher interest rates and slowing growth dampening the demand outlook. The monthly reports will be scrutinized for fresh insight into the outlook for crude oil as the final quarter of 2023 gets underway.

  • While the oil market reports have the potential to influence prices, crude is likely to remain heavily influenced by geopolitical risk this week.

     3.Technical forces

After concluding last week on an aggressively bearish note, Brent has gapped up with prices smashing into the 50-day SMA. Despite the sharp move to the upside, bears remain in a position of power below the 89.70 dynamic resistance level.

  • Sustained weakness below $89.70 could encourage a decline back towards $85.20 and the 100-day SMA at $83.00.
  • Should prices experience a strong breakout above $89.70, this may open the doors towards $92.80 and $96.10, respectively.


Forex-Time-LogoArticle by ForexTime

ForexTime Ltd (FXTM) is an award winning international online forex broker regulated by CySEC 185/12 www.forextime.com

Now Is an Opportune Time To Invest in Diverse Energy Co.

Source: Nicholas Cortellucci  (9/27/23)

Despite ongoing positive news, this firm’s stock price is down 23% from its July high, noted an Atrium Research report.

Jericho Energy Ventures Inc. (JEV:TSX.V; JROOF:OTC; JLM:FSE) announced three important developments, seemingly ignored by the market, during this month of September, Atrium Research analyst Nicholas Cortellucci in a September 26 research note.

Good Time To Buy

Accordingly, Atrium reiterated its CA$0.50 per share target price on the Canadian energy company, now trading at CA$0.255 per share, Cortellucci noted.

The difference between the current and target prices implies a significant return for investors of 96%.

Cortellucci also pointed out that Jericho’s stock price is down 23% from its high of CA$0.33 per share in July, despite ongoing positive news since.

“We view the pullback as a buying opportunity ahead of boiler sales orders,” the analyst added.

Jericho remains a Buy.

New Catalysts Lasts Longer

Most recently, durability testing on H2U’s new iridium-free catalyst showed strong results, Cortellucci reported. H2U is Jericho’s portfolio company of which it owns 6.5%.

Testing showed the new catalyst has a projected lifetime of 25,000 hours, which compares to the 1,000−1,500 hours with current iridium-free catalysts. Thus, H2U’s catalysts are projected to last at least six years when used for certain applications.  Testing involved operating the new catalyst continuously for 4,000 hours and at a ten times higher density.

“[These results] represented a significant milestone on H2U’s path to addressing bottlenecks in the sustainable hydrogen supply chain that uses proton exchange membrane electrolyzers,” Cortellucci wrote.

Green Hydrogen Supplier Secured

In other news, reported Cortellucci, Jericho’s partner in the European Union, Exogen, signed a memorandum of understanding on September 19 with Lhyfe SA, a green hydrogen producer and supplier. Lhyfe will supply Exogen with hydrogen for its hydrogen steam plant, equipped with Hydrogen Technologies’ zero-emissions DCC boiler.

“Lhyfe also plans to build and operate green hydrogen production facilities for the combined product offering,” noted Cortellucci.

Another Patent Received

Lastly, on September 12, Hydrogen Technologies, developer of the DCC boiler, was granted another patent in the U.S. for it, reported Cortellucci. Two other related patent applications are pending with the U.S. Patent and Trademark Office.

What To Watch For

Along with orders for the DCC boiler, Cortellucci indicated that near-term stock catalysts include drill results and production growth from its joint venture oil and gas assets in Oklahoma, as well as any funding awards by the government.


Important Disclosures:

  1. Jericho Energy Ventures Inc. is a billboard sponsor of Streetwise Reports and pays SWR a monthly sponsorship fee between US$4,000 and US$5,000.
  2. As of the date of this article, officers and/or employees of Streetwise Reports LLC (including members of their household) own securities of Jericho Energy Ventures Inc.
  3. Doresa Banning wrote this article for Streetwise Reports LLC and provides services to Streetwise Reports as an independent contractor.
  4. The article does not constitute investment advice. Each reader is encouraged to consult with his or her individual financial professional and any action a reader takes as a result of information presented here is his or her own responsibility. By opening this page, each reader accepts and agrees to Streetwise Reports’ terms of use and full legal disclaimer. This article is not a solicitation for investment. Streetwise Reports does not render general or specific investment advice and the information on Streetwise Reports should not be considered a recommendation to buy or sell any security. Streetwise Reports does not endorse or recommend the business, products, services or securities of any company mentioned on Streetwise Reports.

For additional disclosures, please click here.

Disclosures for Atrium Research, Jericho Energy Ventures Inc., September 26, 2023

Analyst Certification Each authoring analyst of Atrium Research on this report certifies that (i) the recommendations and opinions expressed in this research accurately reflect the authoring analyst’s personal, independent and objective views about any and all of the designated securities discussed (ii) no part of the authoring analyst’s compensation was, is, or will be, directly or indirectly, related to the specific recommendations or views expressed in the research, (iii) to the best of the authoring analyst’s knowledge, she/he is not in receipt of material non-public information about the issuer, (iv) the analyst does not own common shares, options, or warrants in the company under coverage, and (v) the analysts adhere to the CFA Institute guidelines for analyst independence.

About Atrium Research Atrium Research provides institutional quality issuer paid research on public equities in North America. Our investment philosophy takes a 3-5 year view on equities currently being overlooked by the market. Our research process emphasizes understanding the key performance metrics for each specific company, trustworthy management teams, unit economics, and an in-depth valuation analysis. General Information Atrium Research Corporation (ARC) has created and distributed this report. This report is based on information we considered reliable; we have not been provided with any material non-public information by the company (or companies) discussed in this report. We do not represent that this report is accurate or complete and it should not be relied upon as such; further any information in this report is subject to change without any formal or type of notice provided. Investors should consider this report as only one factor in their investment decisions; this report is not intended as a replacement for investor’s independent judgment. ARC is not an IIROC registered dealer and does not offer investment-banking services to its clients. ARC (and its employees) do not own, trade or have a beneficial interest in the securities of the companies we provide research services for and does not serve as an officer or Director of the companies discussed in this report. ARC does not make a market in any securities. This report is not disseminated in connection with any distribution of securities and is not an offer to sell or the solicitation of an offer to buy any security in any jurisdiction where such an offer or solicitation would be illegal. ARC does not make any warranties, expressed or implied, as to the results to be obtained from using this information and makes no express of implied warranties for particular use. Anyone using this report assumes full responsibility for whatever results they obtain. This does not constitute a personal recommendation or take into account any financial or investment objectives, financial situations or needs of individuals.

This report has not been prepared for any particular individual or institution. Recipients should consider whether any information in this report is suitable for their particular circumstances and should seek professional advice. Past performance is not a guide for future results, future returns are not guaranteed, and loss of original capital may occur. Neither ARC nor any person employed by ARC accepts any liability whatsoever for any direct or indirect loss resulting from any use of its research or the information it contains. This report contains “forward looking” statements. Forward-looking statements regarding the Company and/or stock’s performance inherently involve risks and uncertainties that could cause actual results to differ from such forward-looking statements. Such statements involve a number of risks and uncertainties such as competition, technology shifts, market demand and the company’s (and management’s) ability to correctly forecast financial estimates; please see the company’s MD&A “Risk Factors” Section for a more complete discussion of company specific risks for the company discussed in this report. ARC is receiving a cash compensation from Jericho Energy Ventures Inc. for 12-months of research coverage. ARC retains full editorial control over its research content. ARC does not have investment banking relationships and does not expect to receive any investment banking driven income. ARC reports are primarily disseminated electronically and, in some cases, printed form. Electronic reports are simultaneously available to all recipients in any form. Reprints of ARC reports are prohibited without permission. The information contained in this report is intended to be viewed only in jurisdictions where it may be legally viewed and is not intended for use by any person or entity in any jurisdiction where such use would be contrary to local regulations or which would require any registration requirement within such jurisdiction.

Clean Tech Co. Partners With European Hydrogen Producer

Source: Streetwise Reports  (9/25/23)

This company’s European partner has signed a memorandum of understanding with a leading producer and supplier of renewable hydrogen to offer decarbonization solutions on the continent.

Jericho Energy Ventures Inc. (JEV:TSX.V; JROOF:OTC; JLM:FSE) announced that its European partner, Exogen Hydrogen Solutions, has signed a memorandum of understanding with a leading European producer and supplier of renewable hydrogen to offer decarbonization solutions for industrial steam, district heating, and mobility applications on the continent.

Lhyfe inaugurated its first green hydrogen production site in 2021 and has five more under construction. It said it plans to achieve 3 gigawatts (GW) of installed capacity of hydrogen production by 2030.

“Green hydrogen has become highly relevant for decarbonizing industrial steam, district heating, and logistics,” Lhyfe Vice President of Sales and Business Development Philippe Desorme said.

Atrium Research analyst NicholasCortelluci has a Buy rating on the stock with a target price of CA$0.50 per share.

“By partnering with Exogen, we expect a significant expansion of our green hydrogen production output over time while also opening a completely new market segment for us.”

Jericho subsidiary Hydgrogen Technologies’ Dynamic Combustion Chamber™ boiler burns hydrogen and oxygen in a vacuum chamber to create high-temperature water and steam with no greenhouse gases or other pollutants. The only by-product is water, which is recycled. It’s meant to replace existing boilers that burn coal, natural gas, diesel, or fuel oil.

The Catalyst: A New Type of Ecosystem

Jericho recently announced a partnership with two other companies, Exogen and the Sofinter Group, to build, implement, and service a new complete hydrogen steam plant that can permanently eliminate the CO2 equivalent of about 5,000 cars: the HSP3000.

The partnership between Exogen, which is offering the final integrated product that comes pre-assembled in container-sized units, and Lhyfe “paves the way for a new type of ecosystem and vast markets for green and renewable hydrogen,” Lhyfe said in a release.

The product and partnership should also have a positive effect on Hydrogen Technologies’ sales in the second half of the year, as the company recently announced its first sale of a DCC™ boiler system to a prominent anonymous university, Atrium Research analyst Nicholas Cortellucci wrote in a research note.

“This (sale) . . . positions JEV as a key industry leader and a first mover in its category,” Cortelluci wrote. Cortellucci has a Buy rating on the stock with a target price of CA$0.50 per share.

Another recent Jericho and Hydrogen Technologies announcement also bodes well for the company, Cortellucci wrote. The company is collaborating with a “leading global alcoholic beverage company” to study using the boilers at production facilities in four countries.

“The HSP3000 can also eliminate all NOx, CO2, and other GHG emissions from industrial steam and district heating applications, potentially allowing clients to harvest carbon credits,” Cortellucci wrote. “We expect the product launch to expedite sales commitments across various industries, including Pulp & Paper, Food & Beverages, Pharmaceuticals, Industrial Chemicals, and O&G (oil and gas).”

DCC™ boilers are being considered for deployment at major facilities around the world, with feasibility studies being conducted or considered at dozens of locations, the company has said.

Decarbonizing Heat a Big Challenge

Lhyfe’s role will be to operate green hydrogen production facilities so the combined products can open new markets for growth in Europe in industrial steam and district heating.

Steam production is a core component of many processes in industries including pulp and paper, food and beverages, pharmaceuticals, industrial chemicals, and oil and gas.

“There is growing demand by multinationals and industrial clusters targeting operating synergies from combining thermal and mobility solutions powered by green hydrogen,” Lhyfe said in a release. “The mobility applications are aimed at hydrogen refilling stations for forklifts, vans, delivery trucks, and cars. Thermal solutions include industrial steam, large buildings, and district heating applications.”

Decarbonizing heat is the biggest challenge energy markets face, Exogen Chief Revenue Officer Saverio Costanzo said.

“In our mission to decarbonize energy applications, Lhyfe is an ideal partner,” Costanzo said. “The future of energy applications is green, and we are right in the middle of it.”

On September 12, Jericho reported approval from the U.S. Patent and Trademark Office for the protection of the DCC™ boiler.

Hydrogen Technologies has two further patents pending to protect and enhance the device’s novel intellectual property, and the company has begun receiving initial commercial orders.

The company is “excited about the new patent allowance from the USPTO and looks forward to the opportunity to continue to expand its portfolio of IP related to its emission-free industrial hydrogen boiler system,” Jericho Chief Executive Officer Brian Willamson said.

A ‘Uniquely Versatile Energy Carrier’

According to the International Energy Agency, the world needs more hydrogen technology and projects to meet a net-zero emissions scenario by 2050.

“Faster action is required on creating demand for low-emission hydrogen and unlocking investment that can accelerate production scale-up and deployment of infrastructure,” the agency wrote.

The hydrogen market has the “potential for near-zero greenhouse gas emissions,” the U.S. Department of Energy said.

“Hydrogen generates electrical power in a fuel cell, emitting only water vapor and warm air,” the agency wrote. “It holds promise for growth in both the stationary and transportation energy sectors.”

Hydrogen doesn’t occur on its own naturally on Earth, despite being the most abundant element in the universe. It needs to be separated from water or hydrocarbon carbons using electrolyzers.

Retail: 55%
Management/Insiders: 35%
Non-Insider Institutions: 10%
55%
35%
10%
*Share Structure as of 7/27/2023


It’s also a “uniquely versatile energy carrier,” according to a report by the Hydrogen Council. “It can be produced using different energy inputs and different production technologies. It can also be converted to different forms and distributed through different routes — from compressed gas hydrogen in pipelines through liquid hydrogen on ships, trains or trucks, to synthesized fuel routes.”

Ownership and Share Structure

Around 35% of Jericho’s shares are held by management, insiders, and insider institutional investors, the company said. They include CEO Brian Williamson, who owns 1.25% or about 3.1 million shares; founder Allen William Wilson, who owns 0.79% or about 1.97 million shares; and board member Nicholas Baxter, who owns 0.46%, or about 1.14 million shares, according to Reuters.

Around 10% of shares are held by non-insider institutions, and 65% are in retail, the company said.

JEV’s market cap is CA$67 million, and it trades in a 52-week range of CA$0.44 and CA$0.21. It has 248.14 million shares outstanding and 178.38 million floating.


Important Disclosures:

  1. Jericho Energy Ventures Inc. is a billboard sponsor of Streetwise Reports and pays SWR a monthly sponsorship fee between US$4,000 and US$5,000.
  2. As of the date of this article, officers and/or employees of Streetwise Reports LLC (including members of their household) own securities of Jericho Energy Ventures Inc.
  3. Steve Sobek wrote this article for Streetwise Reports LLC and provides services to Streetwise Reports as an employee.
  4. The article does not constitute investment advice. Each reader is encouraged to consult with his or her individual financial professional. By opening this page, each reader accepts and agrees to Streetwise Reports’ terms of use and full legal disclaimer. This article is not a solicitation for investment. Streetwise Reports does not render general or specific investment advice and the information on Streetwise Reports should not be considered a recommendation to buy or sell any security. Streetwise Reports does not endorse or recommend the business, products, services or securities of any company mentioned on Streetwise Reports.

For additional disclosures, please click here.


Oil bulls: Not done yet?

By ForexTime

  • Crude oil now pulling back from year-to-date high
  • $90 psychological region tested for support now
  • Daily close below 21-day EMA may invite more declines
  • Elliot Wave theory suggests more eventual room for gains


Oil bulls (those hoping prices will move higher) may just be taking a breather for the moment.

Prices of US crude have pulled back since reaching the year-to-date high at $93.59 on September 19th, but this may be short-lived.

The decline from this swing high was likely due to a couple of factors:

  •  a bounce off the upward rising channel’s resistance which has been tested three times since the rally starting from June 7th, 2023.
  • a technical pullback, after its 14-day relative strength has been in “overbought” territory (above the 70 threshold) for the two weeks prior

Notably, Crude is now testing the psychologically-important $90/bbl level for immediate support.

The 23.6 Fibonacci retracement level also sits close by, at $89.92, to potentially lend stronger support.


Potential support ahead

Crude oil prices are currently still above, albeit declining, towards it’s 21-day EMA.

A continued decline could see bears take advantage of this reversion to its mean to potentially test the following key support levels:

  • $88.31: 21-Day EMA
  • $87.65:38.2 Fib ratio
  • $85.81: bottom upward ascending channel trendline, also the 50 Fib ratio line

The Fibonacci retracement tool is applied to the daily time frame from 24th August’ low at $78.04 to the year- to- dates high.

More upside for Crude? Elliot Wave theory says “yes”

Taking Elliot wave count into consideration, crude oil has yet to complete the 3rd impulse move from wave 2’s termination at the $78.04 lows.

This suggests that Crude prices must reach at least $95.81, or potentially even break above the psychologically-important $100/bbl line, before the 3rd impulse move is deemed “complete.

In short, adhering to the Elliot Wave theory, this suggests there should be more near-term gains ahead for Crude oil.


Forex-Time-LogoArticle by ForexTime

ForexTime Ltd (FXTM) is an award winning international online forex broker regulated by CySEC 185/12 www.forextime.com

Is the Current Oil Uptrend a Head Fake?

Technical Analyst Clive Maund shares his view on the current state of the oil market. 

Source: Clive Maund  (9/20/23) 

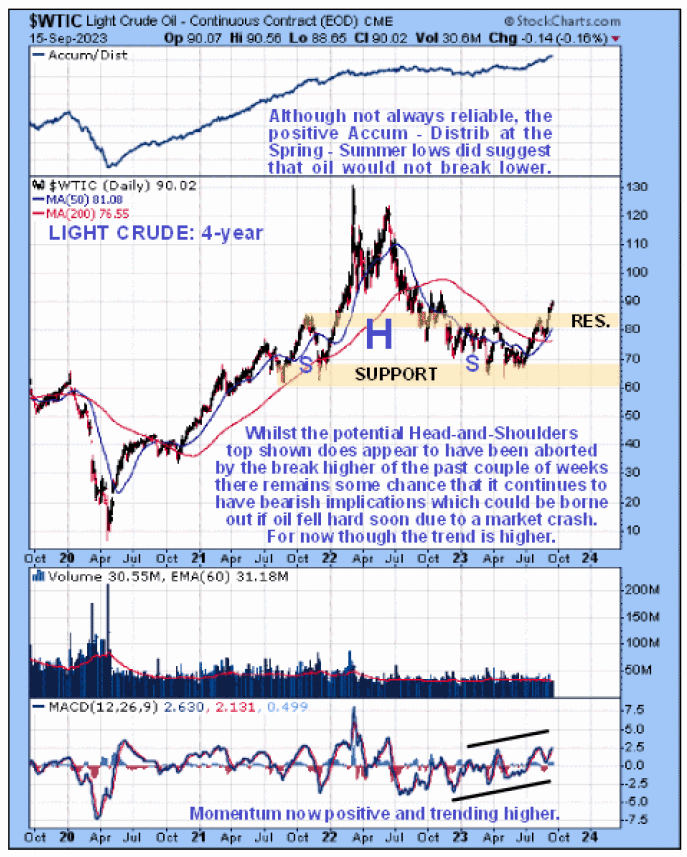
Although the last Oil Market update posted on May 3 has been proven wrong, since the giant Head-and-Shoulders top in oil that we observed back then has seemingly aborted, with the price of crude in recent weeks breaking above the Shoulders of the suspected H&S top, the pattern may continue to have bearish implications because if the broad market drops like a rock soon, as is looking increasingly likely, then oil and the oil sector will turn tail and plunge too, which means that the rally of recent weeks may turn out to be a sucker rally or “head fake.”

We’ll start by looking at the 4-year chart for Light Crude because this enables us to see this seemingly aborted H&S top to advantage, the rally of recent weeks having risen above the highs of the Shoulders of the pattern. The pattern still looks overall bearish, so this rally is anomalous. On the face of it, having broken above the resistance at the Shoulders of the H&S and with its Accumulation line strong (not always reliable) and momentum trending higher, oil looks set fair to continue advancing, but it looks a lot different if we factor in that the broad stockmarket may soon plunge as part of a pan selloff that takes most everything down.

As we know, low oil prices benefit the common man and business generally since many products use oil, and low oil prices mean lower transportation costs. However, the powerful elite transnational cartels that control oil do not want low oil prices — they want high oil prices because that means bigger profits for them. There isn’t much they can do about the demand side of the equation, which is relatively constant, apart, of course, from major economic depressions that drastically reduce demand for oil and thus the price, but they can and do manipulate the supply side of the equation on a grand scale.

This is a reason why one of the first things that the Biden administration did was attack the U.S. oil industry, which was vibrant and producing a surplus by the end of the Trump presidency, by closing down pipelines and curbing exploration, etc., another reason being to make electric vehicles more attractive. They also, when it suits them, use cruder methods to support the oil price, such as setting fire to oil refineries and blowing up oil tankers, etc. We have seen a lot of this going on in the recent past, and even though they have succeeded in jacking up the oil price in recent weeks, it will be to no avail if the stock market crashes soon as part of a pan-selloff.

You will remember what happened to oil in the Spring of 2020. For a while, you couldn’t give it away. Now, we have another crash in the prospect that will be triggered by a tidal wave of bank failures and possibly new lockdowns in pursuit of the WEF’s Agenda 2030. The point is that although oil has succeeded in aborting the H&S top that we had earlier observed and is seemingly on its way higher, it could soon have the rug pulled from under it by a market crash.

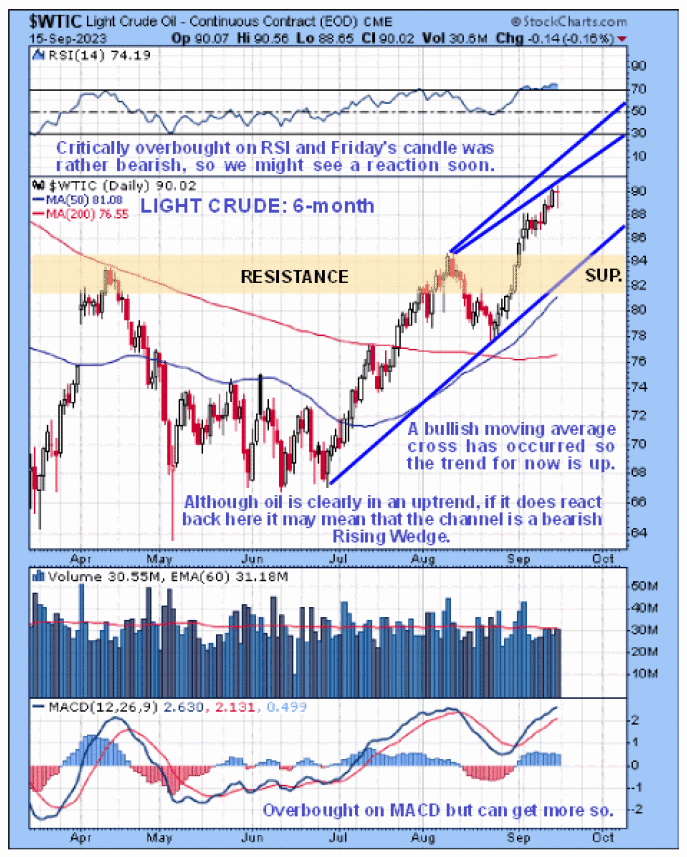
Moving on, we see on the 6-month chart for Light Crude that although oil remains in a quite strong uptrend that began early in July with a bullish moving average cross having occurred, it is now overbought and appears to be spluttering at a provisional inner trendline that if valid will turn the uptrend into a bearish Rising Wedge, putting it at risk of suddenly turning lower and dropping hard to break down from the uptrend, which would quickly lead in the event of a broad market meltdown to a brutal plunge.

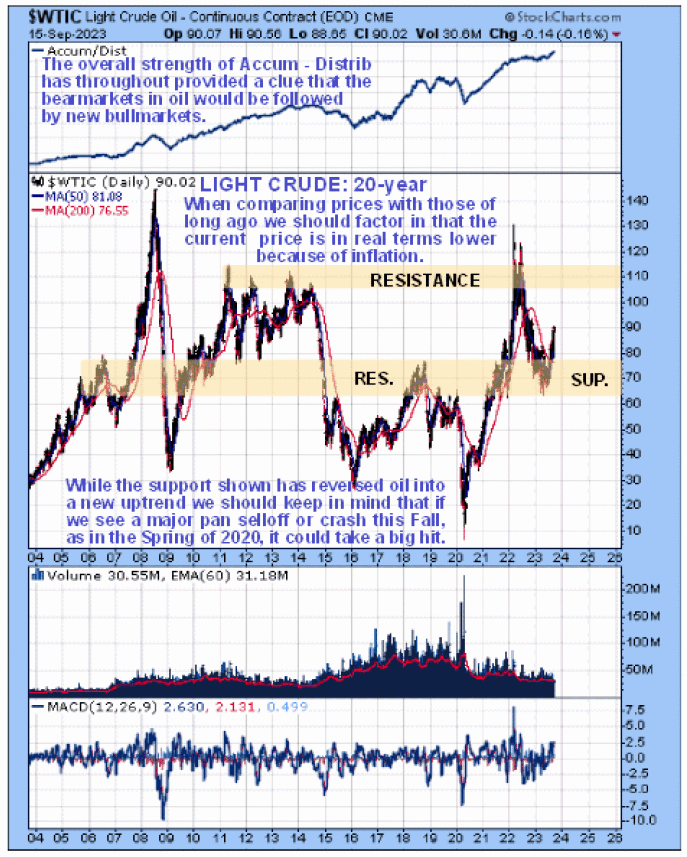
Now, we’ll look at the 20-year chart for Light Crude to get a big-picture perspective. Here, we see that oil’s recent advance followed its dropping back last year and early this year to a zone of quite strong support.

We can also see that oil is still way below its all-time highs achieved way back in 2008, and if we factor in inflation since then, it is even further below those highs in real terms.

Now, we’ll look at oil stocks by means of charts for the XOI oil index, using the same timeframes as the oil charts to enable direct comparison.

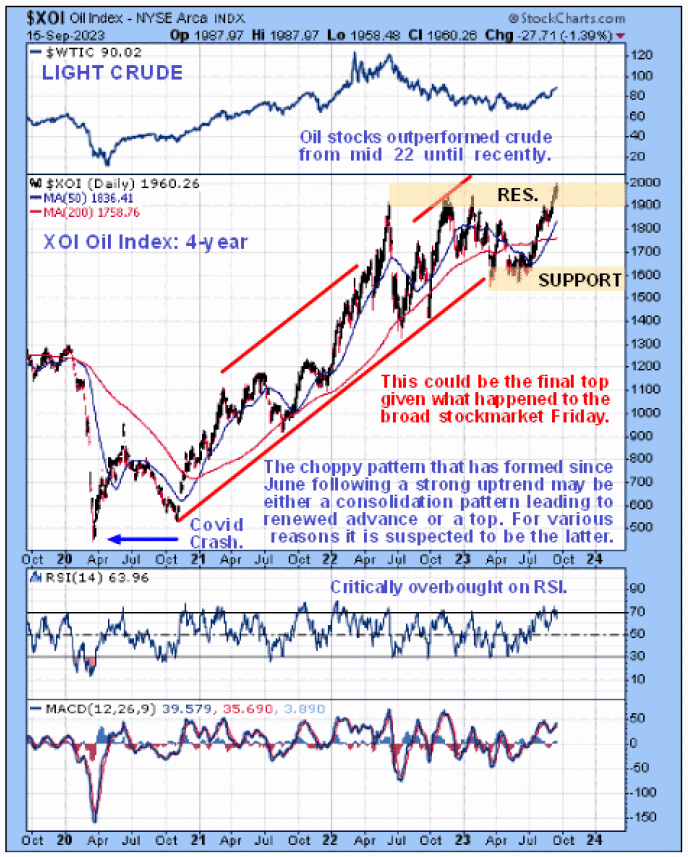
Beginning again with a 4-year chart for the XOI oil index, we see that oil stocks began a powerful uptrend late in 2020 that resulted in this index more than tripling in price, which is certainly very impressive. However, the index started to break down from this uptrend in the Spring, and despite the rally of recent weeks having taken it to new highs, it is suspected that a large rounding top pattern is forming, mindful that the broad stockmarket may soon tank, oil stocks could be at their final high here.

An important point worth observing on this chart is that, despite oil itself having fallen back hard from its mid-2022 highs above $120 to about $70 in the Spring of this year, oil stocks remained buoyant during this period, only dropping back relatively modestly, but as mentioned above it now looks like a top area is forming.

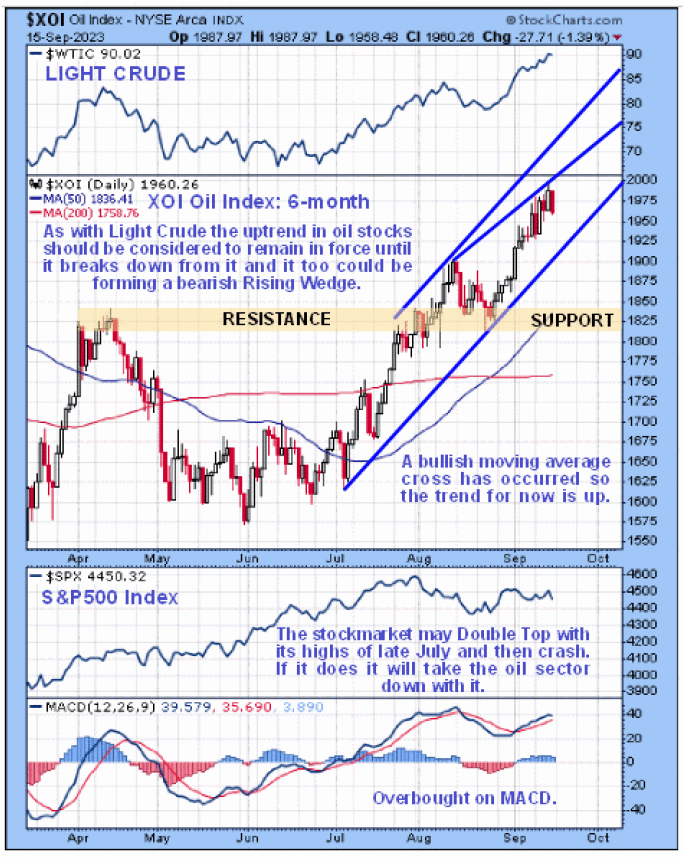
Turning to the 6-month chart for the oil index, we can see the quite steep uptrend that began in July in detail.

Superficially, it looks like there is “no stopping it” with the uptrend very much in force and a bullish cross of the moving averages having occurred, but on closer inspection, we can also see that the latest upleg has not — yet, at least — been confirmed by momentum and also that the choppy action of recent days suggests that it might be topping out short-term here, which will mean that the uptrend is converging, making it a bearish Rising Wedge.

If so, and it breaks down below its lower boundary, as could happen if the broad market crashes or drops hard, then a severe decline would be in prospect.

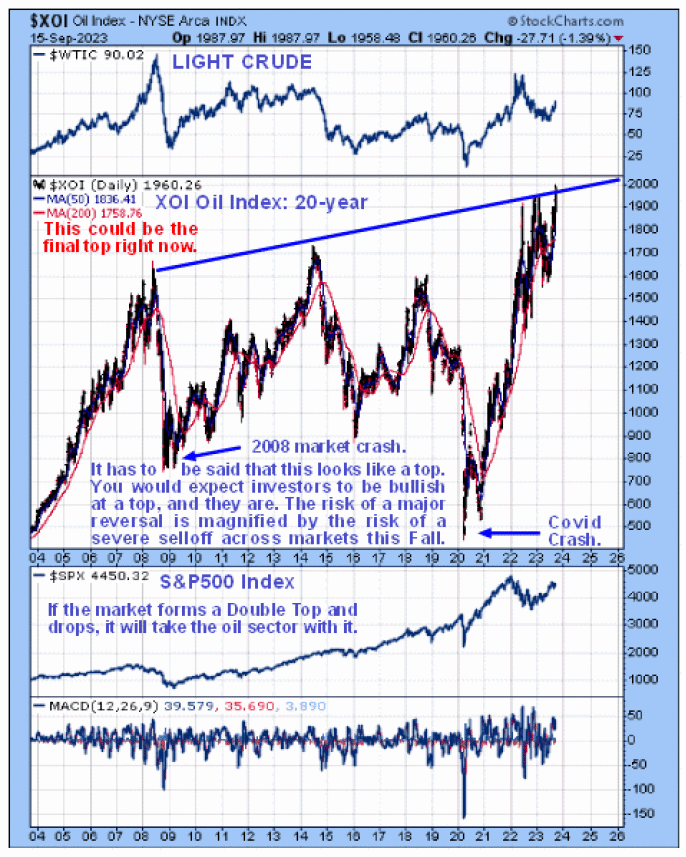
When we zoom out and look at the long-term 20-year chart for the XOI index, we can at once see why it might be at the final top right now, for it has arrived at a major trendline target at a long-term cyclical high.

Everyone is raving bullish on the oil sector now, which is exactly what you would expect at the top, meaning that this might be the perfect place to defy the crowd and short it. As the old British SAS motto says, “Who dares wins,” which we will only qualify by adding “or dies trying.”

Originally posted at Clivemaund.com at 11.00 am EDT on September 17, 2023


Important Disclosures:

  1. Statements and opinions expressed are the opinions of the author and not of Streetwise Reports or its officers. The author is wholly responsible for the validity of the statements. The author was not paid by Streetwise Reports for this article. Streetwise Reports was not paid by the author to publish or syndicate this article. Streetwise Reports requires contributing authors to disclose any shareholdings in, or economic relationships with, companies that they write about. Streetwise Reports relies upon the authors to accurately provide this information and Streetwise Reports has no means of verifying its accuracy.
  2. This article does not constitute investment advice. Each reader is encouraged to consult with his or her individual financial professional and any action a reader takes as a result of information presented here is his or her own responsibility. By opening this page, each reader accepts and agrees to Streetwise Reports’ terms of use and full legal disclaimer. This article is not a solicitation for investment. Streetwise Reports does not render general or specific investment advice and the information on Streetwise Reports should not be considered a recommendation to buy or sell any security. Streetwise Reports does not endorse or recommend the business, products, services or securities of any company mentioned on Streetwise Reports.

For additional disclosures, please click here.

Clivemaund.com Disclosures

The above represents the opinion and analysis of Mr. Maund, based on data available to him, at the time of writing. Mr. Maund’s opinions are his own, and are not a recommendation or an offer to buy or sell securities. Mr. Maund is an independent analyst who receives no compensation of any kind from any groups, individuals or corporations mentioned in his reports. As trading and investing in any financial markets may involve serious risk of loss, Mr. Maund recommends that you consult with a qualified investment advisor, one licensed by appropriate regulatory agencies in your legal jurisdiction and do your own due diligence and research when making any kind of a transaction with financial ramifications. Although a qualified and experienced stock market analyst, Clive Maund is not a Registered Securities Advisor. Therefore Mr. Maund’s opinions on the market and stocks can only be construed as a solicitation to buy and sell securities when they are subject to the prior approval and endorsement of a Registered Securities Advisor operating in accordance with the appropriate regulations in your area of jurisdiction.

Oil’s rally continues. Investors are in no hurry to intensify trading ahead of the Fed meeting

By JustMarkets

At the close of the stock exchange on Monday, the Dow Jones Index (US30) rose by 0.02%, and the S&P 500 Index (US500) increased by 0.07%. The NASDAQ Technology Index (US100) closed Monday at its opening price. Stock indices were down on Monday due to caution ahead of the two-day FOMC meeting on Tuesday and Wednesday. Markets fully expect the FOMC to leave the main rate target unchanged at 5.5% (99% probability) this week. However, the FOMC is expected to maintain a hawkish tone and remain open to one last rate hike, as inflation and the economy have not slowed enough yet.

Markets estimate the probability of the FOMC raising the rate by 25 bps at the November 1 meeting as 31%, and the probability of a 25 bps rate hike at the next meeting on December 13 is 14%. The markets then expect the FOMC to start cutting rates in 2024 in response to an expected slowdown in the US economy.

The NAHB US housing market index published on Monday fell by  5 points to a 5-month low of 45, which was much weaker than expected. The decline in confidence expressed by US homebuilders suggests that home-building activity may weaken in the coming months.

Apple (AAPL) shares jumped by 1.69% on Monday amid optimism about strong pre-orders for the latest iPhone 15 model. PayPal Holdings (PYPL) fell by 1.98% when MoffettNathanson downgraded the company to “downgrade” from “outperform” as analysts expect weak earnings growth due to increased competition.

Equity markets in Europe were mostly down yesterday. Germany’s DAX (DE40) fell by 1.05%, France’s CAC 40 (FR40) lost 1.39%, Spain’s IBEX 35 (ES35) decreased by 0.71%, and the UK’s FTSE 100 (UK100) closed negative 0.76%.

For the Eurozone, the main focus for the week ahead begins today with the inflation report, and another decline could have a negative impact on the euro but a positive impact on European indices. Eurozone and German business PMIs are expected to remain weak, although Friday’s announcement by Fitch that Germany remains under a AAA credit rating suggests a positive and stable outlook for the Eurozone’s largest economy. But overall, the US economy is much stronger right now than the Eurozone economy, and that’s evident in pricing and central bank guidance. This will likely keep the US dollar high against the euro until cracks in the US economy start to appear in the inflationary and labor environment.

WTI crude oil prices rose to a new 11-month high on Monday, extending a rally seen over the past three months on expectations of a tight supply outlook for the rest of the year. Oil company Aramco forecasts record consumption of 103-104 million BPD in the second half of 2023. Oil prices received support from forecasts made last week by the International Energy Agency (IEA) and OPEC that the global oil market will be in deficit until the end of the year. And the bearish factors are not even enough to stop the rally yet.

Asian markets were mostly down. Japan’s Nikkei 225 was not trading yesterday, China’s FTSE China A50 (CHA50) added 0.91%, Hong Kong’s Hang Seng (HK50) decreased by 1.39% on the day, and Australia’s S&P/ASX 200 (AU200) was negative 0.67% on Monday.

The RBA’s Monetary Policy Minutes for August showed that Committee officials believe that inflation is still too high and is expected to remain so for an extended period of time. Committee representatives also noted that the previous month’s payroll data were broadly in line with the Bank’s forecasts: the labor market remains tight, but conditions are easing. The decision to maintain the interest rate at this meeting was due to the fact that interest rates have been raised significantly over a short period of time, and the effect of monetary tightening has not yet been fully realized.

S&P 500 (F)(US500) 4,453.53 +3.21 (+0.07%)

Dow Jones (US30) 34,624.30 +6.06 (+0.02%)

DAX (DE40)  15,727.12 −166.41 (−1.05%)

FTSE 100 (UK100) 7,652.94 −58.44 (−0.76%)

USD Index  105.09 −0.24 (−0.22%)

News feed for 2023.09.19:
  • – Australia RBA Meeting Minutes (m/m) at 04:30 (GMT+3);
  • – Switzerland Trade Balance (m/m) at 09:00 (GMT+3);
  • – Eurozone Consumer Price Index (m/m) at 12:00 (GMT+3);
  • – Canada Consumer Price Index (m/m) at 15:30 (GMT+3);
  • – US Building Permits (m/m) at 15:30 (GMT+3).

By JustMarkets


This article reflects a personal opinion and should not be interpreted as an investment advice, and/or offer, and/or a persistent request for carrying out financial transactions, and/or a guarantee, and/or a forecast of future events.

“Climbing Oil Prices Bearish for Stocks”? It’s a Myth!

Oil and stocks sometimes trend together. Other times, they don’t.

By Elliott Wave International

There’s a widespread belief that rising oil prices are bearish for the main stock indexes and falling oil prices are bullish for stocks.

That belief is reflected in this Sept. 5 CNBC headline:

Dow closes nearly 200 points lower as rising oil prices drag down stocks …

But wait a minute, the broad stock market rallied in July as the price of crude oil was also climbing.

Getting back to the same financial website, an Aug. 1 headline said (CNBC):

Oil joined the July stocks rally …

Going further back this year, an April 14 Barron’s headline noted:

Oil Prices and Stocks Have Rallied …

These cases here in 2023 are by no means the first time that the behavior of the oil and stock markets have defied conventional wisdom.

Here’s a chart and commentary from Robert Prechter’s landmark book, The Socionomic Theory of Finance:

The July 25, 2006 issue of The Elliott Wave Theorist offered [this chart], showing the preceding three-year market environment. Examine it and see if you can discern any indication whatsoever that lower oil prices make stocks rise or vice versa. As I said at the time, “Oil and stocks have trended mostly in the same direction for more than three years.

And, as you can see from this next chart, stocks and oil also crashed together for much of 2008 going into 2009. And then rose together — again, with crude oil tripling in value as the S&P 500 index doubled in value.

So, maybe rising oil prices do not “make” stocks fall after all (and vice versa.)

Every market has its own investor psychology that drives it. You may want to look to the Elliott wave model for a high-confidence ascertainment of the oil and stock markets independently from each other.

If you want to delve into the details of Elliott wave analysis, an ideal resource is Frost & Prechter’s book, Elliott Wave Principle: Key to Market Behavior. Here’s a quote from this Wall Street classic:

After you have acquired an Elliott “touch,” it will be forever with you, just as a child who learns to ride a bicycle never forgets. Thereafter, catching a turn becomes a fairly common experience and not really too difficult. Furthermore, by giving you a feeling of confidence as to where you are in the progress of the market, a knowledge of Elliott can prepare you psychologically for the fluctuating nature of price movement and free you from sharing the widely practiced analytical error of forever projecting today’s trends linearly into the future. Most important, the Wave Principle often indicates in advance the relative magnitude of the next period of market progress or regress.

Here’s good news: You can access the entire online version of the book for free!

The only requirement for free access is a Club EWI membership — which is also free. Club EWI is the world’s largest Elliott wave educational community with about 500,000 worldwide members.

Club EWI members enjoy complimentary access to a wealth of Elliott wave resources on financial markets, investing and trading — including videos and articles from Elliott Wave International’s analysts.

Get started by following this link: Elliott Wave Principle: Key to Market Behaviorget free and instant access.

This article was syndicated by Elliott Wave International and was originally published under the headline “Climbing Oil Prices Bearish for Stocks”? It’s a Myth!. EWI is the world’s largest market forecasting firm. Its staff of full-time analysts led by Chartered Market Technician Robert Prechter provides 24-hour-a-day market analysis to institutional and private investors around the world.

Murrey Math Lines 15.09.2023 (Brent, S&P 500)

By RoboForex.com

Brent

Brent crude oil quotes and the RSI on H4 are in their respective overbought areas. In this situation, a downward breakout of 8/8 (93.75) is expected, followed by a decline to the support at 6/8 (90.62). The scenario can be cancelled by an upward breakout of +1/8 (95.31). In this case, the quotes could aim at the resistance at +2/8 (96.88).

Brent_H4
Risk Warning: the result of previous trading operations do not guarantee the same results in the future

On M15, the lower boundary of the VoltyChannel is too far from the current price, so the decline might only be supported by a downward breakout of 8/8 (93.75) on H4.

Brent_M15
Risk Warning: the result of previous trading operations do not guarantee the same results in the future

S&P 500

On H4, the S&P 500 index quotes are above the 200-day Moving Average, indicating the prevalence of an uptrend. However, the RSI has already reached the overbought area. As a result, in these circumstances, a test of 4/8 (4531.2) is expected, followed by a rebound from this level and a decline to the support at 3/8 (4492.2). The scenario can be cancelled by rising above the resistance level of 4/8 (4453.1). In this case, the S&P 500 could continue growing and reach 5/8 (4570.3).

S&P500_H4
Risk Warning: the result of previous trading operations do not guarantee the same results in the future

On M15, the lower boundary of the VoltyChannel is too far from the current price, so the decline might only be supported by a rebound from 4/8 (4531.2) on H4.

S&P500_M15

Article By RoboForex.com

Attention!
Forecasts presented in this section only reflect the author s private opinion and should not be considered as guidance for trading. RoboForex LP bears no responsibility for trading results based on trading recommendations described in these analytical reviews.

Oil prices rose to a 10-month-high. The presentation of the new iPhone 15 lineup did not impress investors

By JustMarkets

At Tuesday’s stock market close, the Dow Jones Index (US30) decreased by 0.05%, while the S&P 500 Index (US500) lost 0.57%. The NASDAQ Technology Index (US100) closed negative by 1.04%. Weakness in technology stocks had a negative impact on the overall market. For example, Oracle closed down more than 13% after reporting lower-than-expected first-quarter earnings due to a slowdown in cloud sales. According to Morgan Stanley, Oracle’s results raise questions about the timing of artificial intelligence (AI) demand turning into revenue for the company. In addition, Apple shares were down more than 1% after introducing the iPhone 15 lineup.

On the positive side, energy stocks rallied after the price of WTI crude oil rose to a near 10-month high. In addition, shares of several regional banks rose after an upbeat outlook at the Barclays Global Financial Services Conference.

The US financial markets are awaiting the release of consumer price data on Wednesday. Economists’ median estimate is that the pace of growth in the consumer price index will accelerate to 3.6% y/y in August, although the core reading, which excludes food and energy costs, will fall to 4.3% y/y. On a month-on-month basis, however, overall CPI is forecast to rise 0.6%, which would be the biggest jump since inflation peaked in June 2022. If the data matches expectations, it will increase the likelihood of a US Fed rate hike at the November meeting and support the USD index. Currently, markets are pricing in a 7% chance of a 25 bps rate hike at the September 20 FOMC meeting and a 42% chance of a 25 bps hike at the November 1 FOMC meeting.

Equity markets in Europe were mostly down yesterday. Germany’s DAX (DE40) decreased by 0.54%, France’s CAC 40 (FR40) fell by 0.11% on Tuesday, Spain’s IBEX 35 (ES35) added 0.27%, and the UK’s FTSE 100 (UK100) closed up by 0.41%

The ECB meeting will take place as early as Thursday, amid much uncertainty, as price pressures in the Eurozone remain elevated and data suggests a sharp slowdown in economic activity. The latest Spanish inflation data showed that consumer prices rose to 2.6% y/y in August, influenced by higher fuel costs, up from a 2.3% y/y reading last month. The probability of the ECB raising interest rates by 25 bps at Thursday’s meeting rose to 52% from 38% a day earlier.

Oil rose to a near 10-month high, and gasoline rose to a 2-week high. Limited global oil supplies helped boost prices on Tuesday after OPEC’s monthly report forecast global crude inventories to fall to a 10-year low. A decline in oil in floating storage is also a bullish factor for prices. On Monday, Vortexa released weekly data showing that the volume of crude oil stored in tankers afloat for at least a week fell by 5.8% from the previous month to 81.02 million barrels as of September 8, the lowest in 9 months.

Asian markets traded flat on Tuesday. Japan’s Nikkei 225 (JP225) jumped by 0.95% yesterday, China’s FTSE China A50 (CHA50) lost 0.32%, Hong Kong’s Hang Seng (HK50) decreased by 0.39%, and Australia’s S&P/ASX 200 (AU200) was positive by 0.20% on Tuesday.

On Monday, natural gas prices received support from a rise in European gas prices to a one-week high. LNG production workers at key Chevron facilities in Australia began a partial strike last week after talks with management failed to reach an agreement. The workers said that if no agreement is reached, they will completely stop work for two weeks starting this Thursday.

Sentiment towards China remains largely negative as a raft of economic indicators for August painted a weak picture of Asia’s largest economy. Added to this was Beijing’s slow rollout of additional stimulus measures.

Bank of Japan (BoJ) watchers shifted their forecasts for an end to negative interest rates after Bank Governor Kazuo Ueda touched on the possibility in an interview published over the weekend. Most economists believe that the BoJ will stick to its previous policy at next week’s BoJ board meeting, with the authorities predicted to abandon negative interest rates by the end of June next year.

S&P 500 (F)(US500) 4,461.90 −25.56 (−0.57%)

Dow Jones (US30) 34,645.99 −17.73 (−0.051%)

DAX (DE40)  15,715.53 −85.46 (−0.54%)

FTSE 100 (UK100) 7,527.53 +30.66 (+0.41%)

USD Index  104.54 +0.01 (+0.01%)

Important events for today:
  • – Japan Producer Price Index (m/m) at 02:50 (GMT+3);
  • – UK GDP (m/m) at 09:00 (GMT+3);
  • – UK Industrial Production (m/m) at 09:00 (GMT+3);
  • – UK Manufacturing Production (m/m) at 09:00 (GMT+3);
  • – UK Trade Balance (m/m) at 09:00 (GMT+3);
  • – Eurozone Industrial Production (m/m) at 12:00 (GMT+3);
  • – US Consumer Price Index (m/m) at 15:30 (GMT+3);
  • – US Crude Oil Reserves (w/w) at 17:30 (GMT+3).

By JustMarkets


This article reflects a personal opinion and should not be interpreted as an investment advice, and/or offer, and/or a persistent request for carrying out financial transactions, and/or a guarantee, and/or a forecast of future events.

New petrol pain and global inflation fears as OPEC keeps oil curbs

By George Prior 

Petrol prices and global inflation are likely to tick higher again as the OPEC+ group of oil producing countries will hold production at nine million barrels a day for the rest of the year.

This is the stark warning from Nigel Green, the founder of deVere Group, one of the world’s largest independent financial advisory, asset management and fintech organizations, as Saudi Arabia announced it would maintain its production cut of one million barrels a day until December.

This maintains the country’s output at nine million barrels a day, the lowest amount in several years. Russia has also confirmed it would maintain its own cutback of 300,000 barrels a day for the same period.

Nigel Green comments: “OPEC+ is ramping up petrol price pain, triggering fresh and increasing concerns about rising global inflation – which was just beginning to ease – meaning central banks could possibly push higher-for-longer interest rates.”

He continues: “Restricted oil supply leads to higher oil prices, which, in turn, can contribute to higher fuel prices for consumers and businesses, putting upward pressure on overall inflation.

“Higher energy costs also lead to increased production costs for companies, which are typically passed on to consumers in the form of higher prices for goods and services, again contributing to inflationary pressures.”

Consumer behavior also plays a role. When fuel prices rise, consumers may cut back on discretionary spending, which can impact economic activity. Reduced consumer spending can influence inflation dynamics, especially in sectors heavily dependent on consumer demand.

“This move by OPEC+ will, of course, be considered by central banks when formulating monetary policy.

“If rising oil prices are expected to have a sustained impact on inflation, central banks can be expected to maintain higher interest rates for longer to control soaring prices.”

The deVere Group founder concludes: “The decision by the group of oil producing countries will further exacerbate the cost-of-living and cost-of-business crisis as inflation is given another global boost.”

About:

deVere Group is one of the world’s largest independent advisors of specialist global financial solutions to international, local mass affluent, and high-net-worth clients.  It has a network of offices across the world, over 80,000 clients and $12bn under advisement.