Dr. Dan Steinbock
In just days, President Trump has caused a meltdown in world markets and undermined global recovery, as he did in 2017. But now his economic weapons are far more destructive, as evidenced by the three rounds of the tariff wars.
The first round of Trump tariffs, which still built on traditional trade wars, involved mainly Canada, Mexico and China. The second round began with “reciprocal tariffs”, which are unilateral, flawed as stated and wrongly calculated. This round covers most trading economies worldwide. But the trade wars will drastically escalate by Trump’s threat of additional 50% tariff against China.
If the first round was dumb, the second was dumber, and the third is most certainly the dumbest. The first round was dumb because it was unwarranted and driven by geopolitics, not economics. The second round was dumber because it was based on flawed formula which has no basis in either economic theory or trade law. Worse, thanks to erroneous calculation, it over-inflated the tariff impact by up to a factor of four, as demonstrated by the American Enterprise Institute (AEI).
Even if the Trump “reciprocal tariffs” were to be taken seriously, which would be a cardinal mistake, the tariff against Vietnam should be 12%, not 46%; against China, 10% not 34%; against the EU, 10% not 20%, and so on (see Figure).
Figure: President Trump’s “Reciprocal Tariffs”: Actual and Corrected
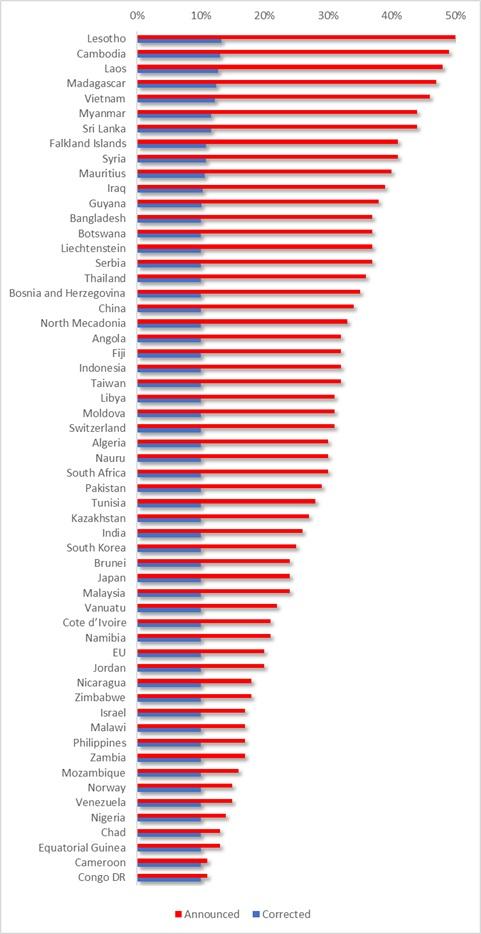
Source: AEI; author
The third round is the dumbest because it builds on unwarranted tariffs, flawed reciprocal tariffs calculated erroneously and, finally, still new tariffs that have more in common with economic blackmail than international cooperation.
President Trump mistakes “medicine” with poison and “negotiations” with paying tribute.
The pre-104% tariff impact on China
What is the impact on China of the accumulative tariffs regarding China (now tariffs above 60%) and the elimination of duty-free for de minimis?
The direct impact of the current US tariffs could shave off up to 1.0% to 1.2% from China’s GDP. This is at par or 20% higher than the initially expected impact. However, it is not the actual impact of the US tariffs.
During Trump’s first term, the tariff war targeted primarily China and a few other trading economies. Now it targets most if not all non-US economies. To a degree, this will reduce the adverse impact on China. Moreover, China is prepared to cushion the US tariff impact in part by fiscal stimulus, monetary easing and structural reforms.
For all practical purposes, the US administration’s decision to eliminate duty-free de minimis treatment for low-value imports seeks to undermine Chinese global low value e-commerce platforms. Yet, these players, including Shein and Temu, are already working with more US sellers and opening warehouses in America.
But the move will prove costly to those Americans who are most reliant on affordable prices. It will hit the hardest American small businesses, the shrinking US and lower-middle-class and particularly working Americans and the laboring poor.
Toward a “global economic pandemic”
How would you evaluate the Chinese retaliation decisions?
Last week, the Trump administration imposed a 34% tariff on Chinese goods, following the 20% rate imposed earlier in the year. Two days later, China imposed a 34% tariff on all U.S. imports. It is a part of China’s full retaliatory package, which includes a 15% tariff on certain US agricultural commodities and 10% on others in March. Additionally, China added 16 US entities to its export control list and another 11 firms into its unreliable entity list, plus import restrictions on rare-earth products.
Relative to the Trump administration’s overblown “reciprocal tariff” measures, China’s responses have been measured, coordinated and broad. The Trump administration has now opened the Pandora’s Box of wholesale decoupling of the world’s two largest economies. That will penalize US consumer, business and investor confidence more than initially anticipated. In the process, the probability of an impending US contraction is likely to increase substantially.
If President Trump will carry out his threat to raise the tariff on Chinese goods by an additional 50%, global economic prospects may face a new kind of global pandemic.
Death of outsourcing?
What about the extreme tariffs regarding Vietnam, Laos, Malaysia and Cambodia. Is this the end of the outsourcing model?
With the Trump administration’s uncertainty and weaponization of tariffs, it is premature to presume any final trajectories. The Trump administration is targeting Cambodia with 49%, Laos with 48%, Vietnam with 46% and Malaysia with 24% tariffs. Calculated right, these tariffs should be 13% to Cambodia, 13% to Laos, 12% to Vietnam and 10% to Malaysia. But Trump tariffs are devoid of economic rationality.
India was taken back by the US’s 26% reciprocal tariff, which exceeds the current tariff gap by more than 2.5 times. But Indian policymakers seek to avoid retaliation, hoping first to gain a bilateral trade agreement with the US and then lower the effective tariff rate.
The message is loud and clear: Those countries that are most exposed to the United States are now the most vulnerable to inflated, illicit and erratic trade measures.
The dissipation of almost $7 trillion in the US markets in just two days is a prelude to more extensive market losses and volatility. Such losses will translate to a broad and deeply adverse impact on the real economy.
How will Southeast Asia respond?
Why aren’t Southeast Asian states retaliating?
The simple answer: By staying united. On Monday, Malaysian Prime Minister Anwar Ibrahim called for Southeast Asian countries to “stand firm together” after they were among the hardest hit by US tariffs. These words matter since Malaysia is this year’s rotating chair of the 10-member Association of Southeast Asian Nations (ASEAN). As Anwar put it, “We must stand firm together as ASEAN, with a population of 640 million and an economic strength that is among the top in the world.”
But Southeast Asia is very diverse. Exporters like Vietnam, Cambodia and Laos, even Thailand and Malaysia are taking disproportionate hits. More insular, large commodity producers like Indonesia are no longer immune. Advanced tiny states such as Singapore seek to hedge bets with cautious balancing. In the Philippines, the pro-US Marcos Jr dreams of trade exemptions, in exchange for geopolitical concessions.
For now, ASEAN nations are trying to avoid tit-a-tat tariffs against the US. But if US tariffs prevail and escalate, this stance will be harder to retain. Worldwide, US trade wars will reinforce regionalization; no longer globalization.
Would East Asian MNCs opt for “Americanization”?
Do you think the big Japanese, Taiwanese and South Korean multinationals will delocalize for US soil?
A full-scale “Americanization” of East Asian multinationals (MNCs) would make these companies even more exposed to future US tariff and non-tariff measures, which is very much not in the interest of these companies and the sovereign countries in which they are headquartered.
As the Taiwanese semiconductor giants have seen in the past few years, full localization in the US could undermine their technological competitiveness – which is precisely why President Trump and his trade authorities seek to localize those MNCs in America.
These East Asian MNCs are all US’s major non-NATO allies. So, when the Trump administration imposed 32% tariffs on Taiwan, 25% on South Korea and 24% on Japan, it came as a major surprise to each. And the timing is challenging. In Taiwan, domestic divides are on the rise. South Korea is heading to election amid a lingering constitutional crisis. Japan is struggling to keep its economic focus.
In the past, US military allies were seen as preferred trade partners and vice versa. That era is now gone. The ongoing trade wars are multidimensional. But so will be the responses.
Toward global contraction?
How do you see the next chapter of ongoing trade war between Trump and his adversaries?
If President Trump will carry out his threat to raise the tariff on Chinese goods by an additional 50%, China will retaliate accordingly.
The Trump administration is not imposing tariffs. It seeks to charge economic rents it is not entitled to.
From the Chinese perspective, the Trump tariffs have little or nothing to do with economics, which most international economists would agree with. They regard those tariffs as blackmail and bullying, at the expense of the Global South.
Left unchallenged, the Trump tariffs will leave global economic integration unraveling.
About the Author:
Dr. Dan Steinbock is an internationally recognized strategist of the multipolar world and the founder of Difference Group. He has served at the India, China and America Institute (US), Shanghai Institutes for International Studies (China) and the EU Center (Singapore). For more, see https://www.differencegroup.net