
By Analytical Department RoboForex
Gold prices rose to 4,472 USD per troy ounce on Thursday. Despite the modest rebound, the precious metal is still attempting to recover from a weekly decline of nearly 2%.
Pressure on gold continues to build as expectations grow that major central banks, including the Federal Reserve, may need to maintain tighter monetary policy to combat inflation. Much of this concern stems from the recent surge in energy prices.
An additional negative factor has been the renewed escalation of tensions in the Middle East. Prospects for a near-term agreement between the US and Iran have deteriorated significantly following a fresh exchange of strikes between the two sides. Bahrain and Kuwait have also become involved in the conflict, marking the most serious escalation since the ceasefire was introduced in early April.
Ongoing tensions and de facto restrictions on shipping through the Strait of Hormuz are keeping oil prices elevated, increasing inflation risks and reinforcing expectations that interest rates will remain higher for longer.
Further support for this view came from comments made by Cleveland Federal Reserve Bank President Beth Hammack. According to Hammack, the Fed may be forced to raise interest rates again if inflationary pressures continue to intensify.
Free Reports:
 Sign Up for Our Stock Market Newsletter – Get updated on News, Charts & Rankings of Public Companies when you join our Stocks Newsletter
 Get our Weekly Commitment of Traders Reports - See where the biggest traders (Hedge Funds and Commercial Hedgers) are positioned in the futures markets on a weekly basis.
Investor attention is now firmly focused on Friday’s Non-Farm Payrolls report. US labour market data could significantly influence expectations regarding future Federal Reserve policy and, consequently, the outlook for gold.
Technical Analysis
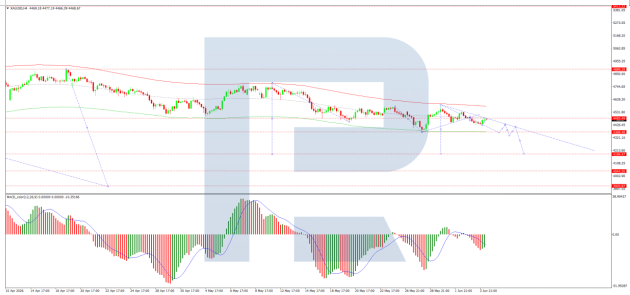
On the H4 XAU/USD chart, the market is trading within a consolidation range around the 4,478 USD level after a retest from below. A move lower towards 4,360 USD is expected, followed by a corrective rebound towards 4,420 USD. After that, the market may resume its decline towards 4,238 USD, with scope for a further move to 4,180 USD. The MACD indicator confirms the current bearish momentum, with the signal line below the centre line and pointing firmly downwards.
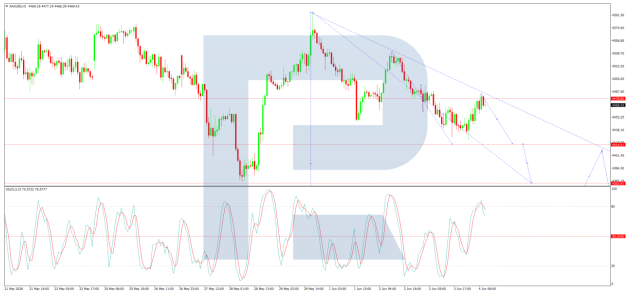
On the H1 chart, the market has broken below the 4,478 USD level and moved lower towards 4,422 USD. A corrective rebound towards 4,478 USD as a retest from below remains possible before another decline towards 4,250 USD. A subsequent recovery towards 4,390 USD may follow. The Stochastic oscillator supports this scenario, with the signal line below the 80 level and pointing downwards towards 20, indicating persistent downside pressure.
Conclusion
Gold remains vulnerable to further losses as elevated energy prices, geopolitical tensions, and expectations of tighter monetary policy continue to weigh on sentiment. However, short-term corrective rebounds remain possible, particularly as investors await key US labour market data that could reshape expectations for the Federal Reserve.
Disclaimer
Any forecasts contained herein are based on the author’s particular opinion. This analysis may not be treated as trading advice. RoboForex bears no responsibility for trading results based on trading recommendations and reviews contained herein.

- COT Metals Charts: Weekly Speculator Bets led by Copper & Steel Jul 18, 2026
- COT Bonds Charts: Weekly Speculator Bets led by 2-Year, SOFR 3M & 5-Year Bonds Jul 18, 2026
- COT Energy Charts: Weekly Speculator Bets led by Brent Oil & Heating Oil Jul 18, 2026
- COT Soft Commodities Charts: Weekly Speculator Bets led by Wheat, Corn & Soybean Meal Jul 18, 2026
- The Bank of Canada kept its interest rate unchanged. Platinum prices reached a three‑week high Jul 16, 2026
- Stock indices rose after the release of US inflation data. China’s GDP slowed sharply Jul 15, 2026
- GBP/USD Awaits Political News: What Will Happen Next Jul 15, 2026
- USD/JPY Holds at Highs: Pressure Lingers on Yen Jul 14, 2026
- Oil prices jumped 4% amid a new wave of escalation between the US and Iran Jul 13, 2026
- EUR/USD: US Inflation Will Determine Everything Jul 13, 2026