
By RoboForex Analytical Department
The USD/JPY pair surged to 149.58 on Wednesday, marking its fourth consecutive day of gains as the Japanese yen extended its decline. The Bank of Japan’s (BoJ) latest policy decision failed to inspire confidence, leaving investors underwhelmed and further weakening the yen.
Key factors driving USD/JPY movement
As expected, the Bank of Japan maintained its benchmark interest rate at 0.5% while reiterating its forecast that the Japanese economy will grow above its potential level. However, the central bank also acknowledged emerging signs of economic fragility, adopting a cautious tone in its outlook. Policymakers emphasised the need to gather and analyse more data before making significant moves, particularly in light of global economic risks.
A key concern is the potential impact of US tariff hikes, which could weigh heavily on Japan’s export-driven economy. Investors are now closely monitoring comments from BoJ Governor Kazuo Ueda for further insights into the central bank’s strategy and future policy direction.
Recent data has painted a mixed picture of Japan’s economic health. The monthly Reuters Tankan survey revealed growing pessimism among Japanese manufacturers in March, citing concerns over US trade policies and China’s slowing economy. On a brighter note, Japan’s trade balance shifted to a surplus in February, driven by robust export growth. However, this improvement has done little to strengthen the yen amid broader market concerns.
Free Reports:
 Sign Up for Our Stock Market Newsletter – Get updated on News, Charts & Rankings of Public Companies when you join our Stocks Newsletter
 Get our Weekly Commitment of Traders Reports - See where the biggest traders (Hedge Funds and Commercial Hedgers) are positioned in the futures markets on a weekly basis.
Technical analysis of USD/JPY
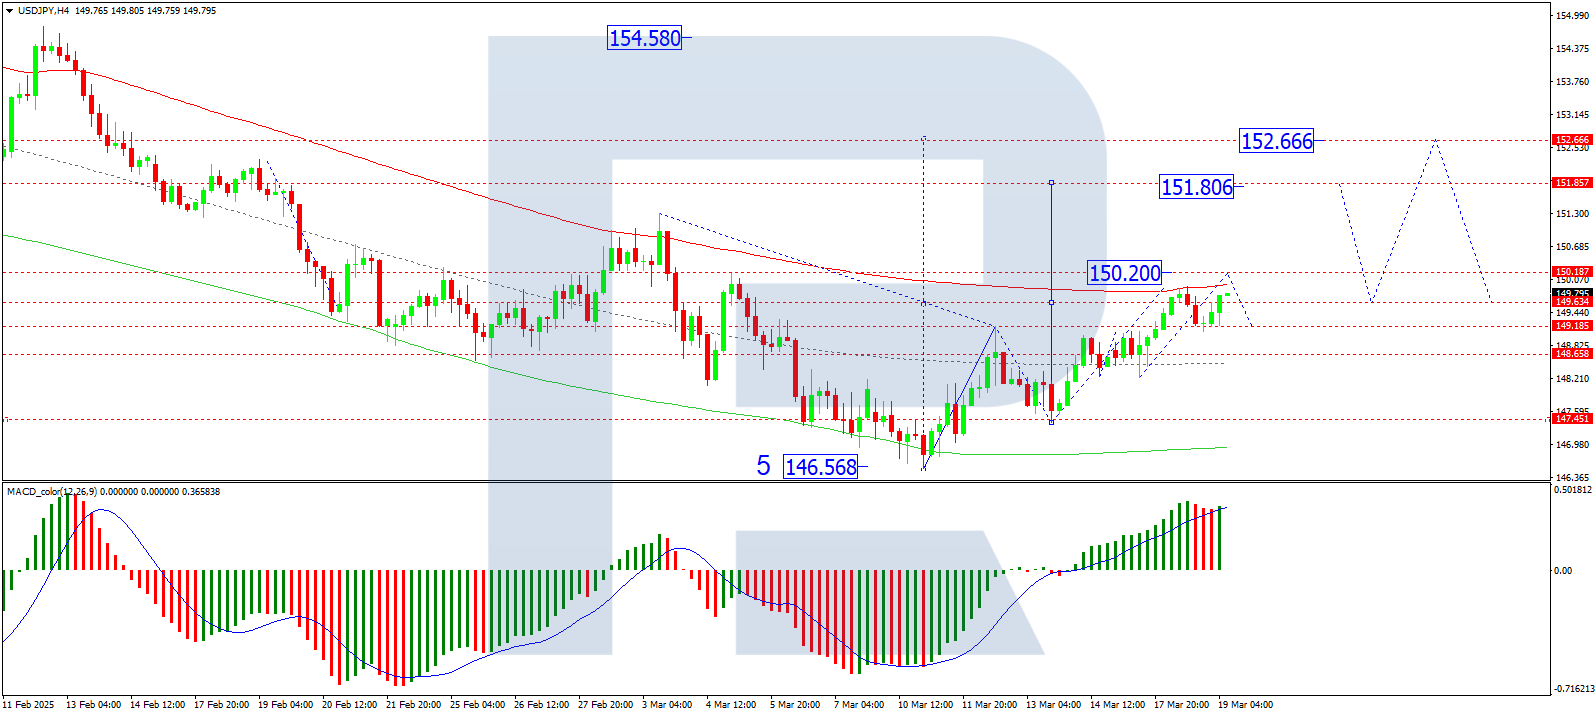
On the H4 chart, USD/JPY is forming a bullish wave structure, targeting 150.20. Upon reaching this level, a corrective pullback to 149.20 is possible, likely establishing a consolidation range near the current highs. A breakout above this range could signal further upward momentum, with the next target at 151.80. This scenario is supported by the MACD indicator, with its signal line remaining above zero and trending upwards.
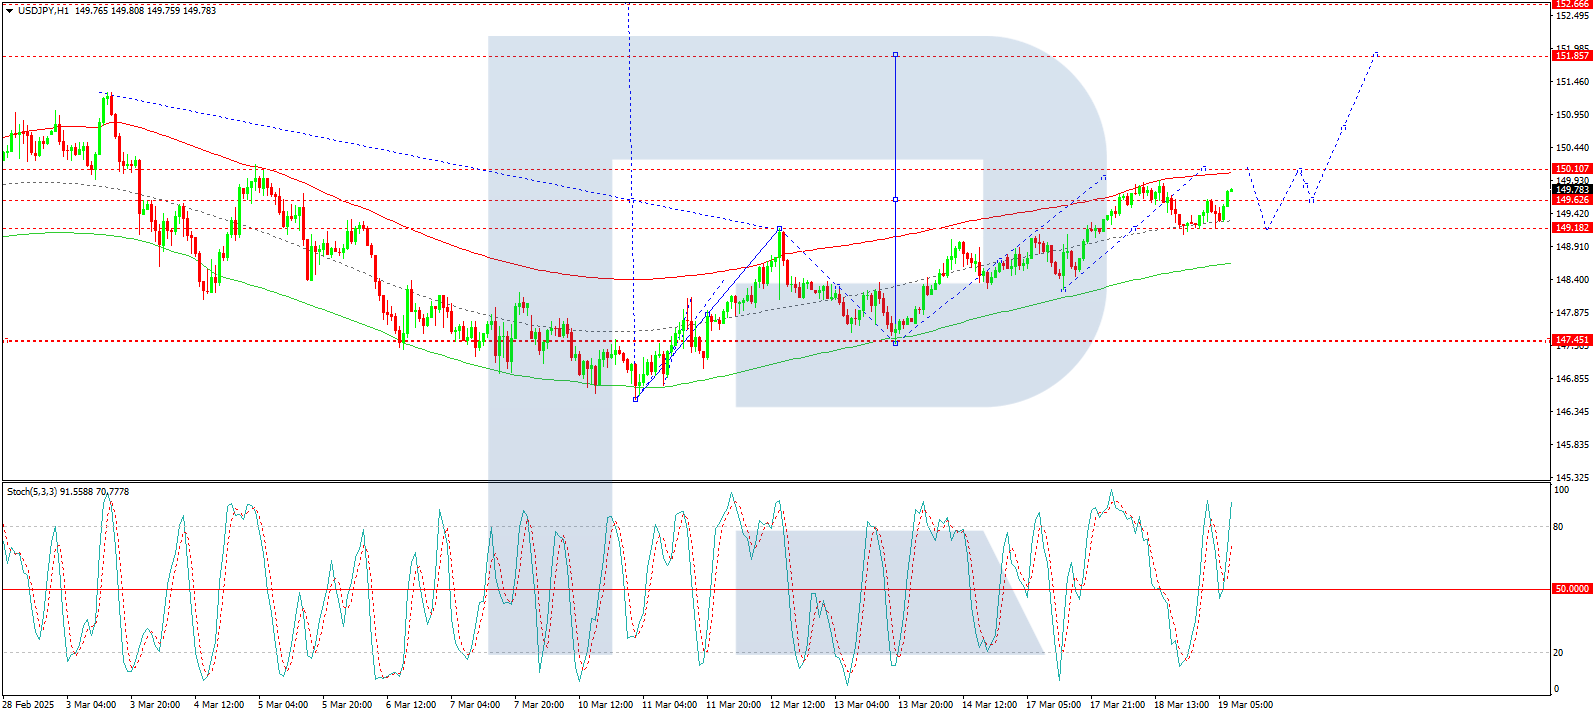
The H1 chart shows USD/JPY developing a growth wave toward 150.20, representing the midpoint of the third wave in the current structure. A consolidation range is expected to form around 149.62, with an upward breakout potentially opening the path to 151.80. The Stochastic oscillator corroborates this outlook, with its signal line above 50 pointing upward.
Conclusion
The Japanese yen’s decline reflects market disappointment with the Bank of Japan’s cautious stance and lack of decisive action. While Japan’s trade balance has shown improvement, concerns over global economic risks and domestic manufacturing sentiment continue to weigh on the currency. From a technical perspective, USD/JPY remains in a bullish trend, with key resistance levels at 150.20 and 151.80. Traders should monitor BoJ Governor Ueda’s statements and upcoming economic data for further clues on the yen’s trajectory.
Disclaimer
Any forecasts contained herein are based on the author’s particular opinion. This analysis may not be treated as trading advice. RoboForex bears no responsibility for trading results based on trading recommendations and reviews contained herein.

- The Eurozone has shown a significant slowdown in inflation. Australia has recorded its largest trade deficit since 2015 Jul 2, 2026
- Natural gas prices are rising amid increasing electricity consumption Jul 1, 2026
- USD/JPY at 40-Year High: Multiple Factors Weigh on the Yen Jul 1, 2026
- Gold Declines: Fed Policy and Geopolitics Weigh Jun 30, 2026
- Oil prices have once again risen above 70 dollars per barrel. The Australian dollar has updated a three‑month low Jun 30, 2026
- EUR/USD: The Advantage Remains with the Dollar Jun 29, 2026
- Escalation of the US–Iran conflict is once again supporting the rise in oil prices Jun 29, 2026
- Oil prices fall back to pre‑war levels. Silver drops to a 7‑month low Jun 25, 2026
- Gold Falls to an Eight-Month Low: This May Not Be the Bottom Jun 25, 2026
- Stock indices came under heavy selling pressure amid growing skepticism about AI investments Jun 24, 2026
