
By InvestMacro Research
The first quarter of 2025 is underway and we wanted to highlight some of the top companies that have been added to our Cosmic Rays Watchlist in the past week. The Cosmic Rays Watchlist is the output from our proprietary fundamental analysis algorithm.
The algo examines company fundamental metrics, earnings trends and overall sector strength trends. The aim is identify quality dividend-paying companies on the NYSE and Nasdaq stock exchanges. If a company scores over 50, it gets added to our Watchlist for further analysis.
We use this system as a stock market ideas generator and to update our Watchlist every quarter. However, be aware the fundamental system does not take the stock price as a direct element in our rating so one must compare each idea with their current stock prices (this is not a timing tool).
Many studies are consistently showing overvalued markets and that has to be taken into consideration with any stock market idea.
Free Reports:
 Get our Weekly Commitment of Traders Reports - See where the biggest traders (Hedge Funds and Commercial Hedgers) are positioned in the futures markets on a weekly basis.
 Sign Up for Our Stock Market Newsletter – Get updated on News, Charts & Rankings of Public Companies when you join our Stocks Newsletter
As with all investment ideas, past performance does not guarantee future results. A stock added to our list is not a recommendation to buy or sell the security.
Here we go with 5 of our Top Stocks scored in Q1 2025:
The Hartford Financial Services Group, Inc. (HIG):
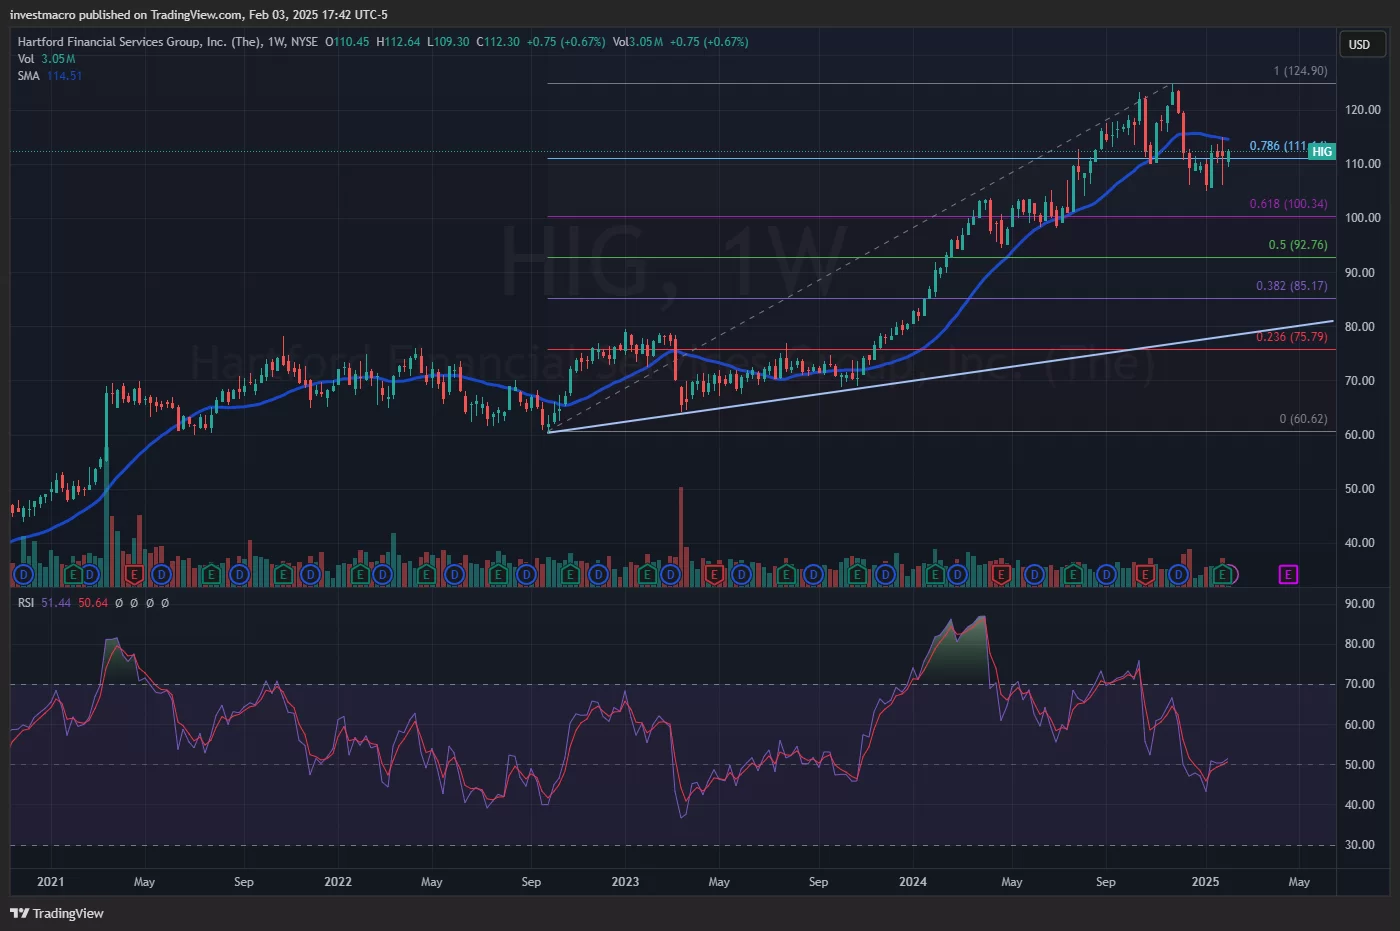
The Hartford Financial Services Group, Inc. (Symbol: HIG) was recently added to our Cosmic Rays WatchList. HIG scored a 66 in our fundamental rating system on February 3rd.
At time of writing, only 4.67% of stocks have scored a 60 or better out of a total of 11,112 scores in our earnings database. HIG has been a staple on our list, making the Watchlist a total of 7 times and the company’s score rose by 1 point from our last update. HIG is a Large Cap stock and part of the Financial Services sector. The industry focus for HIG is Insurance – Diversified.
HIG has beat earnings-per-share expectations two out of the past three quarters and has a dividend of close to 1.85 percent with a payout ratio near 20 percent. The HIG stock price has slightly under-performed the Financial Sector benchmark over the past 52 weeks with a 27.61 percent rise compared to the 31.35 benchmark return.
Company Description (courtesy of SEC.gov):
The Hartford Financial Services Group, Inc. provides insurance and financial services to individual and business customers in the United States, the United Kingdom, and internationally.
Company Website: https://www.thehartford.com
Asset vs Sector Benchmark: *P/E Ratio (TTM) *52-Week Price Return *Beta (S&P500) – Stock: The Hartford Financial Services Group, Inc. (HIG) 10.9 27.61 0.94 – Benchmark Symbol: XLF 18.1 31.35 1.0
* Data through February 03, 2025
Northrop Grumman Corporation (NOC):
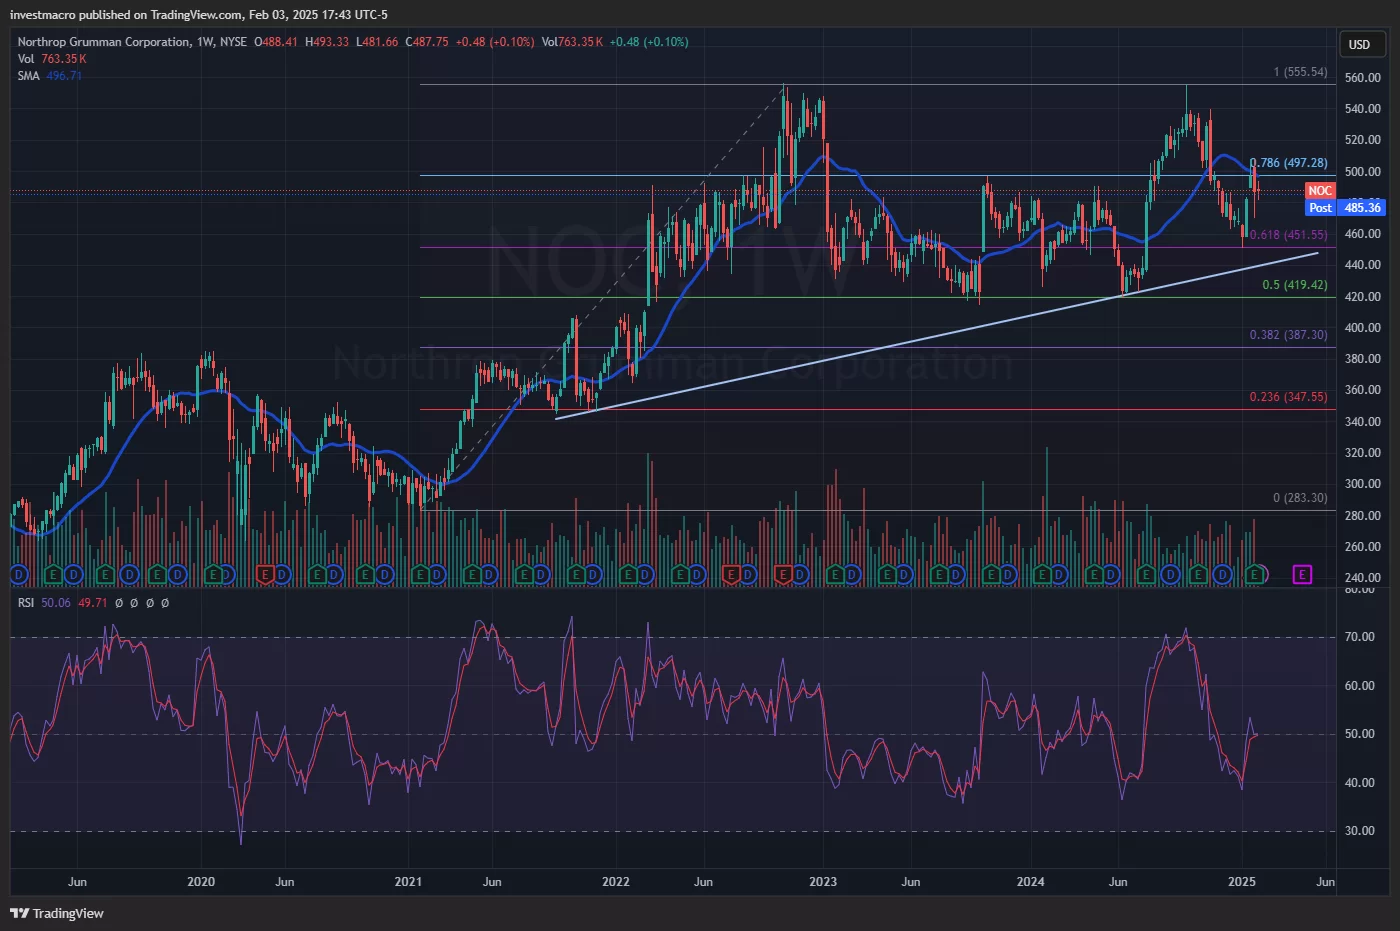
Northrop Grumman Corporation (Symbol: NOC) was recently added to our Cosmic Rays WatchList. NOC scored a 58 in our fundamental rating system on February 3rd.
At time of writing, only 8.03% of stocks have scored a 50 or better out of a total of 11,112 scores in our earnings database. This stock has made our Watchlist a total of 2 times and jumped by 113 system points from our last update. NOC is a Large Cap stock and part of the Industrials sector. The industry focus for NOC is Aerospace & Defense.
NOC has beat the earnings-per-share expectations in the past four quarters. Northrop’s dividend is currently at 1.68 percent and has a payout ratio around 30 percent at time of writing. The stock price has under-performed the Industrials Sector benchmark over the past 52 weeks with a 11.27 percent gain compared to the 21.27 benchmark return.
Company Description (courtesy of SEC.gov):
Northrop Grumman Corporation operates as an aerospace and defense company worldwide. The company’s Aeronautics Systems segment designs, develops, manufactures, integrates, and sustains aircraft systems.
Company Website: https://www.northropgrumman.com
Asset vs Sector Benchmark: *P/E Ratio (TTM) *52-Week Price Return *Beta (S&P500) – Stock: Northrop Grumman Corporation (NOC) 17.2 11.27 0.35 – Benchmark Symbol: XLI 26.1 21.27 1.1
* Data through February 03, 2025
Teradyne, Inc. (TER):
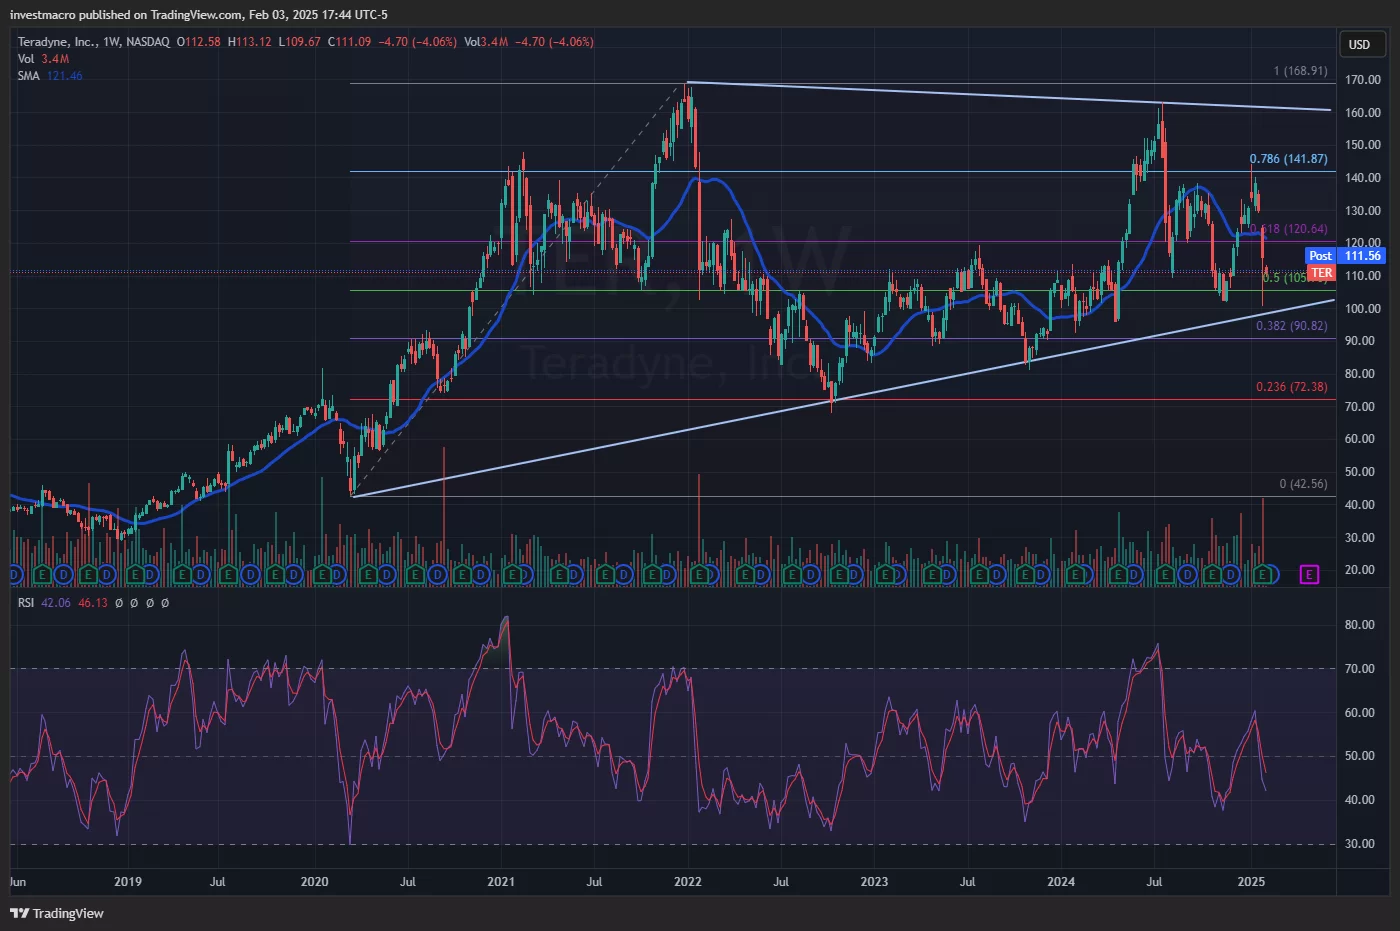
Teradyne, Inc. (Symbol: TER) was recently added to our Cosmic Rays WatchList. TER scored a 50 in our fundamental rating system on January 31st.
At time of writing, only 8.03% of stocks have scored a 50 or better out of a total of 11,112 scores in our earnings database. This stock has never been on our Watchlist previously and rose by 76 system points from our last update. TER is a Large Cap stock and part of the Technology sector. The industry focus for TER is Semiconductors.
Teradyne has beat the earnings-per-share expectations in each of the past four quarters. TER’s dividend is currently a modest 0.43 percent and has a payout ratio of around just 14 percent at time of writing. The stock price has under-performed the Technology Sector benchmark over the past 52 weeks with a 10.71 percent gain compared to the 14.25 benchmark return.
Company Description (courtesy of SEC.gov):
Teradyne, Inc. designs, develops, manufactures, sells, and supports automatic test equipment worldwide. The company operates through Semiconductor Test, System Test, Industrial Automation, and Wireless Test segments.
Company Website: https://www.teradyne.com
Asset vs Sector Benchmark: *P/E Ratio (TTM) *52-Week Price Return *Beta (S&P500) – Stock: Teradyne, Inc. (TER) 33.5 10.71 1.52 – Benchmark Symbol: XLK 36.9 14.25 1.2
* Data through February 03, 2025
Synchrony Financial (SYF):
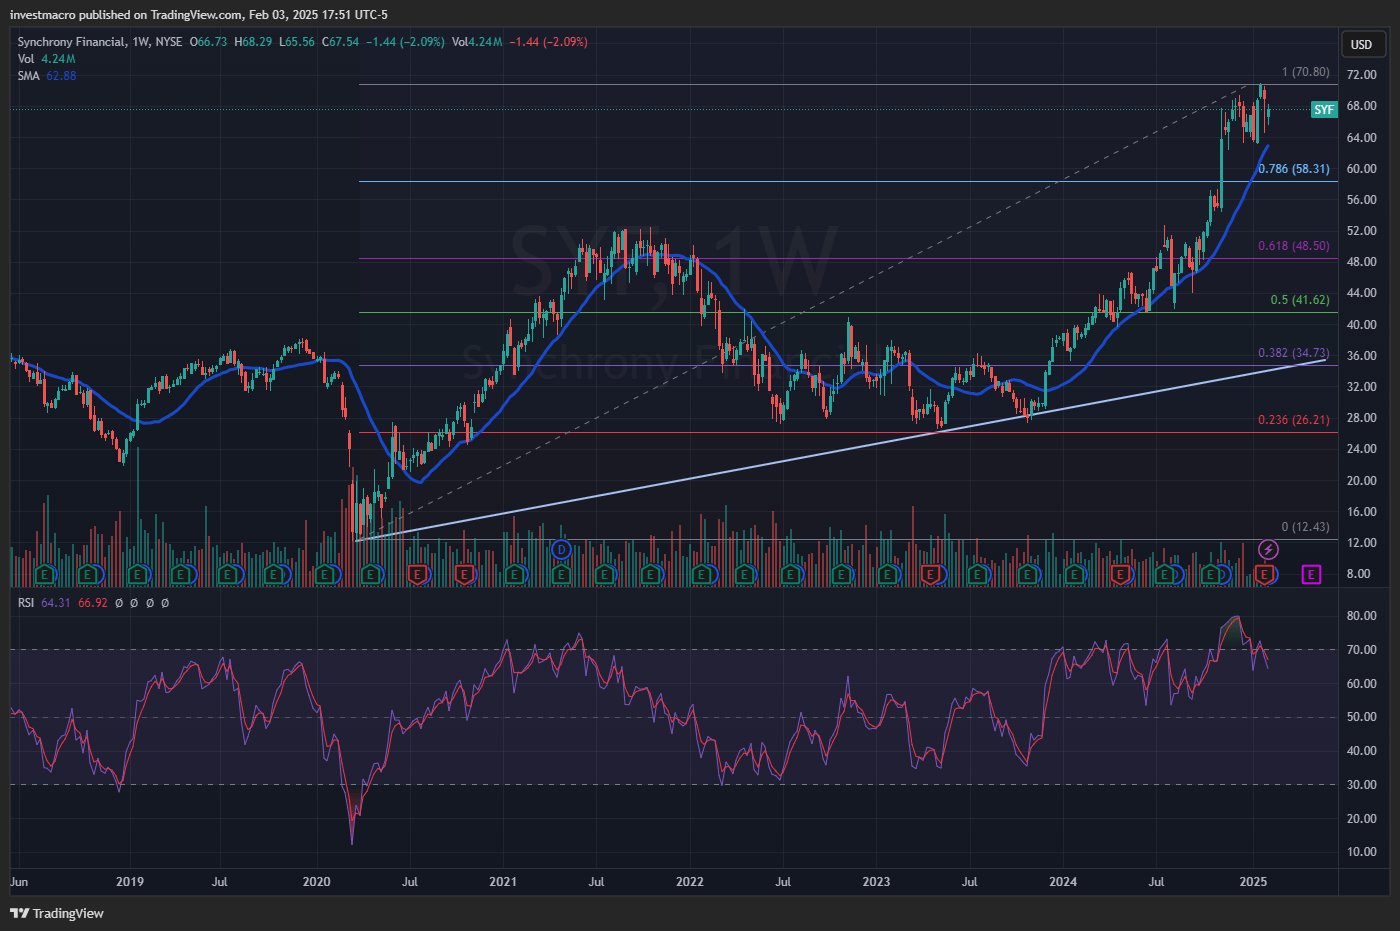
Synchrony Financial (Symbol: SYF) was recently added to our Cosmic Rays WatchList. SYF scored a 68 in our fundamental rating system on January 30th.
At time of writing, only 4.67% of stocks have scored a 60 or better out of a total of 11,112 scores in our earnings database. This stock has been on our Watchlist a total of 7 times and rose by 6 system points from our last update. SYF is a Large Cap stock and part of the Financial Services sector. The industry focus for SYF is Financial – Credit Services.
SYF missed their earnings-per-share expectations this quarter after beating expectations in the previous three quarters. Synchrony’s dividend is currently at approximately 1.50 percent and has a payout ratio of around just 12 percent at time of writing. The stock price has outperformed the Financial Sector benchmark over the past 52 weeks with a whopping 74.13 percent gain compared to the 31.35 percent benchmark return. SYF is currently trading near the top of its range with a recent overbought level on the weekly relative strength index (RSI).
Company Description (courtesy of SEC.gov):
Synchrony Financial, together with its subsidiaries, operates as a consumer financial services company in the United States. It provides credit products, such as credit cards, commercial credit products, and consumer installment loans.
Company Website: https://www.synchrony.com
Asset vs Sector Benchmark: *P/E Ratio (TTM) *52-Week Price Return *Beta (S&P500) – Stock: Synchrony Financial (SYF) 7.9 74.13 1.59 – Benchmark Symbol: XLF 18.1 31.35 1.0
* Data through February 03, 2025
Logitech International S.A. (LOGI):
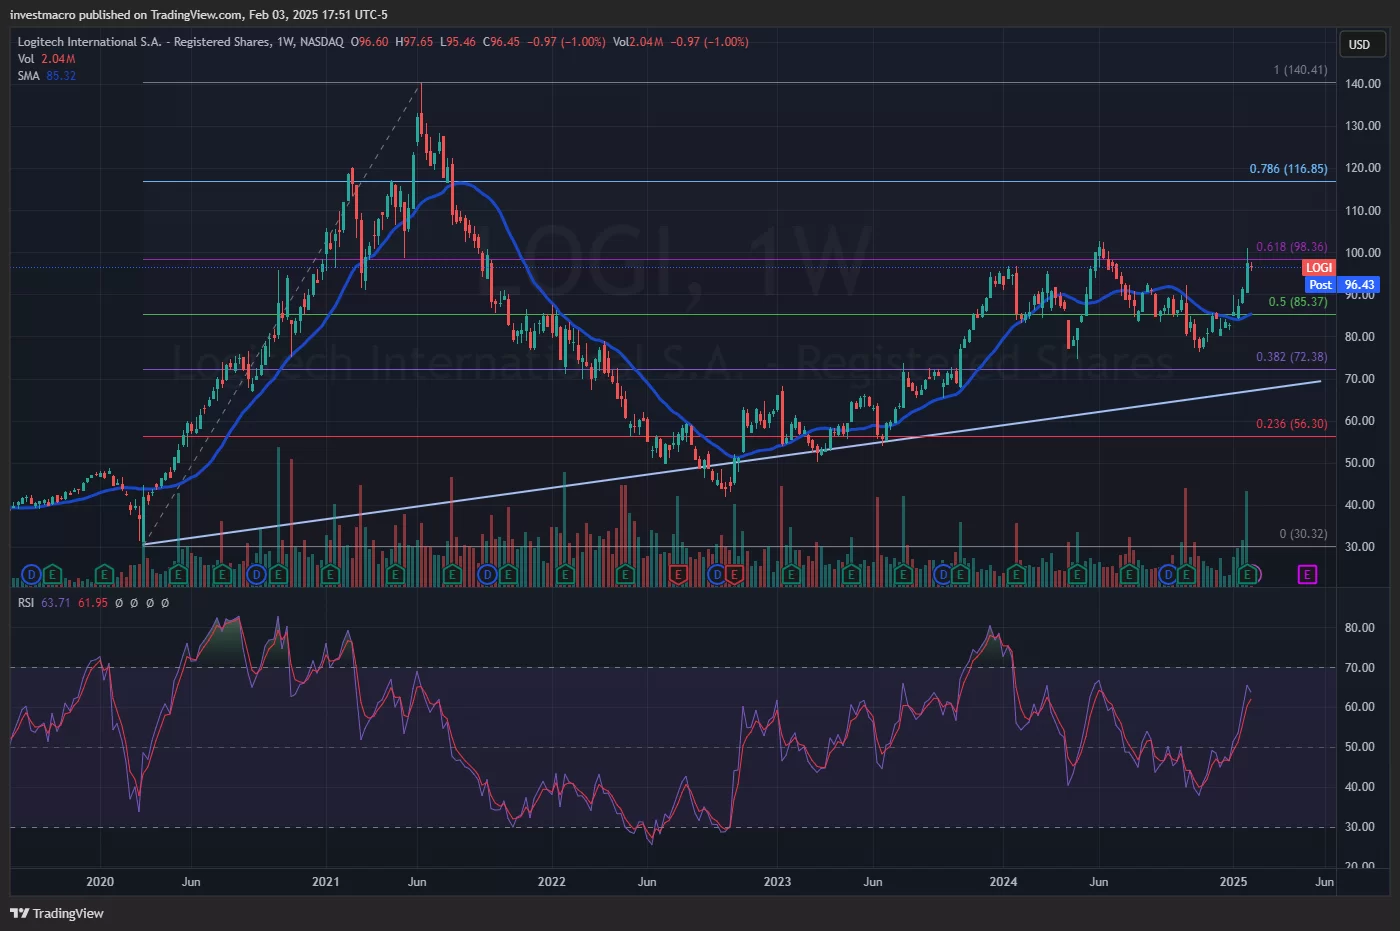
Logitech International S.A. (Symbol: LOGI) was recently added to our Cosmic Rays WatchList. LOGI scored a 65 in our fundamental rating system on January 30th.
At time of writing, only 4.67% of stocks have scored a 60 or better out of a total of 11,112 scores in our earnings database. This stock has made our Watchlist a total of 3 times and rose by 48 system points from our last update. LOGI is a Large Cap stock and part of the Technology sector. The industry focus for LOGI is Computer Hardware.
Logitech has beaten the earnings-per-share expectations for each of the past four quarters and has a dividend of close to 1.40 percent with a payout ratio currently near 28 percent. The LOGI stock price has ever-so-slightly outperformed the Technology Sector benchmark over the past 52 weeks with a 15.37 percent rise compared to the 14.25 percent benchmark return.
Company Description (courtesy of SEC.gov):
Logitech International S.A., through its subsidiaries, designs, manufactures, and markets products that connect people to digital and cloud experiences worldwide. The company offers pointing devices, such as wireless mouse; corded and cordless keyboards, living room keyboards, and keyboard-and-mouse combinations; PC webcams; and keyboards for tablets and smartphones, as well as other accessories for mobile devices.
Company Website: https://www.logitech.com
Asset vs Sector Benchmark: *P/E Ratio (TTM) *52-Week Price Return *Beta (S&P500) – Stock: Logitech International S.A. (LOGI) 22.7 15.37 0.56 – Benchmark Symbol: XLK 36.9 14.25 1.2
* Data through February 03, 2025
By InvestMacro – Be sure to join our stock market newsletter to get our updates and to see more top companies we add to our stock watch list.
All information, stock ideas and opinions on this website are for general informational purposes only and do not constitute investment advice. Stock scores are a data driven process through company fundamentals and are not a recommendation to buy or sell a security. Company descriptions provided by sec.gov.

- GBP/USD at Month’s Lows: The Outlook Remains Weak Jul 29, 2026
- Crude oil falls below $80 per barrel. Australia sees inflation slowdown Jul 29, 2026
- The US Tech sector hit by sell‑off. Oil prices decline on renewed negotiations Jul 28, 2026
- Gold Declines, Focus on Fed and Falling Oil Prices Jul 28, 2026
- This week will be one of the most crowded for central‑bank meetings Jul 27, 2026
- EUR/USD Ahead of a Key Week: Holding Near Lows Jul 27, 2026
- COT Metals Charts: Weekly Speculator Changes led by Copper Jul 26, 2026
- COT Bonds Charts: Speculator Bets led by SOFR 3-Months & 5-Year Bonds Jul 26, 2026
- COT Energy Charts: Weekly Speculator Bets led by WTI Crude & Natural Gas Jul 26, 2026
- COT Soft Commodities Charts: Weekly Speculator Bets led by Corn & Soybeans Jul 26, 2026