
By RoboForex Analytical Department
The price of gold fell to $2370.00 per troy ounce by Thursday following the release of the minutes from the latest US Federal Reserve meeting. The general tone of the Fed’s policymakers was notably cautious, aligning with previous calls for a restrained approach to monetary policy.
The Fed indicated that more time is needed to be confident that US inflation is declining towards the 2% target. This cautious sentiment has tempered market expectations of imminent interest rate cuts. Previously, the market anticipated two rate cuts (in September and December); now, it expects no more than one. Consequently, the US interest rate is likely to remain at 5.5% per annum for an extended period before the Fed considers revising it.
Higher interest rates reduce the attractiveness of gold, which does not yield interest. This dynamic has contributed to the recent decline in gold prices.
Technical analysis of XAU/USD
Free Reports:
 Download Our Metatrader 4 Indicators – Put Our Free MetaTrader 4 Custom Indicators on your charts when you join our Weekly Newsletter
 Get our Weekly Commitment of Traders Reports - See where the biggest traders (Hedge Funds and Commercial Hedgers) are positioned in the futures markets on a weekly basis.
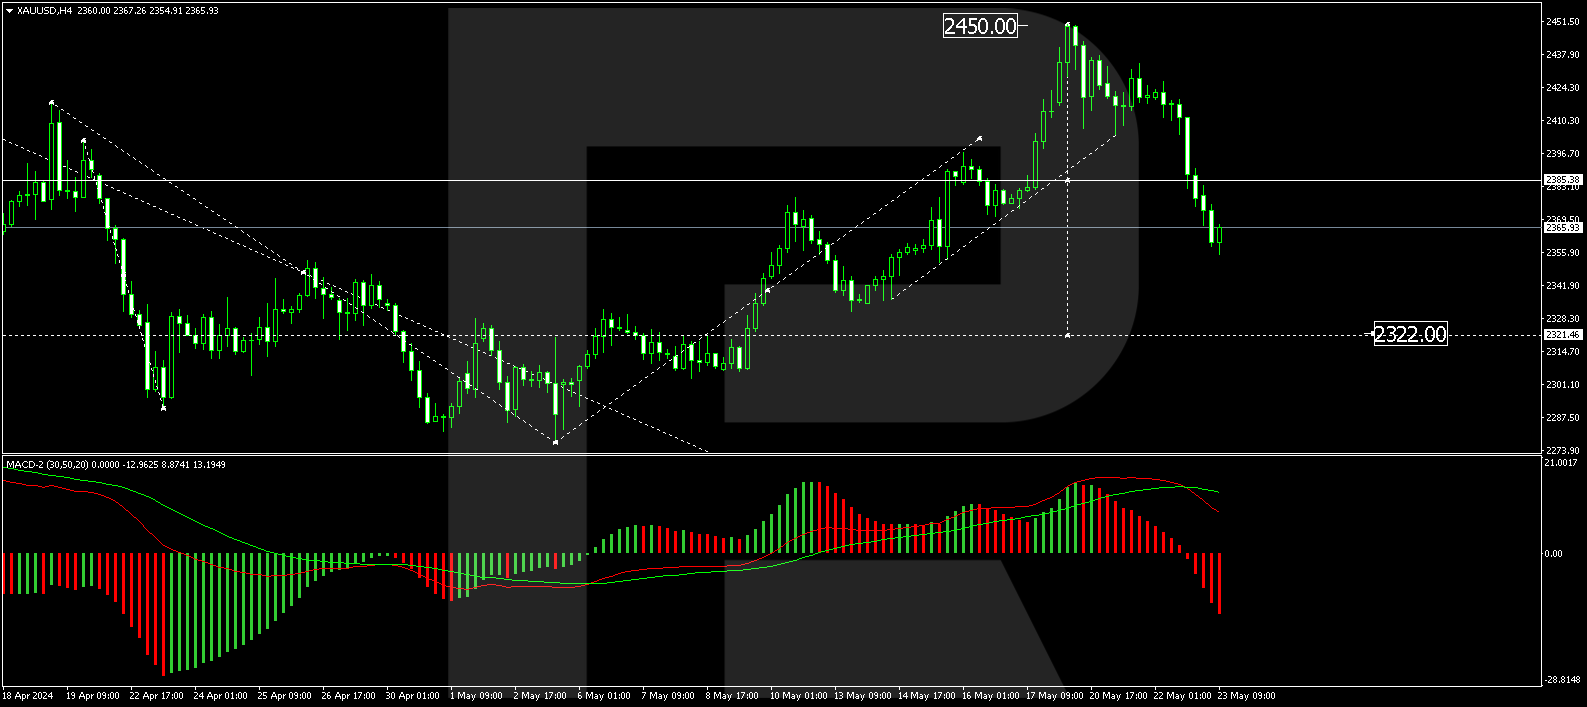
On the H4 chart, XAU/USD has formed a downward impulse to the level of 2404.40, followed by a correction to 2433.90. The limits of the consolidation range are now well-defined, and the market has recently broken out downwards. This breakout opens the potential for a further decline to 2322.00. After reaching this level, a rebound to 2385.35 is expected. This scenario is technically supported by the MACD indicator, with its signal line above zero but directed strictly downwards towards new lows.
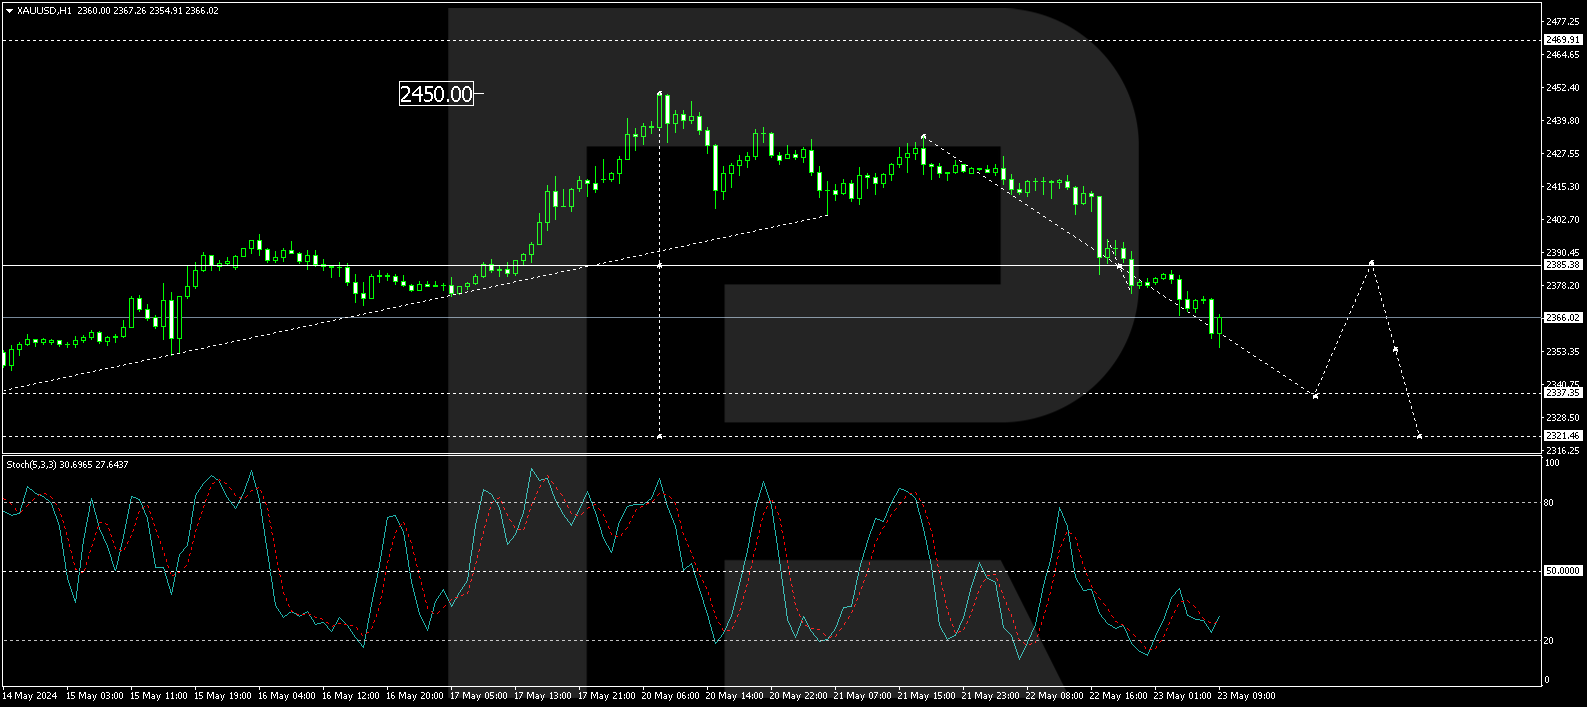
On the H1 chart, a decline to 2385.00 has been executed, followed by the formation of a consolidation range around this level. The market has recently broken out downwards from this range, opening the potential for a further decline to 2337.35, which is the local target. Following this, a correction back to 2385.00 (testing from below) is possible. Further decline towards 2321.45 may follow. This scenario is technically confirmed by the Stochastic oscillator, with its signal line above 20 and poised to rise to 50 before another potential decline to 20.
Summary
Gold prices have declined due to the Fed’s cautious stance on monetary policy and the expectation of prolonged high interest rates. Technical indicators suggest further potential declines, with possible corrective rebounds along the way. Investors should monitor these levels closely as market conditions evolve.
Disclaimer
Any forecasts contained herein are based on the author’s particular opinion. This analysis may not be treated as trading advice. RoboForex bears no responsibility for trading results based on trading recommendations and reviews contained herein.

- COT Metals Charts: Weekly Speculator Bets see small gains for Silver & Gold Jul 12, 2026
- COT Bonds Charts: Speculator Bets led by SOFR 3-Months & 2-Year Bonds Jul 12, 2026
- COT Energy Charts: Weekly Speculator Changes led by Brent Oil Jul 12, 2026
- COT Soft Commodities Charts: Weekly Speculator Changes led by Sugar, Corn & Soybeans Jul 12, 2026
- The US and European stock indices are rising again amid renewed investor interest in the AI industry. Jul 10, 2026
- USD/JPY Falls as Yen Recovers Weekly Losses Jul 10, 2026
- Crude oil prices surged sharply by 7% in reaction to the rapid escalation of the conflict in the Middle East Jul 9, 2026
- Middle East Tensions Weigh on Gold Jul 9, 2026
- Pound Awaits Tighter Policy from Bank of England Jul 8, 2026
- The United States carried out airstrikes on Iran after Iran’s attacked tankers in the Strait of Hormuz. The RBNZ raised the interest rate to 2.5% Jul 8, 2026
