
By RoboForex Analytical Department
As of Wednesday, the EUR/USD pair is hovering near 1.0925 after experiencing a volatile session, with expectations for a more subdued week ahead.
Recent statistical data highlighted higher-than-expected inflation in the US for February, prompting adjustments to predictions about the easing of monetary policy by the Federal Reserve in June.
The Consumer Price Index (CPI) rose by 0.4% month-on-month last month, aligning with expectations. Year-on-year, the indicator expanded to 3.2% from 3.1%. Core inflation in the US increased by 0.4% month-on-month, surpassing the forecast of 0.3%. From year to year, the indicator rose to 3.8% from the previous 3.7%.
While these figures did not come as a “surprise,” they reaffirmed that inflation is more persistent than previously thought. Specific details of the reports offer local hope for improvement, although it is clear overall that the situation could be more comfortable for the Fed to make significant decisions.
The market interpreted these developments favourably for the US dollar, shifting investor preferences towards it.
Free Reports:
 Get our Weekly Commitment of Traders Reports - See where the biggest traders (Hedge Funds and Commercial Hedgers) are positioned in the futures markets on a weekly basis.
 Download Our Metatrader 4 Indicators – Put Our Free MetaTrader 4 Custom Indicators on your charts when you join our Weekly Newsletter
Market focus is squarely on the Fed’s June meeting, with the March and May sessions attracting less interest. The Fed will likely require more statistical information by then.
As indicated by public data, investor expectations suggest a 69% chance of a rate cut in June, down from 71% earlier in the week.
In what would be the most optimistic forecast, the Fed will probably manage to cut rates only three times this year.
Technical Analysis of EUR/USD
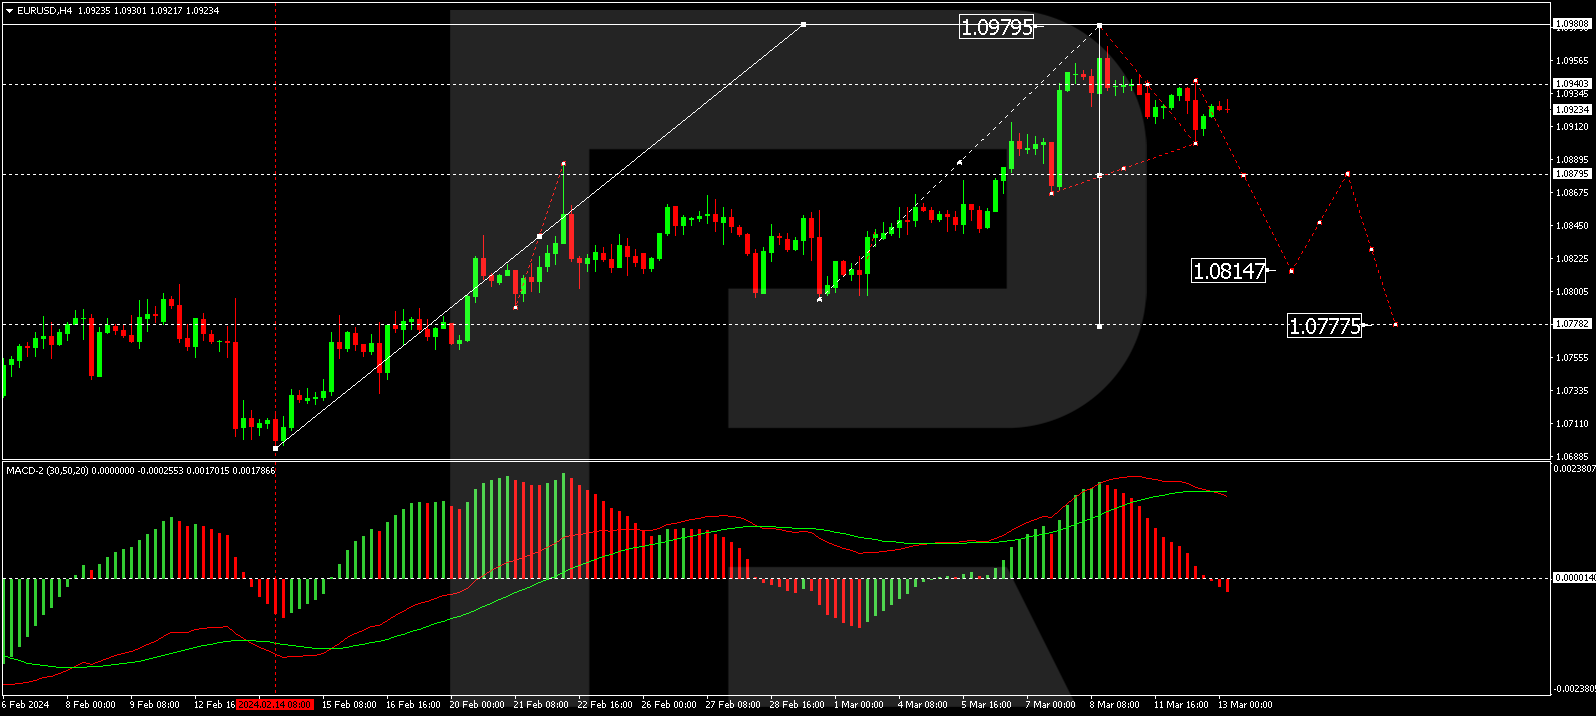
On the H4 chart, EUR/USD is forming the first wave of decline towards 1.0777. The first structure of this wave and its correction have been completed. Today, we will consider the likelihood of breaking the minimum of the first structure and continuing the development of the wave to the local target level of 1.0815. The MACD indicator confirms this scenario, with its signal line above zero and a sharply decreasing histogram, indicating the continuation of the downtrend.
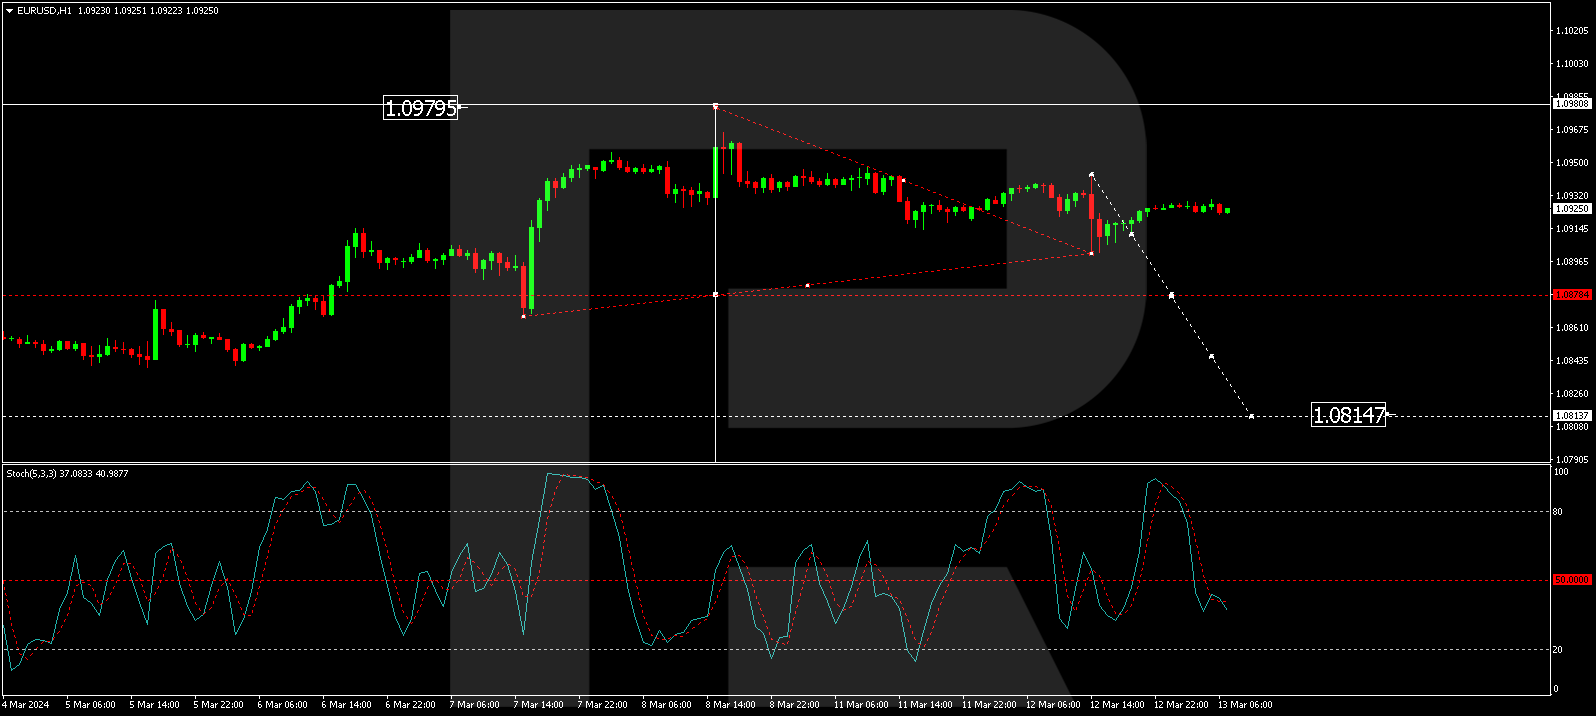
On the H1 chart, EUR/USD has formed the first wave of a decline structure to 1.0900 and a correction to 1.0939. The market has essentially delineated a consolidation range around the level of 1.0939. Today, a decline to the lower boundary of this range is expected. With a breach of 1.0900, a further decline to 1.0880 is anticipated, with the trend potentially continuing to 1.0815. The Stochastic oscillator confirms this scenario, with its signal line below the 50 mark, expecting a continuation of the decline towards 20.
Disclaimer
Any forecasts contained herein are based on the author’s particular opinion. This analysis may not be treated as trading advice. RoboForex bears no responsibility for trading results based on trading recommendations and reviews contained herein.

- Oil prices fall back to pre‑war levels. Silver drops to a 7‑month low Jun 25, 2026
- Gold Falls to an Eight-Month Low: This May Not Be the Bottom Jun 25, 2026
- Stock indices came under heavy selling pressure amid growing skepticism about AI investments Jun 24, 2026
- The Pound Is Pressured Not by Politics, but by a Strong US Dollar Jun 24, 2026
- Global crude oil prices continued to decline. The AUD/USD exchange rate hit an 11‑week low Jun 23, 2026
- EUR/USD Remains Under Sellers’ Control as the Dollar Stays Strong Jun 23, 2026
- Gold Falls for the Third Consecutive Week: Is There Still Upside Potential? Jun 22, 2026
- Bank Indonesia raised its interest rate. Norges Bank and the SNB left rates unchanged Jun 19, 2026
- EUR/USD Loses Ground as Market Sentiment Favours the US Dollar Jun 19, 2026
- GBPUSD Awaits Bank of England Meeting Near April Lows Jun 18, 2026