
By RoboForex Analytical Department
Gold prices are on a consecutive three-day rise, reaching $1930.00 per Troy ounce as of Monday. The upward trend seems to be fueled by investors seeking a hedge against uncertainties ahead of key events this week.
Investors are keenly awaiting the U.S. Federal Reserve’s decision, which is widely expected to maintain the interest rate at 5.5% per annum. The primary focus will likely be on the Fed’s outlook on the economy and inflation, which should provide valuable insights into the regulator’s future course of action.
Additionally, the Bank of England and the Bank of Japan are set to hold their meetings this week, while the Reserve Bank of Australia (RBA) will release the minutes from its previous meeting.
Another contributing factor to gold’s demand is the sudden depreciation in the yuan exchange rate, making the precious metal more attractive as a safe-haven asset.
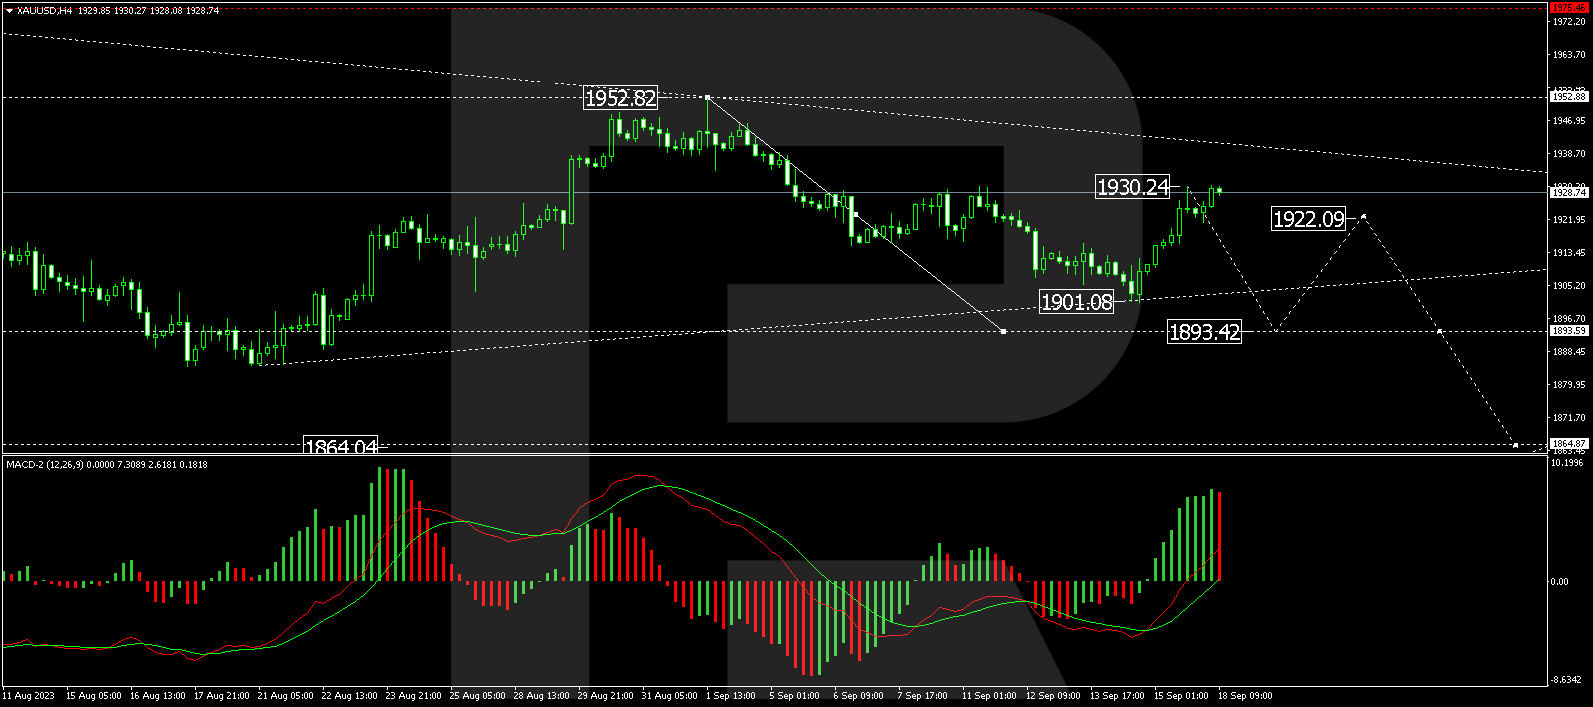
Technical Analysis of XAU/USD price chart
On the 4-hour XAU/USD chart, a downward wave has concluded at $1901.00, followed by a corrective rally to $1930.00. A consolidation phase is anticipated below this level. Should the price break below the consolidation range, there’s potential for an extension of the downward wave to $1893.40. The Moving Average Convergence Divergence (MACD) confirms this scenario, with its signal line positioned above zero but appearing to gear up for a downward movement.
Free Reports:
 Download Our Metatrader 4 Indicators – Put Our Free MetaTrader 4 Custom Indicators on your charts when you join our Weekly Newsletter
 Get our Weekly Commitment of Traders Reports - See where the biggest traders (Hedge Funds and Commercial Hedgers) are positioned in the futures markets on a weekly basis.
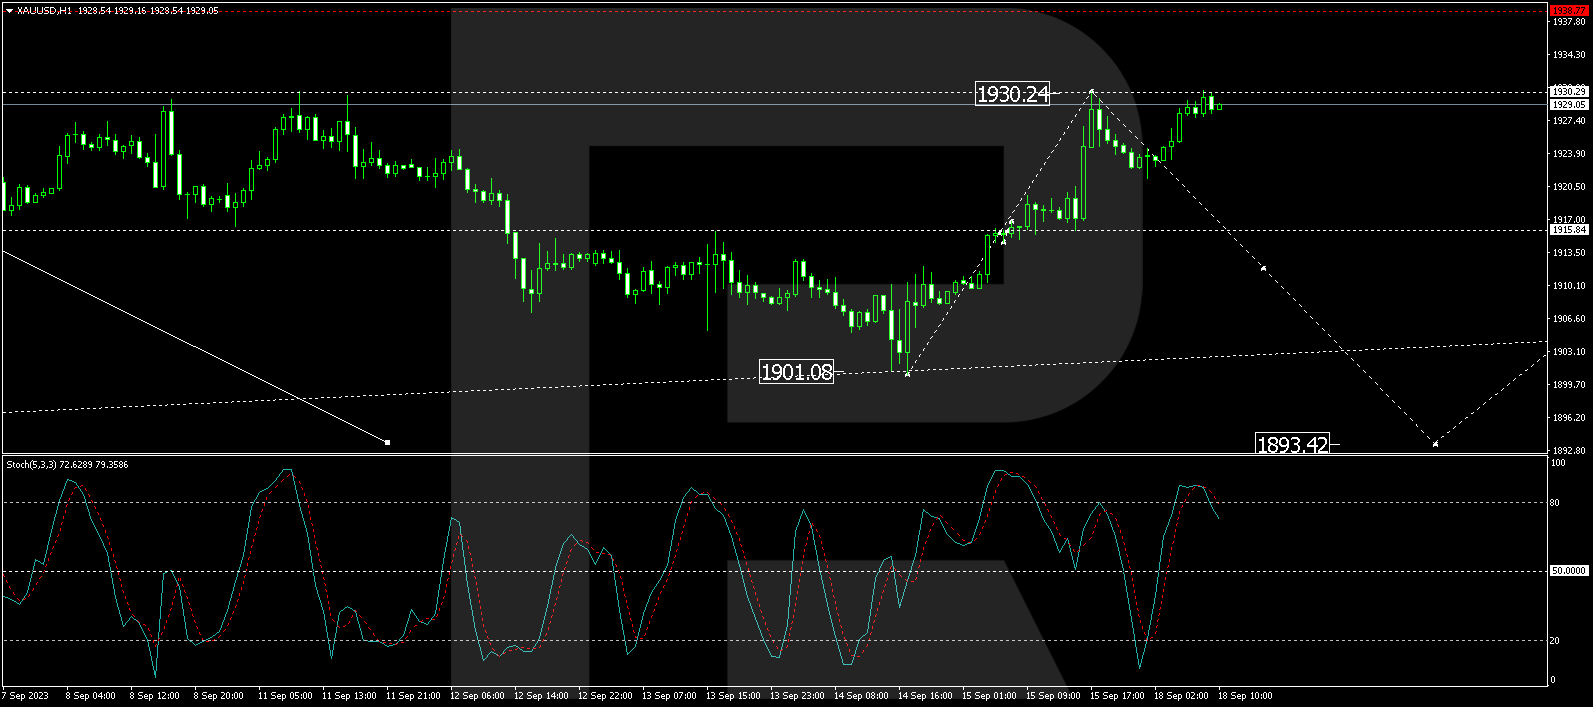
On the 1-hour chart, the price has formed a consolidation zone around $1915.85. Breaking out of this range to the upside, it has corrected to $1930.25. A retracement to $1915.00 is anticipated today. If this level is decisively breached, the door may open for a more significant drop to $1893.40. The Stochastic oscillator supports this outlook, showing its signal line above the 80 mark but trending strictly downward.
In summary, gold is experiencing a bullish streak, propelled by market uncertainties and key economic events on the horizon. Technical indicators point towards a possible short-term decline, but overall sentiment appears cautiously optimistic. Investors should closely monitor upcoming central bank meetings and currency fluctuations for further clues on the metal’s future trajectory.
Disclaimer
Any forecasts contained herein are based on the author’s particular opinion. This analysis may not be treated as trading advice. RoboForex bears no responsibility for trading results based on trading recommendations and reviews contained herein.

- Oil prices jumped 4% amid a new wave of escalation between the US and Iran Jul 14, 2026
- USD/JPY Holds at Highs: Pressure Lingers on Yen Jul 14, 2026
- Oil prices jumped 4% amid a new wave of escalation between the US and Iran Jul 13, 2026
- EUR/USD: US Inflation Will Determine Everything Jul 13, 2026
- COT Metals Charts: Weekly Speculator Bets see small gains for Silver & Gold Jul 12, 2026
- COT Bonds Charts: Speculator Bets led by SOFR 3-Months & 2-Year Bonds Jul 12, 2026
- COT Energy Charts: Weekly Speculator Changes led by Brent Oil Jul 12, 2026
- COT Soft Commodities Charts: Weekly Speculator Changes led by Sugar, Corn & Soybeans Jul 12, 2026
- The US and European stock indices are rising again amid renewed investor interest in the AI industry. Jul 10, 2026
- USD/JPY Falls as Yen Recovers Weekly Losses Jul 10, 2026