
Article By RoboForex.com
USDJPY, “US Dollar vs Japanese Yen”
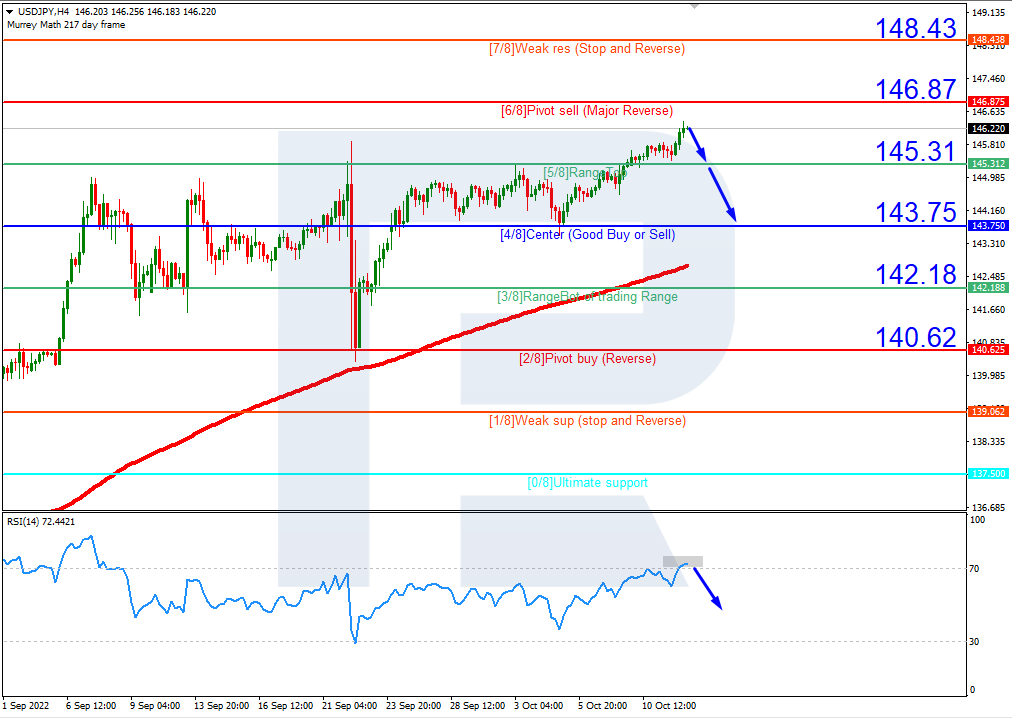
As we can see in the H4 chart, USDJPY is trading above the 200-day Moving Average to indicate a possible ascending tendency. However, after breaking 70, the Relative Strength Index is moving above it, signaling that the asset is “overbought” and may start a descending correction soon. In this case, the pair is expected to test 5/8 (145.51), break it, and then continue falling to reach the support at 4/8 (143.75). However, this scenario may be cancelled if the price breaks the resistance at 6/8 (146.87) to the upside. After that, the instrument may grow towards 7/8 (148.43).

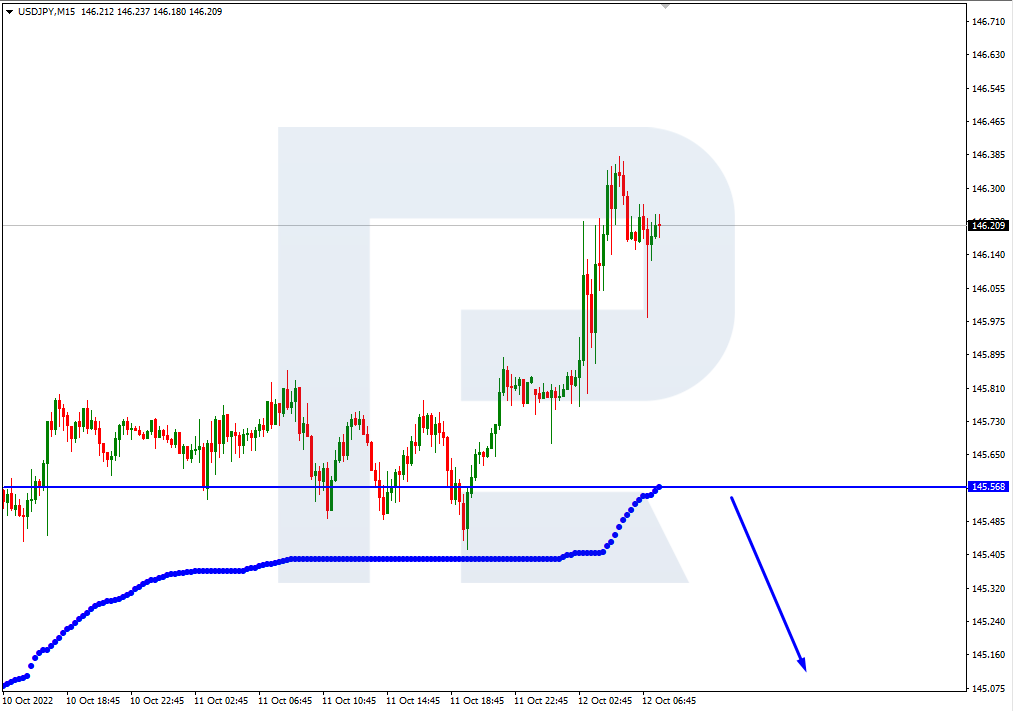
In the M15 chart, the pair may break the downside line of the VoltyChannel indicator and, as a result, continue its decline.
Free Reports:
 Get our Weekly Commitment of Traders Reports - See where the biggest traders (Hedge Funds and Commercial Hedgers) are positioned in the futures markets on a weekly basis.
 Download Our Metatrader 4 Indicators – Put Our Free MetaTrader 4 Custom Indicators on your charts when you join our Weekly Newsletter
USDCAD, “US Dollar vs Canadian Dollar”
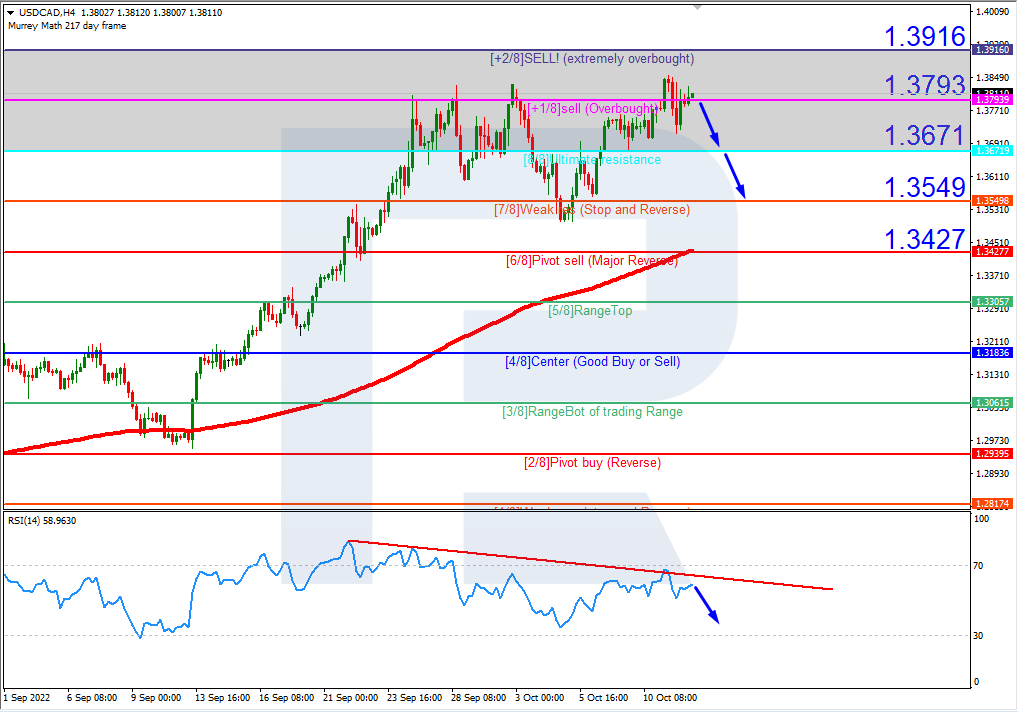
As we can see in the H4 chart, USDCAD is moving within the “overbought area”. The Relative Strength Index has rebounded from the descending trendline. In this case, the price is expected to break +1/8 (1.3793) and continue moving downwards to reach the support at 7/8 (1.3549). However, this scenario may no longer be valid if the price breaks the resistance at +2/8 (1.3916) to the upside. After that, the lines in the chart will be redrawn, thus helping us to define new upside targets.
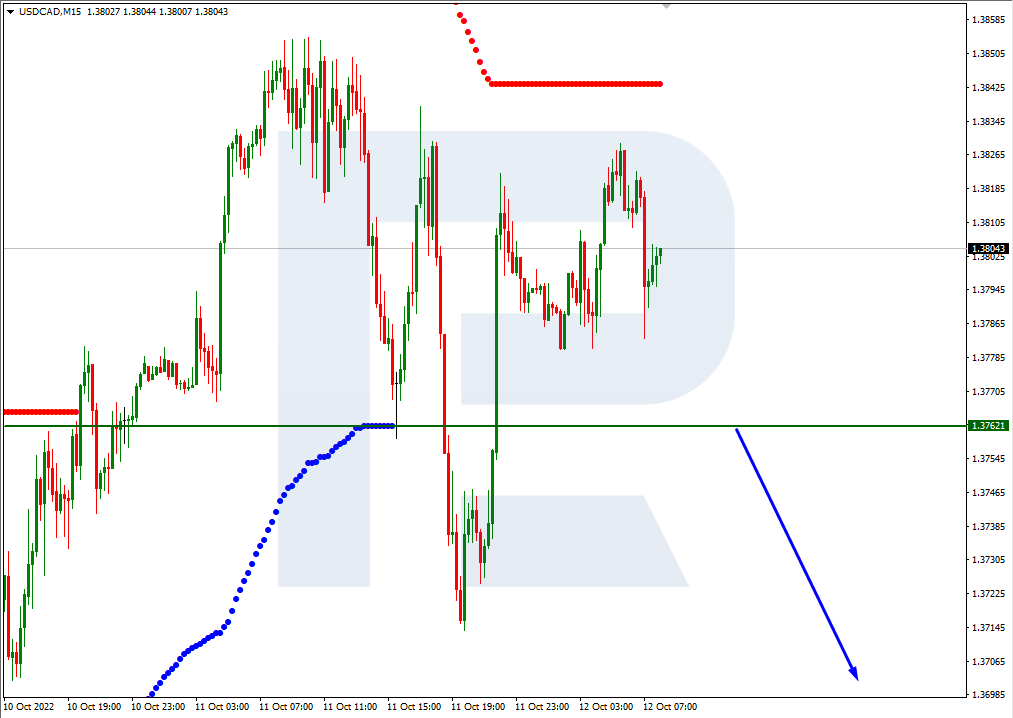
In the M15 chart, the pair may break the downside line of the VoltyChannel indicator and, as a result, continue trading downward
Article By RoboForex.com
Attention!
Forecasts presented in this section only reflect the author’s private opinion and should not be considered as guidance for trading. RoboForex LP bears no responsibility for trading results based on trading recommendations described in these analytical reviews.

- Gold (XAU/USD) Faces Persistent Selling Pressure Jun 10, 2026
- The US technology sector once again came under a wave of selling Jun 10, 2026
- China has shifted to using its own strategic oil reserves Jun 9, 2026
- GBP/USD Remains Under Pressure Despite Attempts to Recover Jun 9, 2026
- SpaceX IPO: Set for $75 billion liftoff Jun 8, 2026
- On Friday, the American stock market experienced one of the strongest crashes in recent times Jun 8, 2026
- EUR/USD at April Lows: What’s Next for the Pair? Jun 8, 2026
- The ceasefire between Israel and Lebanon has reduced the geopolitical premium Jun 5, 2026
- EUR/USD: All Eyes on Non-Farm Payrolls Jun 5, 2026
- The escalation of the conflict in the Middle East put pressure on US and European stock indices Jun 4, 2026