
By InvestMacro.com | #stocks #XLU #utilities
Utilities Select Sector SPDR Fund End of Day Update: October 06 2022
The Utilities Select Sector SPDR Fund (XLU) ETF finished the day with a fall of -2.85 percent and closed the day not too far off the lows of the day near the 65.41 price level, according to unofficial data at the New York close.
The XLU, an ETF that tracks the SP500 Utilities Select Sector Index, opened the day trading at 67.04 with the high of the day being 67.15 and the low of the day at 65.32.
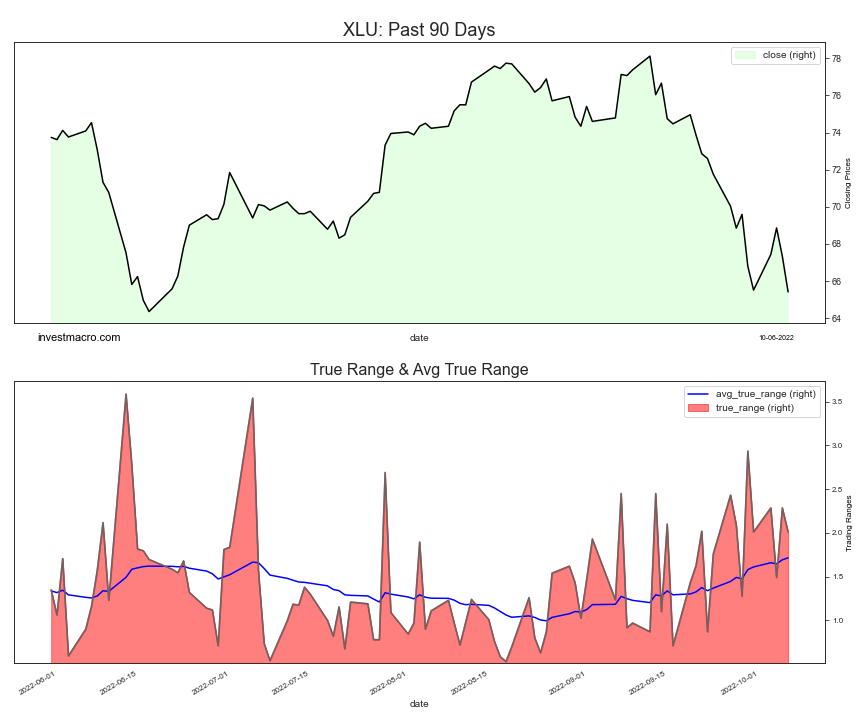
XLU has recently fallen below the 200-day moving average and has seen a deep descend after hitting a recent high over $78.00 in the middle of September.
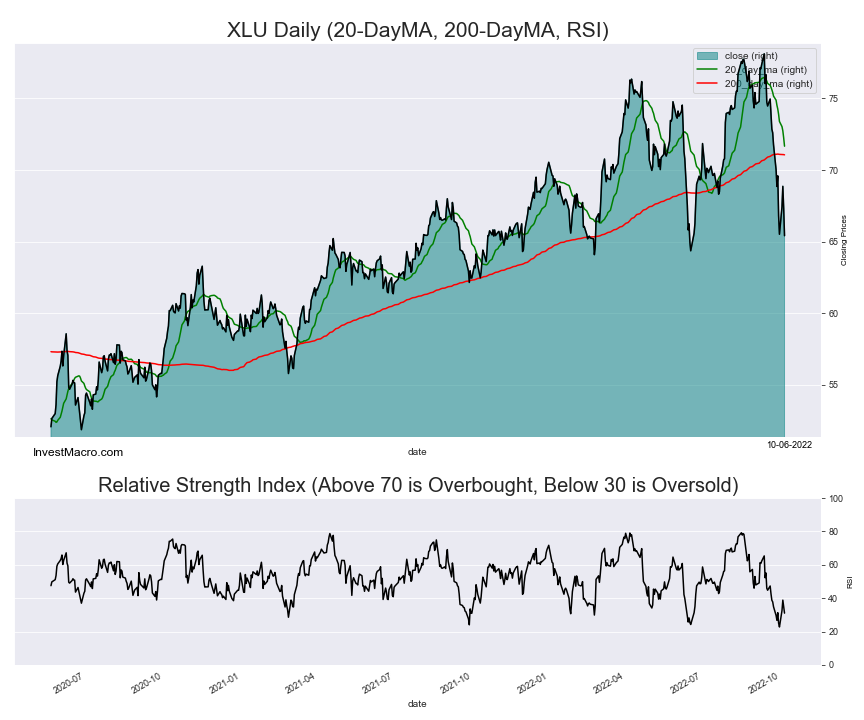
The XLU RSI level is Bearish
The Relative Strength Index, an indicator that can indicate overbought (above 70) and oversold levels (below 30), shows that the current RSI score is at 31.0 for a Bearish reading on the daily time-frame.
Free Reports:
 Download Our Metatrader 4 Indicators – Put Our Free MetaTrader 4 Custom Indicators on your charts when you join our Weekly Newsletter
 Get our Weekly Commitment of Traders Reports - See where the biggest traders (Hedge Funds and Commercial Hedgers) are positioned in the futures markets on a weekly basis.
XLU Price Trends
The XLU has fallen by -9.90 percent over the past 10 days while seeing a decrease by -14.41 over the past 30 days. The 90-day change is -12.52 while the 180-day return and the 365-day return are -3.64 and 3.40, respectively.
By investmacro.com

- Oil prices fall back to pre‑war levels. Silver drops to a 7‑month low Jun 25, 2026
- Gold Falls to an Eight-Month Low: This May Not Be the Bottom Jun 25, 2026
- Stock indices came under heavy selling pressure amid growing skepticism about AI investments Jun 24, 2026
- The Pound Is Pressured Not by Politics, but by a Strong US Dollar Jun 24, 2026
- Global crude oil prices continued to decline. The AUD/USD exchange rate hit an 11‑week low Jun 23, 2026
- EUR/USD Remains Under Sellers’ Control as the Dollar Stays Strong Jun 23, 2026
- Gold Falls for the Third Consecutive Week: Is There Still Upside Potential? Jun 22, 2026
- Bank Indonesia raised its interest rate. Norges Bank and the SNB left rates unchanged Jun 19, 2026
- EUR/USD Loses Ground as Market Sentiment Favours the US Dollar Jun 19, 2026
- GBPUSD Awaits Bank of England Meeting Near April Lows Jun 18, 2026