
Article By RoboForex.com
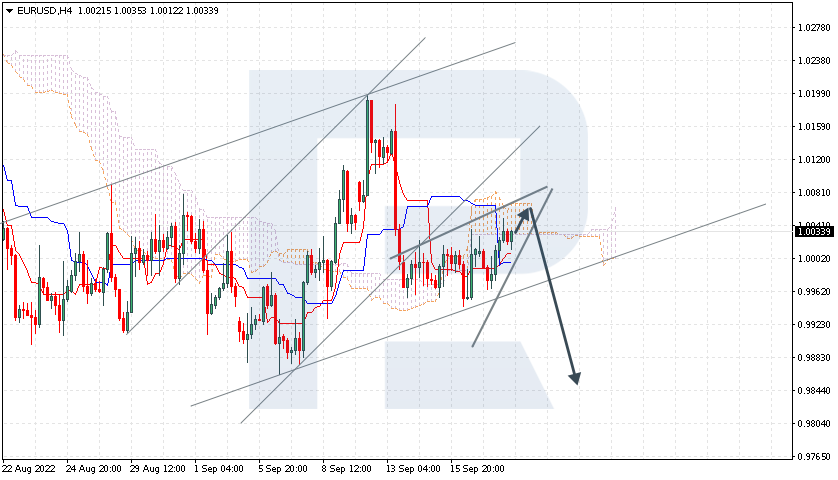
EURUSD, “Euro vs US Dollar”
EURUSD is correcting within the Wedge pattern. The instrument is currently moving inside Ichimoku Cloud, thus indicating a sideways tendency. The markets could indicate that the price may test the cloud’s upside border at 1.0045 and then resume moving downwards to reach 0.9845. Another signal in favour of a further downtrend will be a rebound from the upside border of the Wedge pattern. However, the bearish scenario may no longer be valid if the price breaks the cloud’s upside border and fixes above 1.0110. In this case, the pair may continue growing towards 1.0215. To confirm a further downtrend, the price must break the pattern’s downside border and fix below 0.9965.

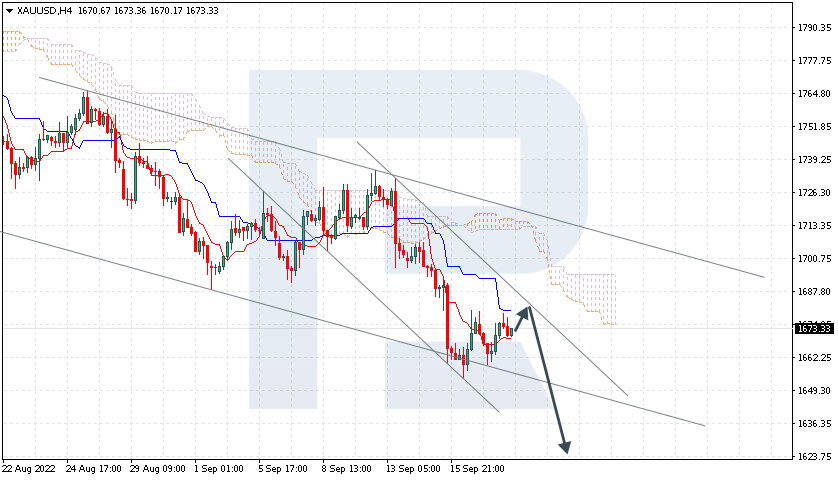
XAUUSD, “Gold vs US Dollar”
XAUUSD is testing Tenkan-Sen and Kijun-Sen. The instrument is currently moving below Ichimoku Cloud, thus indicating a descending tendency. The markets could indicate that the price may test Kijun-Sen at 1675.00 and then resume moving downwards to reach 1625.00. Another signal in favour of a further downtrend will be a rebound from the descending channel’s upside border. However, the bearish scenario may no longer be valid if the price breaks the cloud’s upside border and fixes above 1705.00. In this case, the pair may continue growing towards 1745.00.
Free Reports:
 Get our Weekly Commitment of Traders Reports - See where the biggest traders (Hedge Funds and Commercial Hedgers) are positioned in the futures markets on a weekly basis.
 Sign Up for Our Stock Market Newsletter – Get updated on News, Charts & Rankings of Public Companies when you join our Stocks Newsletter
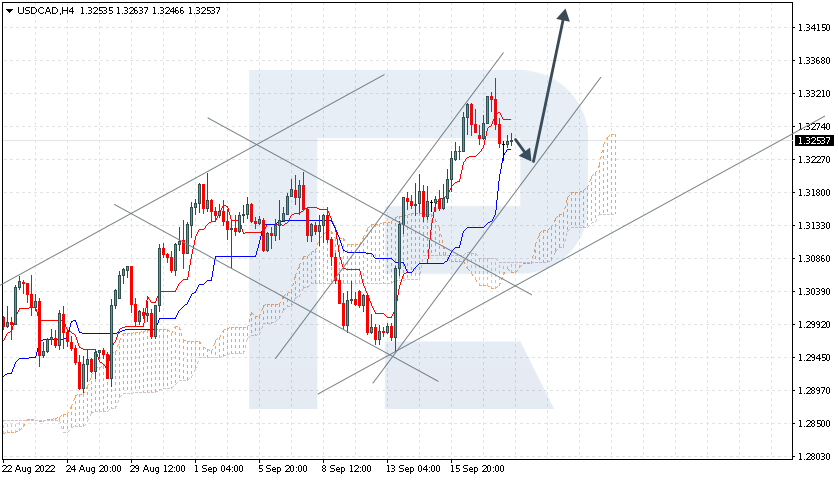
USDCAD, “US Dollar vs Canadian Dollar”
USDCAD is rebounding from the support area. The instrument is currently moving above Ichimoku Cloud, thus indicating an ascending tendency. The markets could indicate that the price may test Kijun-Sen at 1.3225 and then resume moving upwards to reach 1.3425. Another signal in favour of a further uptrend will be a rebound from the rising channel’s downside border. However, the bullish scenario may no longer be valid if the price breaks the cloud’s downside border and fixes below 1.3045. In this case, the pair may continue falling towards 1.2955.
Article By RoboForex.com
Attention!
Forecasts presented in this section only reflect the author’s private opinion and should not be considered as guidance for trading. RoboForex LP bears no responsibility for trading results based on trading recommendations described in these analytical reviews.

- Gold (XAU/USD) Faces Persistent Selling Pressure Jun 10, 2026
- The US technology sector once again came under a wave of selling Jun 10, 2026
- China has shifted to using its own strategic oil reserves Jun 9, 2026
- GBP/USD Remains Under Pressure Despite Attempts to Recover Jun 9, 2026
- SpaceX IPO: Set for $75 billion liftoff Jun 8, 2026
- On Friday, the American stock market experienced one of the strongest crashes in recent times Jun 8, 2026
- EUR/USD at April Lows: What’s Next for the Pair? Jun 8, 2026
- The ceasefire between Israel and Lebanon has reduced the geopolitical premium Jun 5, 2026
- EUR/USD: All Eyes on Non-Farm Payrolls Jun 5, 2026
- The escalation of the conflict in the Middle East put pressure on US and European stock indices Jun 4, 2026