
By Ino.com
– Earlier this month, I updated on the crypto market with a title, ‘It Ain’t Over Yet”. I considered the recent strength in the main cryptocurrencies a “dead-cat bounce” within a classic sideways consolidation with a high probability of resuming collapse.
This time, I spotted new signals as the chart moves to the right building new bars over time. Let us start with the main coin in the weekly chart below.
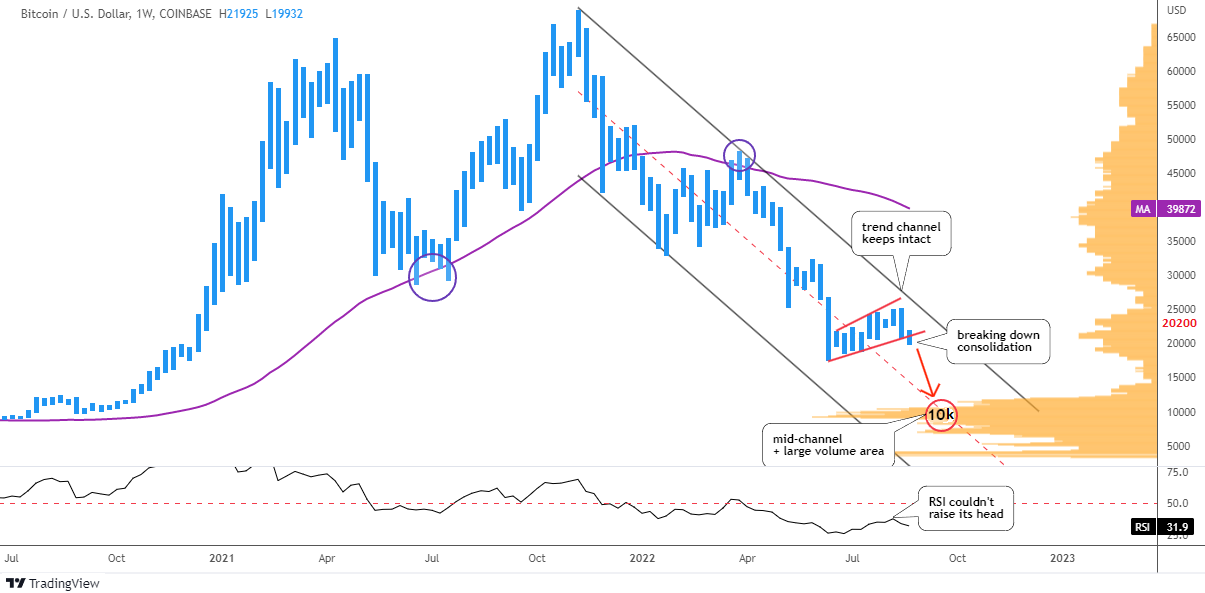
The price of Bitcoin moves within large bearish trend channel (black). The top of above-mentioned sideways consolidation within red trendlines did not even approach the resistance, it stays intact.
Free Reports:
 Sign Up for Our Stock Market Newsletter – Get updated on News, Charts & Rankings of Public Companies when you join our Stocks Newsletter
 Get our Weekly Commitment of Traders Reports - See where the biggest traders (Hedge Funds and Commercial Hedgers) are positioned in the futures markets on a weekly basis.
The RSI indicator could not raise its head to test the “waterline” of 50 level. This means that the market has considered this short-term strength as a “dead-cat bounce” as well.
The chart bar of last week has punctured below the red support. This is a harbinger of another drop. The main coin indeed is looking into the abyss as the strong support appears only after the price halves down. The largest area of the Volume Profile histogram (orange) is located between $9k and $10k. The mid-channel (red dashed) fortifies that support with its intersection.
Your biggest bet last time was the drop of the Bitcoin down to $12.2k, where the second leg down is equal to the first one. It almost coincides with the above-mentioned double support.
The next volume area is located at the $4k level and this option was your least favorite.
This time I added the simple moving average (purple) covering the preceding 52 weeks (1 year). It has been offering a strong support to the price starting from 2020. This year it has flipped to become a strong resistance after the price has dropped below it. The $40k level is the barrier to break to confirm the new bullish cycle.
A rather interesting situation has developed for the main coin. The price should either half down to find support or it should double up from this level to crack the bearish cycle.
Now, let us check the Ethereum chart.
In spite of all the hype around the upcoming transition of Ethereum onto the proof-of-stake (PoS) mechanism, the shadow of falling Bitcoin remains a backbreaking burden.
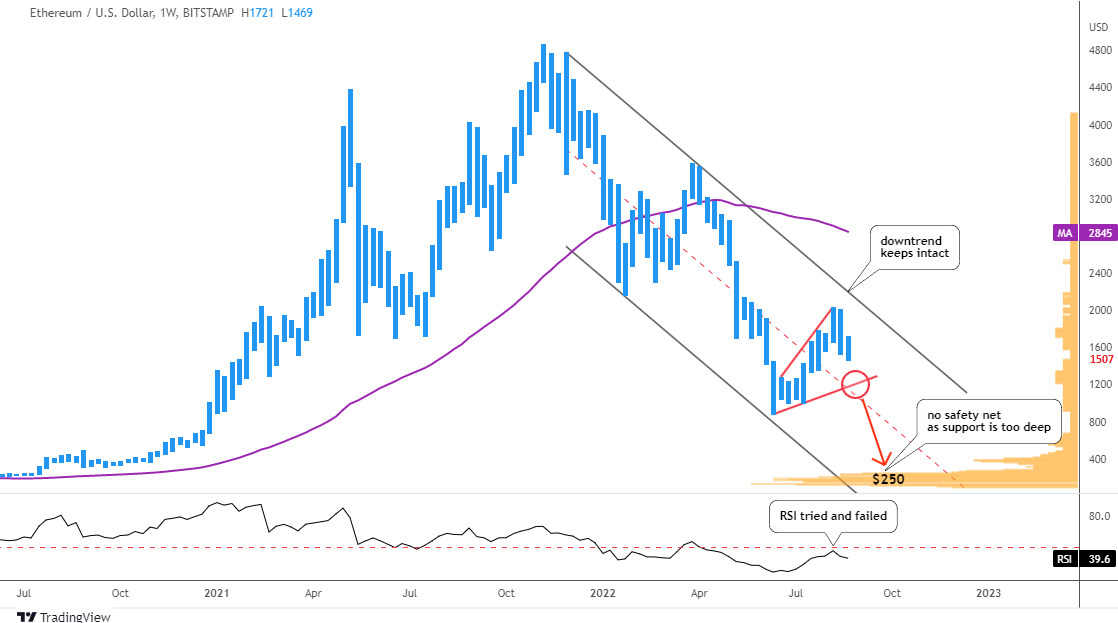
The black downtrend remains intact for the second largest coin also. There is a visible difference with the Bitcoin chart. The red mid-channel intersects with the red trendline support that contours consolidation.
Although the RSI was stronger here as it approached the barrier, it failed to break up and then dropped. Thus, the bearish mode continues.
Indeed, there is no safety net once the price slides below the red trendline support and the mid-channel until it touches the Volume Profile (orange) support of $250. It accords with the total annihilation model posted in May. Most of you agreed with this doomed forecast earlier.
The simple moving average (purple) for the preceding year stands at $2,845. The price should almost double to touch this resistance. This is a similar situation with Bitcoin. However, the downside gap is worse for Ethereum.
The forecasted collapse should show us for sure if the RSI will establish a new valley or not building the Bullish Divergence. HODL-ers will watch this event closely.
Intelligent trades!
Aibek Burabayev
INO.com Contributor
Disclosure: This contributor has no positions in any stocks mentioned in this article. This article is the opinion of the contributor themselves. The above is a matter of opinion provided for general information purposes only and is not intended as investment advice. This contributor is not receiving compensation (other than from INO.com) for their opinion.
By Ino.com – See our Trader Blog, INO TV Free & Market Analysis Alerts
Source: Bitcoin and Ethereum: No Safety Net

- EUR/USD: The Advantage Remains with the Dollar Jun 29, 2026
- Escalation of the US–Iran conflict is once again supporting the rise in oil prices Jun 29, 2026
- Oil prices fall back to pre‑war levels. Silver drops to a 7‑month low Jun 25, 2026
- Gold Falls to an Eight-Month Low: This May Not Be the Bottom Jun 25, 2026
- Stock indices came under heavy selling pressure amid growing skepticism about AI investments Jun 24, 2026
- The Pound Is Pressured Not by Politics, but by a Strong US Dollar Jun 24, 2026
- Global crude oil prices continued to decline. The AUD/USD exchange rate hit an 11‑week low Jun 23, 2026
- EUR/USD Remains Under Sellers’ Control as the Dollar Stays Strong Jun 23, 2026
- Gold Falls for the Third Consecutive Week: Is There Still Upside Potential? Jun 22, 2026
- Bank Indonesia raised its interest rate. Norges Bank and the SNB left rates unchanged Jun 19, 2026