
By RoboForex Analytical Department
This week is starting with new highs in Brent – the asset has reached the highs of 9 March 2022 and updated $120.
There are several factors that support oil bulls – they are pretty clear but market players are still building on them. Increasing car traffic in the US due to the start of a travel season make the demand for fuel go up even when retail prices for energy are high. At the same time, the supply shortage in the domestic market didn’t go anywhere and it’s another thing that keeps prices “in suspense”.
In addition, investors aren’t forgetting about a possible oil embargo against Russian oil by the European Union. The suspense is getting more intense, and investors will remain nervous as long as it’s here.
The latest report from Baker Hughes confirmed that the shale industry remained rather inactive, although the volumes were slowly increasing. Over the past week, the Oil Rig Count in the US decreased by 2 units, down to 574. In Canada, the indicator increased by 15 units, up to 55.
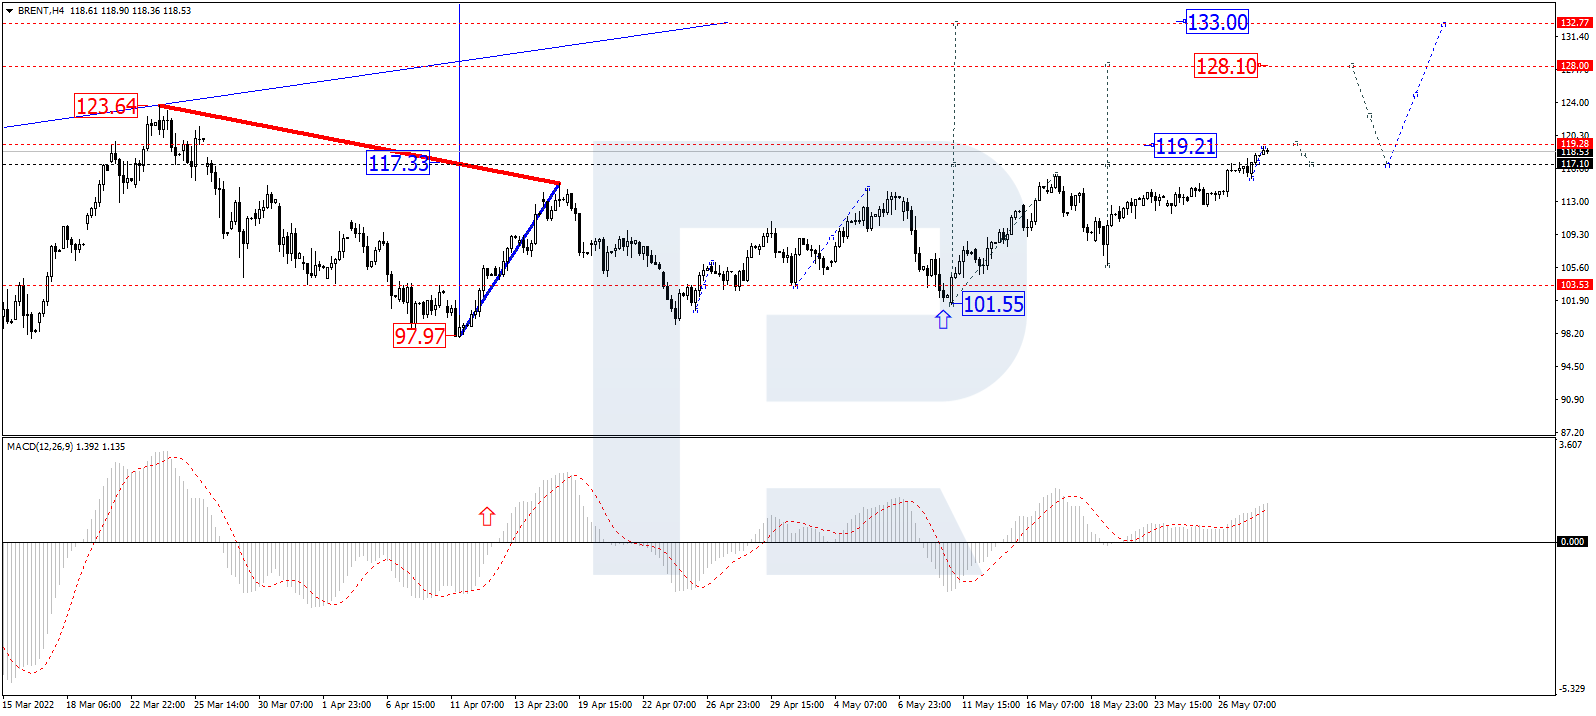
Technical analysis – Brent oil
Free Reports:
 Download Our Metatrader 4 Indicators – Put Our Free MetaTrader 4 Custom Indicators on your charts when you join our Weekly Newsletter
 Get our Weekly Commitment of Traders Reports - See where the biggest traders (Hedge Funds and Commercial Hedgers) are positioned in the futures markets on a weekly basis.
In the H4 chart, after forming a new consolidation range around 117.00 and breaking to the upside, Brent is expected to expand it up to 119.30 and may later fall to test 117.30 from above. After that, the instrument may resume moving within the uptrend with the target at 123.00 or even extend this structure up to 128.88. From the technical point of view, this scenario is confirmed by MACD Oscillator: its signal line is growing above 0 within the histogram area, which means that the uptrend in the price chart may continue.
As we can see in the H1 chart, having rebounded from 117.10, Brent is growing to break 119.30. and may later continue trading upwards with the target at 123.00. From the technical point of view, this idea is confirmed by the Stochastic Oscillator: its signal line is moving below 80 and may later continue moving downwards to rebound from 50. After that, the line is expected to resume growing and reach 80.

Disclaimer
Any forecasts contained herein are based on the author’s particular opinion. This analysis may not be treated as trading advice. RoboForex bears no responsibility for trading results based on trading recommendations and reviews contained herein.

- EUR/USD: The Advantage Remains with the Dollar Jun 29, 2026
- Escalation of the US–Iran conflict is once again supporting the rise in oil prices Jun 29, 2026
- Oil prices fall back to pre‑war levels. Silver drops to a 7‑month low Jun 25, 2026
- Gold Falls to an Eight-Month Low: This May Not Be the Bottom Jun 25, 2026
- Stock indices came under heavy selling pressure amid growing skepticism about AI investments Jun 24, 2026
- The Pound Is Pressured Not by Politics, but by a Strong US Dollar Jun 24, 2026
- Global crude oil prices continued to decline. The AUD/USD exchange rate hit an 11‑week low Jun 23, 2026
- EUR/USD Remains Under Sellers’ Control as the Dollar Stays Strong Jun 23, 2026
- Gold Falls for the Third Consecutive Week: Is There Still Upside Potential? Jun 22, 2026
- Bank Indonesia raised its interest rate. Norges Bank and the SNB left rates unchanged Jun 19, 2026