
Article By RoboForex.com
BRENT
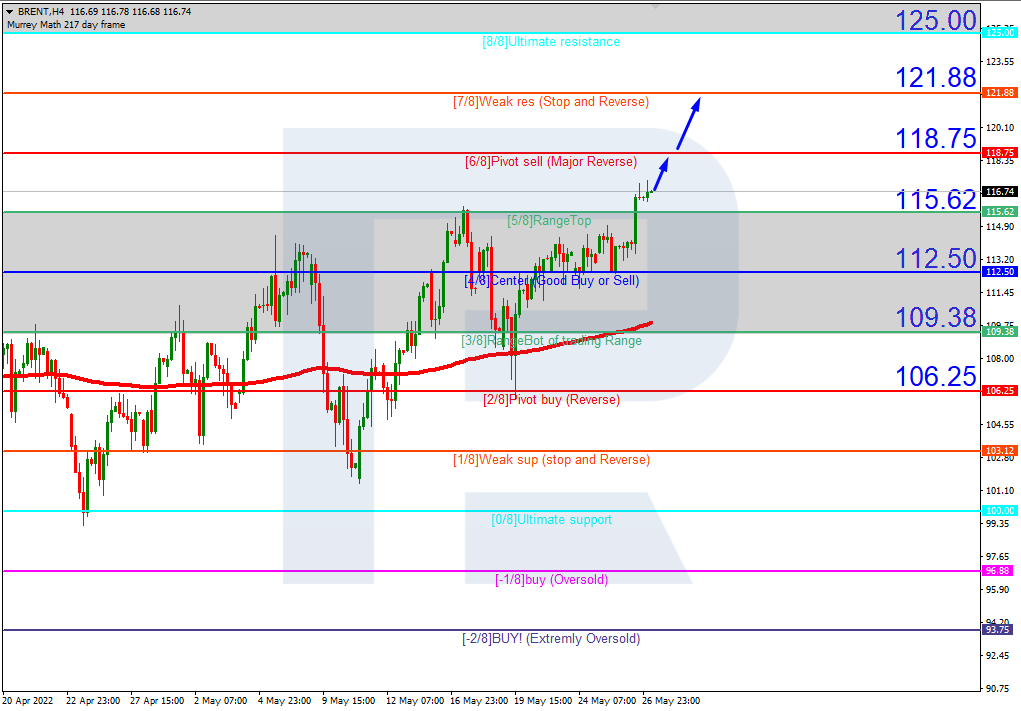
In the H4 chart, Brent is trading above the 200-day Moving Average to indicate a possible ascending tendency. In this case, the price is expected to test 6/8, break it, and then continue moving upwards to reach the resistance at 7/8. However, this scenario may no longer be valid if the asset breaks the support at 5/8 to the downside. After that, the instrument may reverse and return to 3/8.

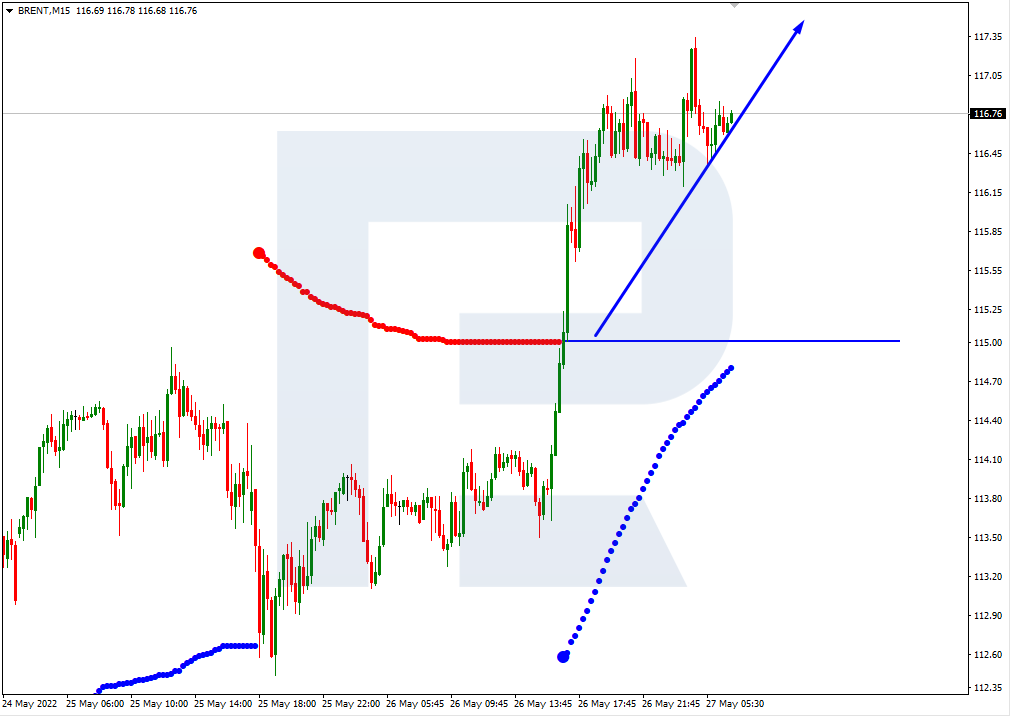
As we can see in the M15 chart, the pair has broken the upside line of the VoltyChannel indicator and, as a result, may continue trading upwards.
Free Reports:
 Get our Weekly Commitment of Traders Reports - See where the biggest traders (Hedge Funds and Commercial Hedgers) are positioned in the futures markets on a weekly basis.
 Sign Up for Our Stock Market Newsletter – Get updated on News, Charts & Rankings of Public Companies when you join our Stocks Newsletter
S&P 500
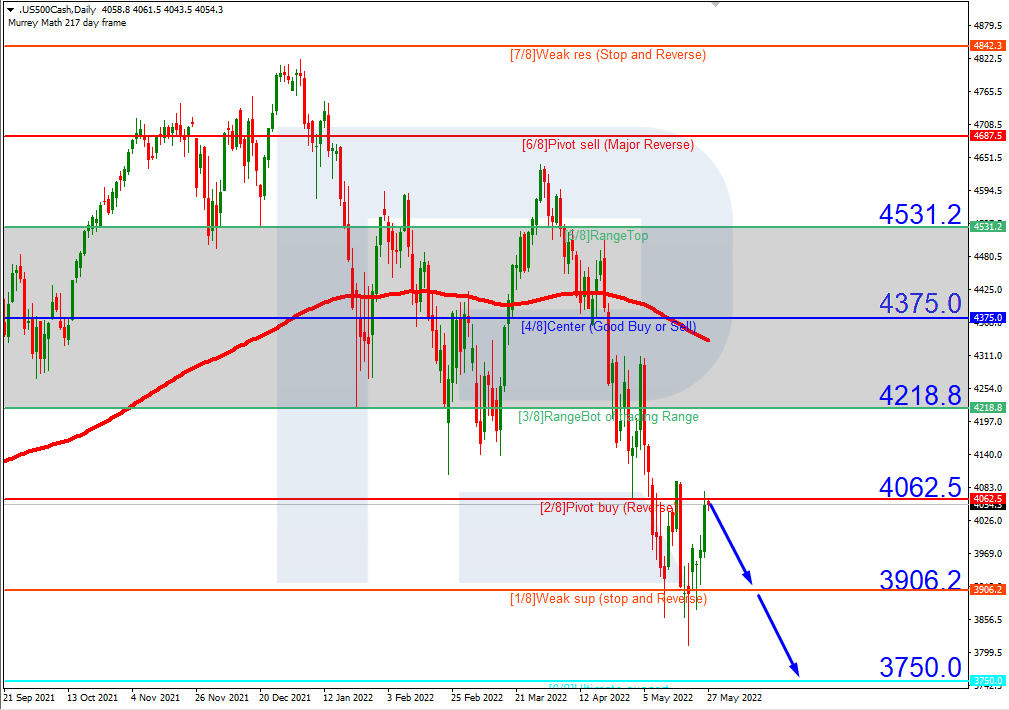
As we can see in the H4 chart, the S&P Index is trading below the 200-day Moving Average to indicate a descending tendency. In this case, the price is expected to rebound from 2/8 and resume falling towards the support at 0/8. However, this scenario may no longer be valid if the asset breaks the resistance at 2/8 to the upside. After that, the instrument may reverse and grow to reach 3/8.
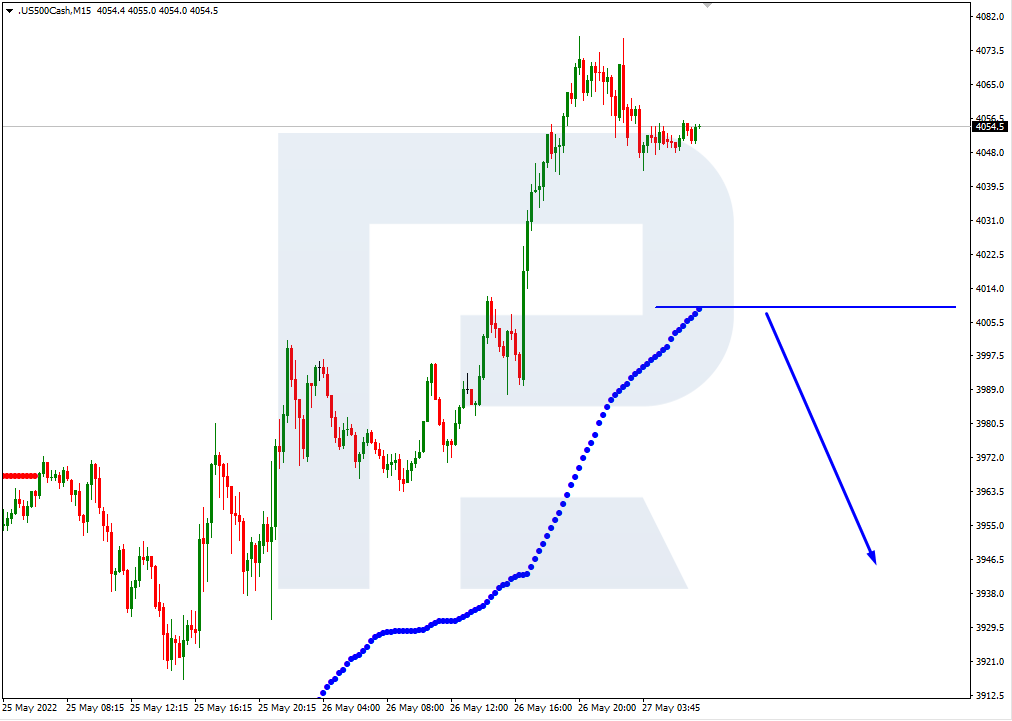
In the M15 chart, the pair may break the downside line of the VoltyChannel indicator and, as a result, continue its decline.
Article By RoboForex.com
Attention!
Forecasts presented in this section only reflect the author’s private opinion and should not be considered as guidance for trading. RoboForex LP bears no responsibility for trading results based on trading recommendations described in these analytical reviews.

- China has shifted to using its own strategic oil reserves Jun 9, 2026
- GBP/USD Remains Under Pressure Despite Attempts to Recover Jun 9, 2026
- SpaceX IPO: Set for $75 billion liftoff Jun 8, 2026
- On Friday, the American stock market experienced one of the strongest crashes in recent times Jun 8, 2026
- EUR/USD at April Lows: What’s Next for the Pair? Jun 8, 2026
- The ceasefire between Israel and Lebanon has reduced the geopolitical premium Jun 5, 2026
- EUR/USD: All Eyes on Non-Farm Payrolls Jun 5, 2026
- The escalation of the conflict in the Middle East put pressure on US and European stock indices Jun 4, 2026
- Gold Remains Under Pressure, but a Rebound Is Still Possible Jun 4, 2026
- Bitcoin drops below the psychological $70,000 level. The US stock indices hit new record highs Jun 3, 2026