
Article By RoboForex.com
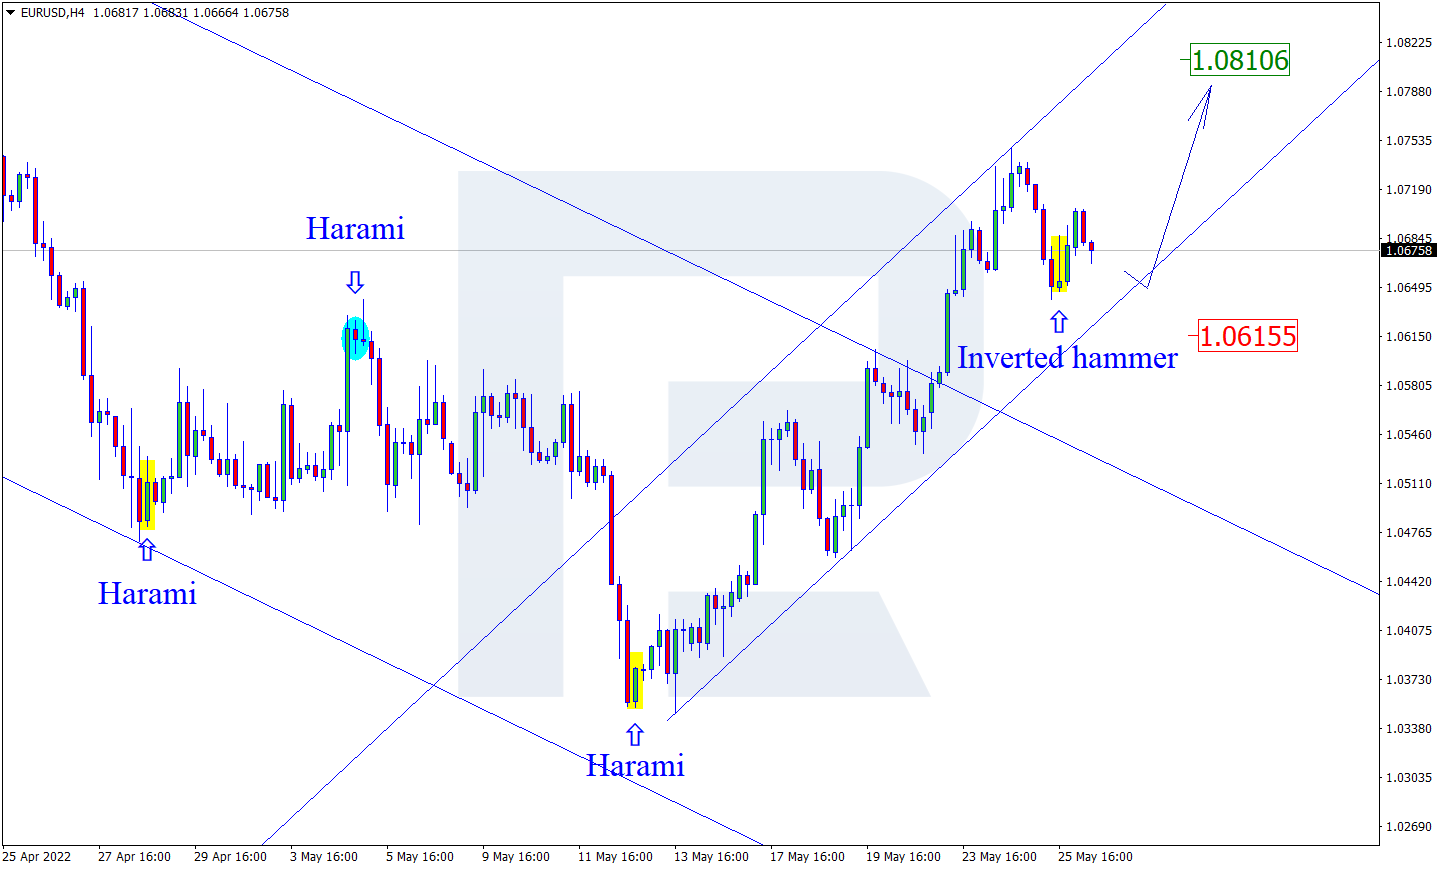
EURUSD, “Euro vs US Dollar”
As we can see in the H4 chart, the asset has formed an Inverted Hammer reversal pattern close to the support area. At the moment, EURUSD may reverse in the form of a new ascending impulse. In this case, the upside target may be at 1.0810. However, an alternative scenario implies that the price may fall to reach 1.0615 first and then resume the uptrend.

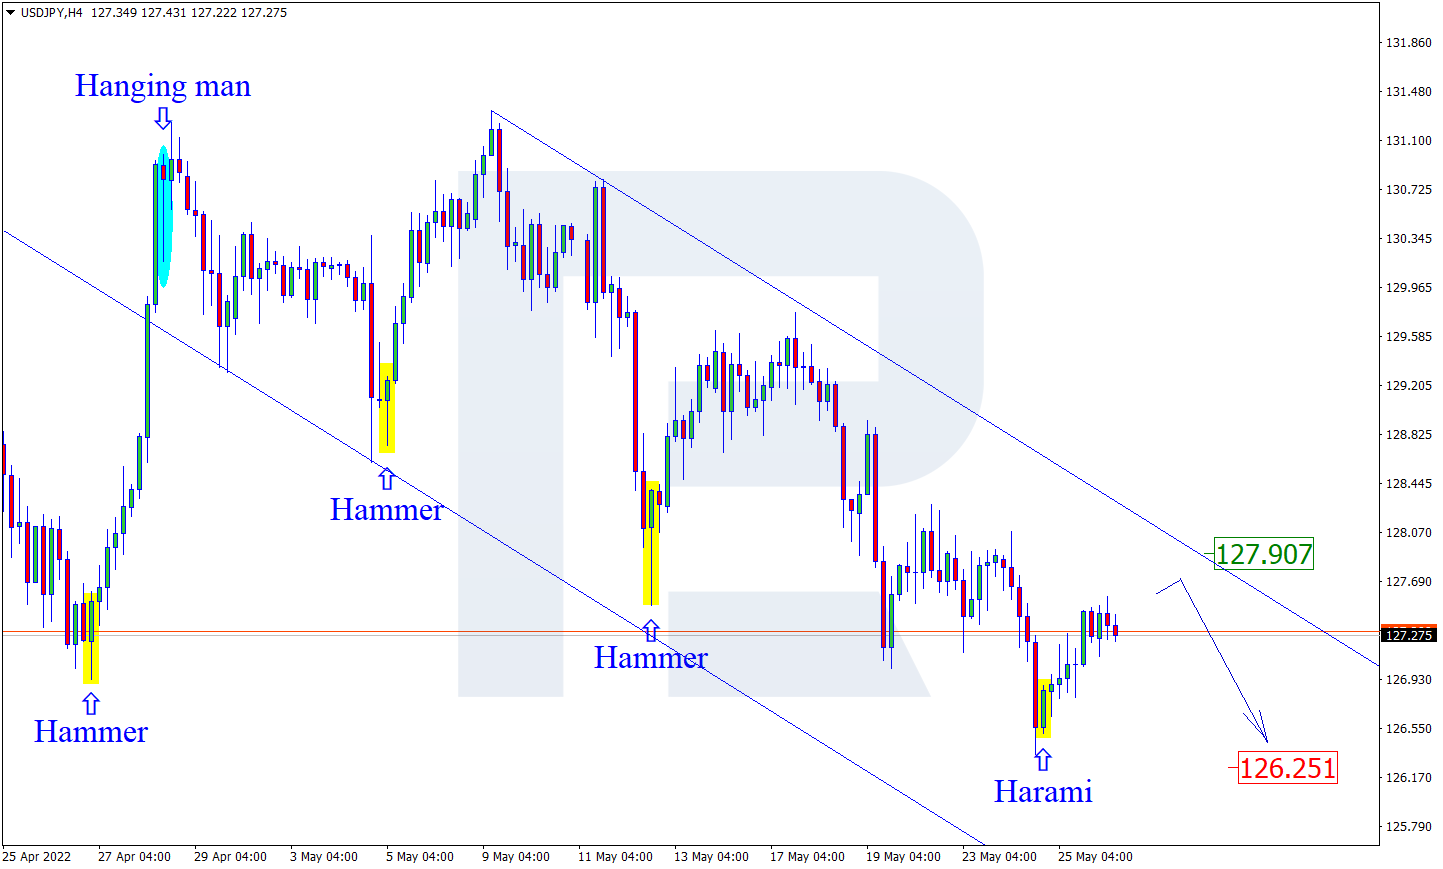
USDJPY, “US Dollar vs Japanese Yen”
As we can see in the H4 chart, USDJPY has formed a Harami pattern not far from the support area. At the moment, the asset is reversing in the form of a new correctional impulse. In this case, the upside correctional target may be at 127.90. At the same time, an opposite scenario implies that the price may fall to reach 126.25 and continue the downtrend without any corrections towards the resistance level.
Free Reports:
 Get our Weekly Commitment of Traders Reports - See where the biggest traders (Hedge Funds and Commercial Hedgers) are positioned in the futures markets on a weekly basis.
 Download Our Metatrader 4 Indicators – Put Our Free MetaTrader 4 Custom Indicators on your charts when you join our Weekly Newsletter
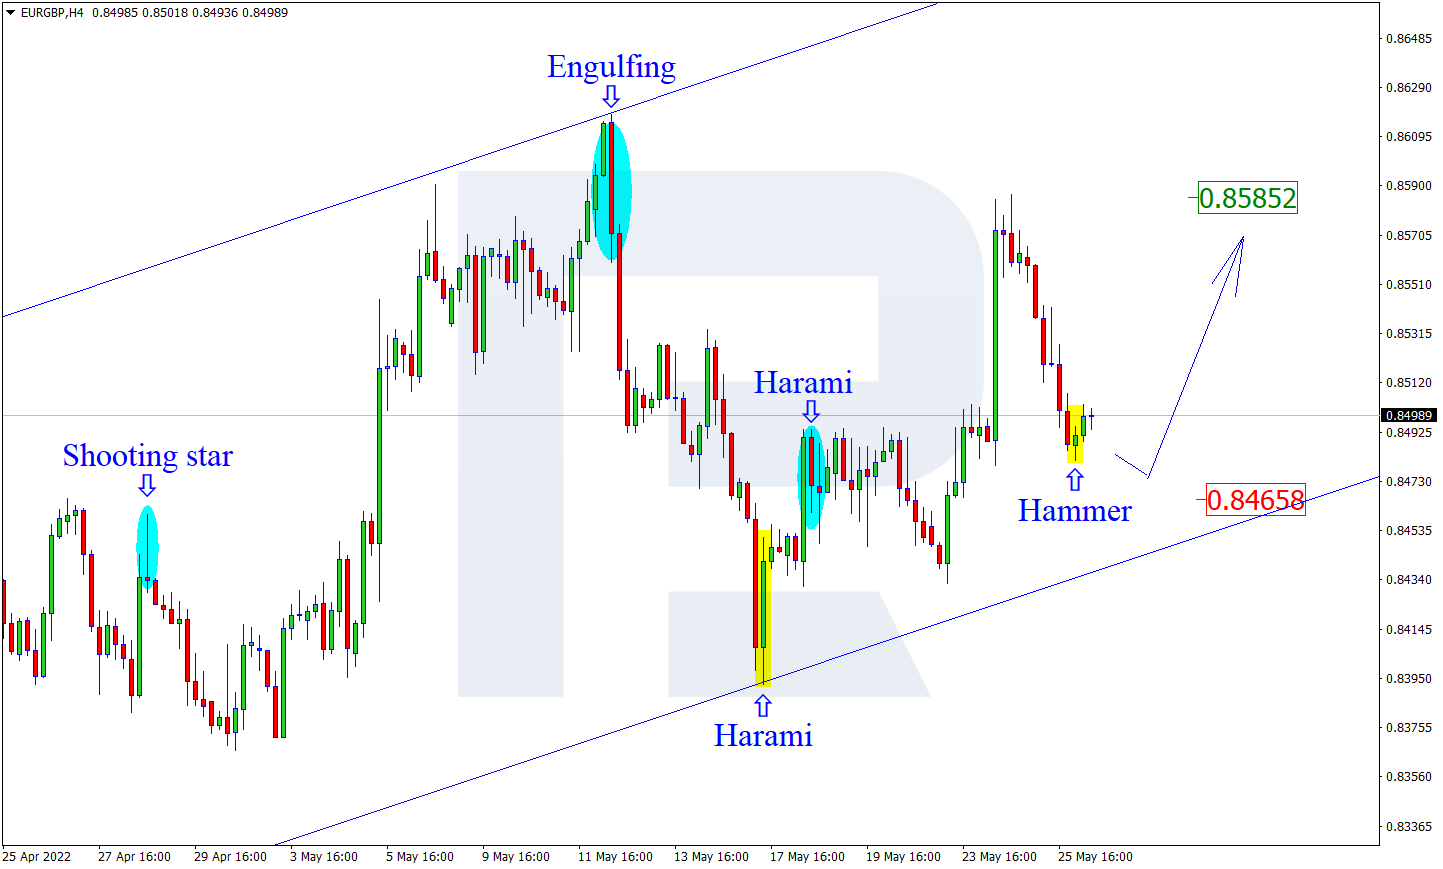
EURGBP, “Euro vs Great Britain Pound”
As we can see in the H4 chart, after forming a Hammer pattern near the support area, EURGBP is reversing in the form of a new ascending impulse. In this case, the upside target may be the resistance level at 0.8585. Later, the market may test this level, break it, and continue the ascending tendency. Still, there might be an alternative scenario, according to which the asset may correct to reach 0.8465 before resuming the uptrend.
Article By RoboForex.com
Attention!
Forecasts presented in this section only reflect the author’s private opinion and should not be considered as guidance for trading. RoboForex LP bears no responsibility for trading results based on trading recommendations described in these analytical reviews.

- SpaceX IPO: Set for $75 billion liftoff Jun 8, 2026
- On Friday, the American stock market experienced one of the strongest crashes in recent times Jun 8, 2026
- EUR/USD at April Lows: What’s Next for the Pair? Jun 8, 2026
- The ceasefire between Israel and Lebanon has reduced the geopolitical premium Jun 5, 2026
- EUR/USD: All Eyes on Non-Farm Payrolls Jun 5, 2026
- The escalation of the conflict in the Middle East put pressure on US and European stock indices Jun 4, 2026
- Gold Remains Under Pressure, but a Rebound Is Still Possible Jun 4, 2026
- Bitcoin drops below the psychological $70,000 level. The US stock indices hit new record highs Jun 3, 2026
- EUR/USD on Edge as Markets Await Key Employment Data Jun 3, 2026
- Oil prices surged again amid rumors of a freeze in diplomacy between the United States and Iran Jun 2, 2026