
Article By RoboForex.com
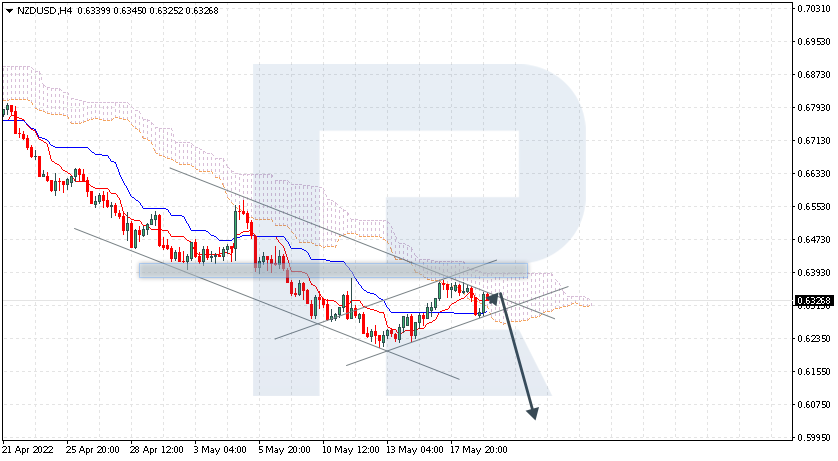
NZDUSD, “New Zealand Dollar vs US Dollar”
NZDUSD is rebounding from the bearish channel’s upside border. The instrument is currently moving inside Ichimoku Cloud, thus indicating a sideways tendency. Early in May, there was a similar test of the cloud, which resulted in a further downtrend. The markets could indicate that the price may re-test Tenkan-Sen at 0.6330 and then resume moving downwards to reach 0.6075. Another signal in favour of a further downtrend will be a rebound from the descending channel’s upside border. However, the bearish scenario may no longer be valid if the price breaks the cloud’s upside border and fixes above 0.6405. In this case, the pair may continue growing towards 0.6505. To confirm further decline, the asset must break the rising channel’s downside border and fix below 0.6230; so far, bears haven’t been able to leave the correctional channel.

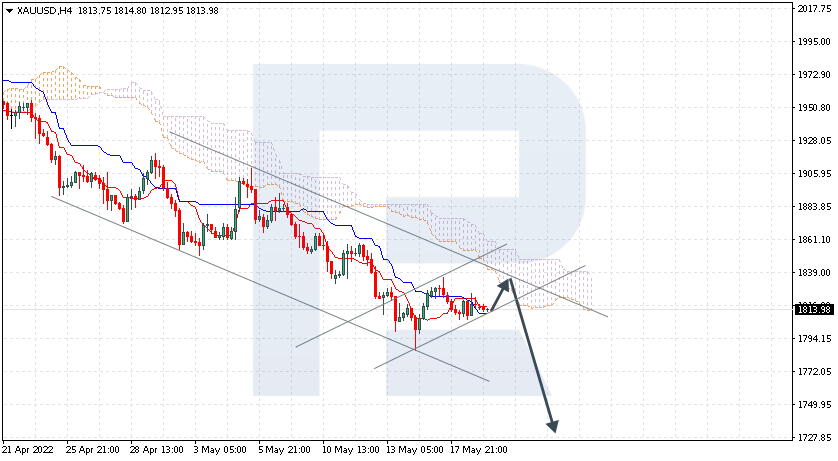
XAUUSD, “Gold vs US Dollar”
XAUUSD is testing Tenkan-Sen and Kijun-Sen. The instrument is currently moving below Ichimoku Cloud, thus indicating a descending tendency. The markets could indicate that the price may test the cloud’s downside border at 1825.00 and then resume moving downwards to reach 1725.00. Another signal in favour of a further downtrend will be a rebound from the descending channel’s upside border. However, the bearish scenario may no longer be valid if the price breaks the cloud’s upside border and fixes above 1865.00. In this case, the pair may continue growing towards 1895.00. To confirm further decline, the asset must break the rising channel’s downside border and fix below 1805.00.
Free Reports:
 Download Our Metatrader 4 Indicators – Put Our Free MetaTrader 4 Custom Indicators on your charts when you join our Weekly Newsletter
 Get our Weekly Commitment of Traders Reports - See where the biggest traders (Hedge Funds and Commercial Hedgers) are positioned in the futures markets on a weekly basis.
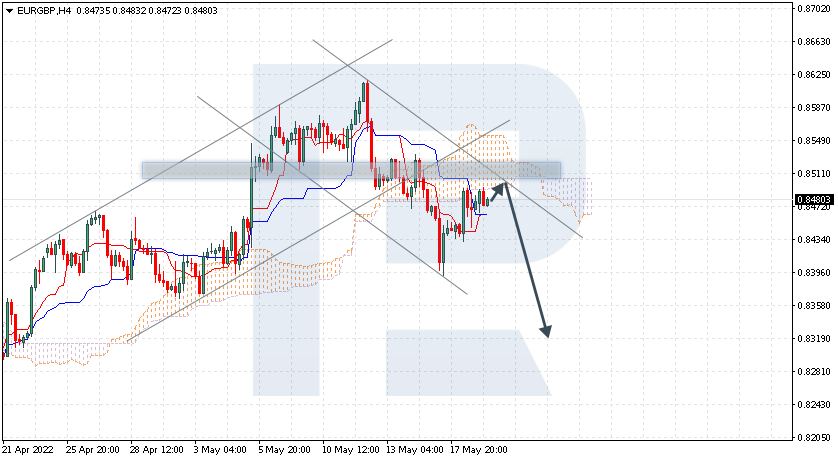
EURGBP, “Euro vs Great Britain Pound”
EURGBP is correcting within a “5-0” pattern. The instrument is currently moving below Ichimoku Cloud, thus indicating a descending tendency. The markets could indicate that the price may test the cloud’s downside border at 0.8490 and then resume moving downwards to reach 0.8320. Another signal in favour of a further downtrend will be a rebound from the descending channel’s upside border. However, the bearish scenario may no longer be valid if the price breaks the cloud’s upside border and fixes above 0.8535. In this case, the pair may continue growing towards 0.8625.
Article By RoboForex.com
Attention!
Forecasts presented in this section only reflect the author’s private opinion and should not be considered as guidance for trading. RoboForex LP bears no responsibility for trading results based on trading recommendations described in these analytical reviews.

- Gold Declines: Fed Policy and Geopolitics Weigh Jun 30, 2026
- Oil prices have once again risen above 70 dollars per barrel. The Australian dollar has updated a three‑month low Jun 30, 2026
- EUR/USD: The Advantage Remains with the Dollar Jun 29, 2026
- Escalation of the US–Iran conflict is once again supporting the rise in oil prices Jun 29, 2026
- Oil prices fall back to pre‑war levels. Silver drops to a 7‑month low Jun 25, 2026
- Gold Falls to an Eight-Month Low: This May Not Be the Bottom Jun 25, 2026
- Stock indices came under heavy selling pressure amid growing skepticism about AI investments Jun 24, 2026
- The Pound Is Pressured Not by Politics, but by a Strong US Dollar Jun 24, 2026
- Global crude oil prices continued to decline. The AUD/USD exchange rate hit an 11‑week low Jun 23, 2026
- EUR/USD Remains Under Sellers’ Control as the Dollar Stays Strong Jun 23, 2026