
By Orbex
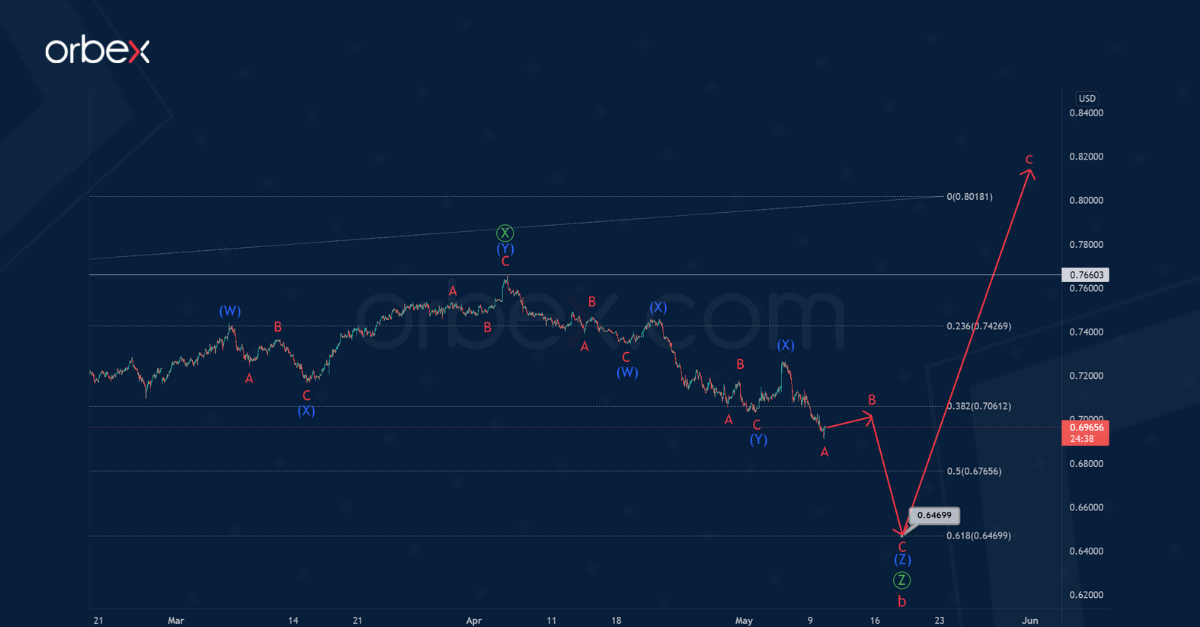
The current AUDUSD structure indicates that the market is forming a cycle zigzag a-b-c. This currently includes a bearish correction wave b and consists of primary sub-waves Ⓦ-Ⓧ-Ⓨ-Ⓧ-Ⓩ.
The final section of the chart shows the structure of the last primary wave Ⓩ. It seems to be an intermediate triple zigzag (W)-(X)-(Y)-(X)-(Z). The final wave (Z) will take the form of a minor zigzag A-B-C and will end near 0.646.
At that level, cycle correction b will be at 61.8% of cycle impulse wave a.
Free Reports:
 Get our Weekly Commitment of Traders Reports - See where the biggest traders (Hedge Funds and Commercial Hedgers) are positioned in the futures markets on a weekly basis.
 Sign Up for Our Stock Market Newsletter – Get updated on News, Charts & Rankings of Public Companies when you join our Stocks Newsletter
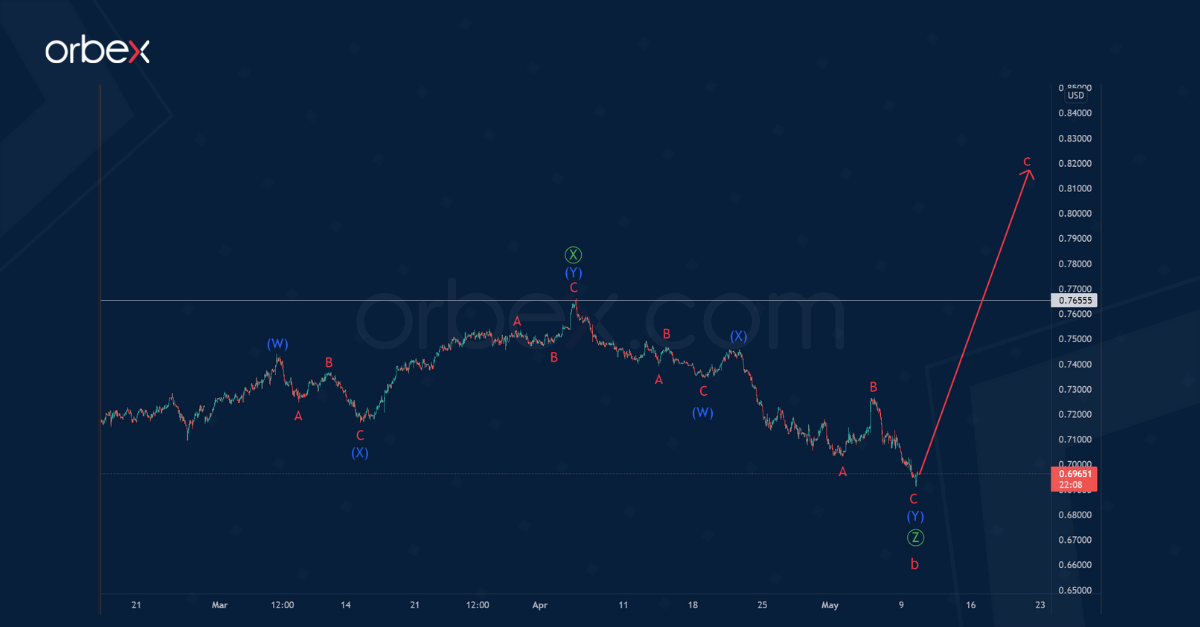
According to the alternative, the bearish wave Ⓩ of the primary degree has already ended.
Therefore, the primary wave Ⓩ will be a double zigzag (W)-(X)-(Y) of the intermediate degree, and not a triple zigzag, as we assumed in the main version.
According to this view, in the next coming trading weeks, the currency pair could move higher within the new cycle wave c. This would be in the direction of the previous maximum of 0.765, which was marked by the intervening wave Ⓧ.
Test your strategy on how the AUD will fare with Orbex – Open Your Account Now.
![]() Article by Orbex
Article by Orbex
Orbex is a fully licensed broker that was established in 2011. Founded with a mission to serve its traders responsibly and provides traders with access to the world’s largest and most liquid financial markets. www.orbex.com

- Oil prices fall back to pre‑war levels. Silver drops to a 7‑month low Jun 25, 2026
- Gold Falls to an Eight-Month Low: This May Not Be the Bottom Jun 25, 2026
- Stock indices came under heavy selling pressure amid growing skepticism about AI investments Jun 24, 2026
- The Pound Is Pressured Not by Politics, but by a Strong US Dollar Jun 24, 2026
- Global crude oil prices continued to decline. The AUD/USD exchange rate hit an 11‑week low Jun 23, 2026
- EUR/USD Remains Under Sellers’ Control as the Dollar Stays Strong Jun 23, 2026
- Gold Falls for the Third Consecutive Week: Is There Still Upside Potential? Jun 22, 2026
- Bank Indonesia raised its interest rate. Norges Bank and the SNB left rates unchanged Jun 19, 2026
- EUR/USD Loses Ground as Market Sentiment Favours the US Dollar Jun 19, 2026
- GBPUSD Awaits Bank of England Meeting Near April Lows Jun 18, 2026