
It’s a new trading quarter people!
Another three months of fresh and exciting opportunities across financial markets.
Today, it’s all about using technical analysis to identify existing/potential trends in the FX space.
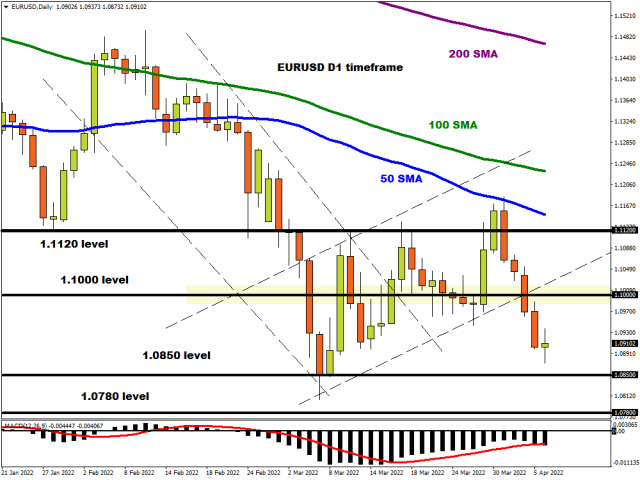
EURUSD eyes 1.0850
The EURUSD remains under pressure on the daily charts. Bears remain in control below 1.1000 with the next key level of interest found at 1.0850. A solid break under this point could trigger a decline towards 1.078. If bulls manage to propel prices back above 1.1000, a move towards 1.1120 could be on the cards.
Free Reports:
 Sign Up for Our Stock Market Newsletter – Get updated on News, Charts & Rankings of Public Companies when you join our Stocks Newsletter
 Get our Weekly Commitment of Traders Reports - See where the biggest traders (Hedge Funds and Commercial Hedgers) are positioned in the futures markets on a weekly basis.
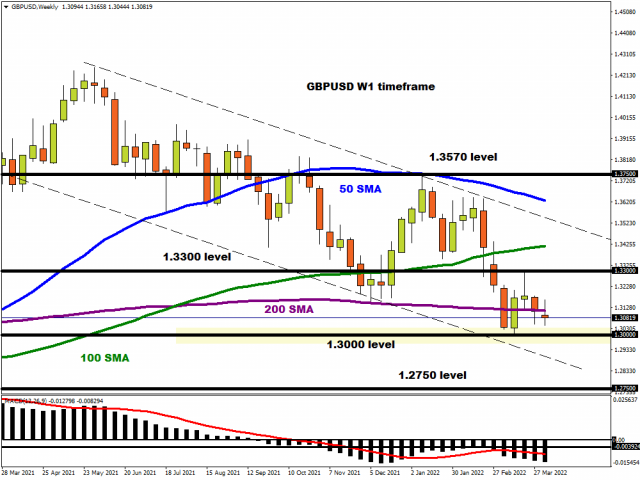
GBPUSD gearing for a steeper decline
If you are looking for a strong trend, then check out the GBPUSD on the weekly timeframe.
There have been consistently lower lows and lower highs while the MACD trades below zero. A major breakdown could be on the horizon but this will depend on whether bears can conquer the 1.3000 support level. A weekly close under this point may open the doors towards 1.2750. Should 1.3000 prove to be a tough nut to crack, a rebound back towards 1.3300 is likely to happen.
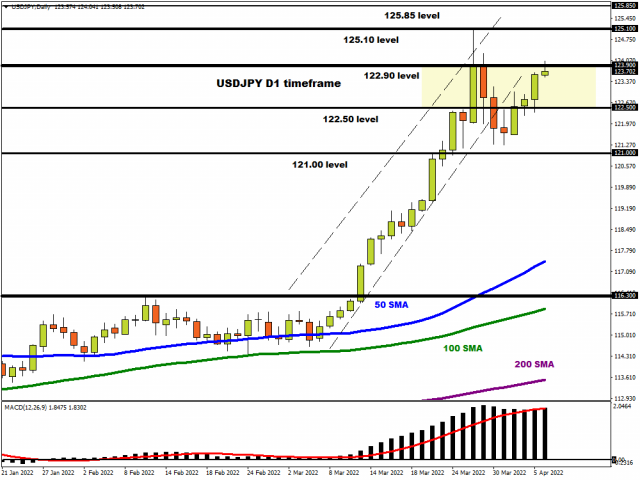
USDJPY approaches yearly high
Things are looking good for USDJPY bulls as prices steadily approach the 2022 high at 125.10.
A strong breakout and daily close above 123.90 could aid the upside and provide a fresh foundation for bulls to retest 125.10. Beyond this point is 125.85 – a level not seen since mid-2015.
Should 123.90 act as resistance, prices could decline back towards 122.50.
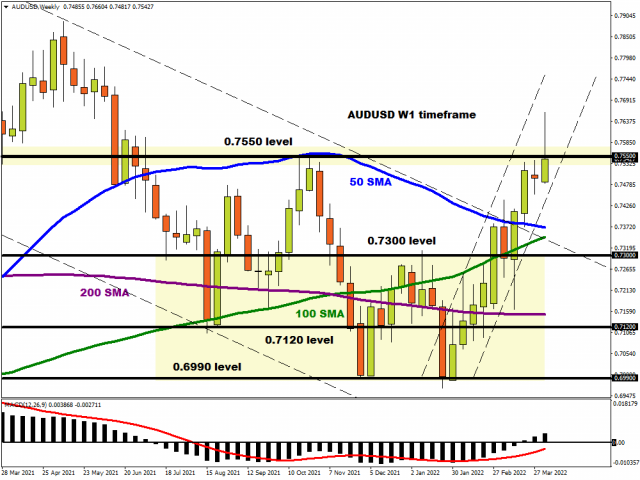
AUDUSD breaches 0.7550 resistance level
Things are starting to get interesting for the AUDUSD.
Over the past few months, the currency was stuck within a very wide range with support at 0.6990 and resistance at 0.7550. Earlier this week, prices punched well above 0.7550 for the first time since July 2021. This is certainly a bullish move but a weekly close above this point needs to be achieved for further upside. If this resistance proves too tough for bulls to handle, this could signal a possible selloff next week with 0.7300 acting as a key level of interest.
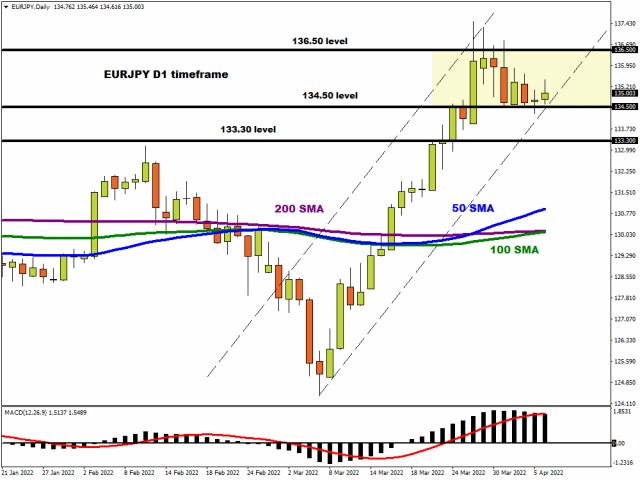
EURJPY balance above 134.50
The EURJPY remains in a bullish trend on the daily charts as there have been consistently higher highs and higher lows. Prices are trading above the 50, 100, and 200 Simple Day Moving Average while the MACD trades above zero. The EURJPY has the potential to rebound towards 136.50 if 134.50 proves to be a reliable support. A decline below this level may open a path back towards 133.30.
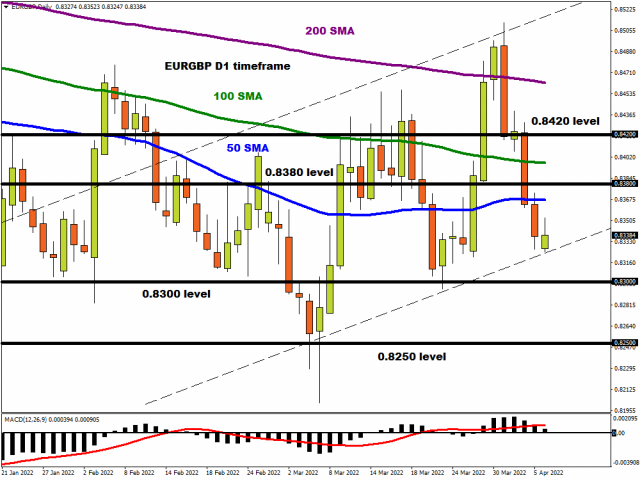
EURGBP drops back below 50 SMA
There is a lot going on with the EURGBP. Prices remain as choppy as ever on the daily timeframe, trading around 0.8340 as of writing. The currency pair is trading below the 50, 100, and 200 Simple Moving Average but the MACD trades above zero. If prices break below 0.8300, then a decline towards 0.8250 could be a possibility. A rebound that sees prices back above 0.8380 could encourage an incline towards 0.8420.
Disclaimer: The content in this article comprises personal opinions and should not be construed as containing personal and/or other investment advice and/or an offer of and/or solicitation for any transactions in financial instruments and/or a guarantee and/or prediction of future performance. ForexTime (FXTM), its affiliates, agents, directors, officers or employees do not guarantee the accuracy, validity, timeliness or completeness, of any information or data made available and assume no liability as to any loss arising from any investment based on the same.
![]() Article by ForexTime
Article by ForexTime
ForexTime Ltd (FXTM) is an award winning international online forex broker regulated by CySEC 185/12 www.forextime.com

- Gold Declines: Fed Policy and Geopolitics Weigh Jun 30, 2026
- Oil prices have once again risen above 70 dollars per barrel. The Australian dollar has updated a three‑month low Jun 30, 2026
- EUR/USD: The Advantage Remains with the Dollar Jun 29, 2026
- Escalation of the US–Iran conflict is once again supporting the rise in oil prices Jun 29, 2026
- Oil prices fall back to pre‑war levels. Silver drops to a 7‑month low Jun 25, 2026
- Gold Falls to an Eight-Month Low: This May Not Be the Bottom Jun 25, 2026
- Stock indices came under heavy selling pressure amid growing skepticism about AI investments Jun 24, 2026
- The Pound Is Pressured Not by Politics, but by a Strong US Dollar Jun 24, 2026
- Global crude oil prices continued to decline. The AUD/USD exchange rate hit an 11‑week low Jun 23, 2026
- EUR/USD Remains Under Sellers’ Control as the Dollar Stays Strong Jun 23, 2026