
Article By RoboForex.com
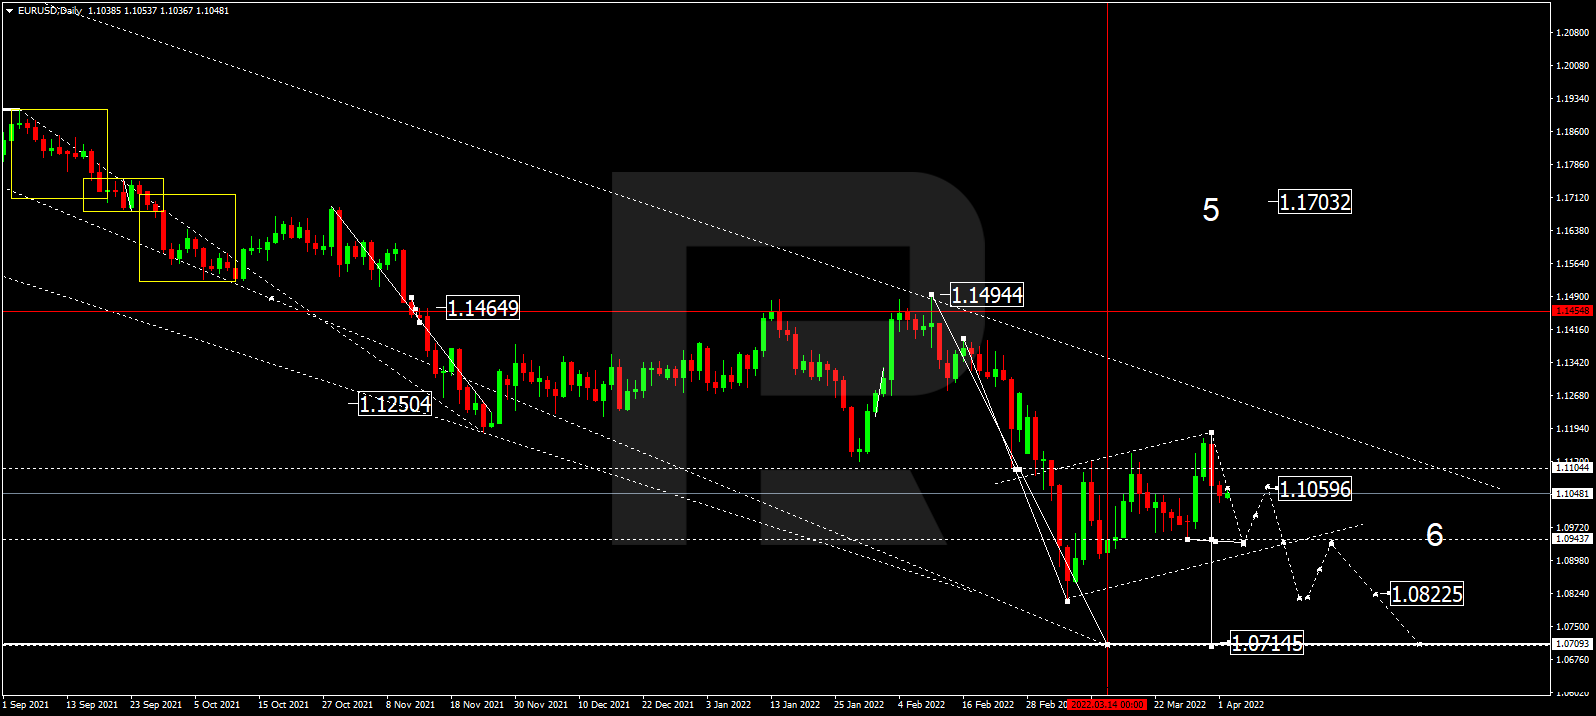
EURUSD, “Euro vs US Dollar”
As we can see in the daily chart, having completed the correction at 1.1170, EURUSD is forming another descending wave with the first target at 1.0944 and may later correct towards 1.1060, thus forming a wide consolidation range around 1.0944. If the price breaks this range to the downside, the market may resume falling towards 1.0822 or even extend this wave down to 1.0715; if to the upside – start another growth to reach 1.1200 and then form one more descending structure to return to 1.0944.

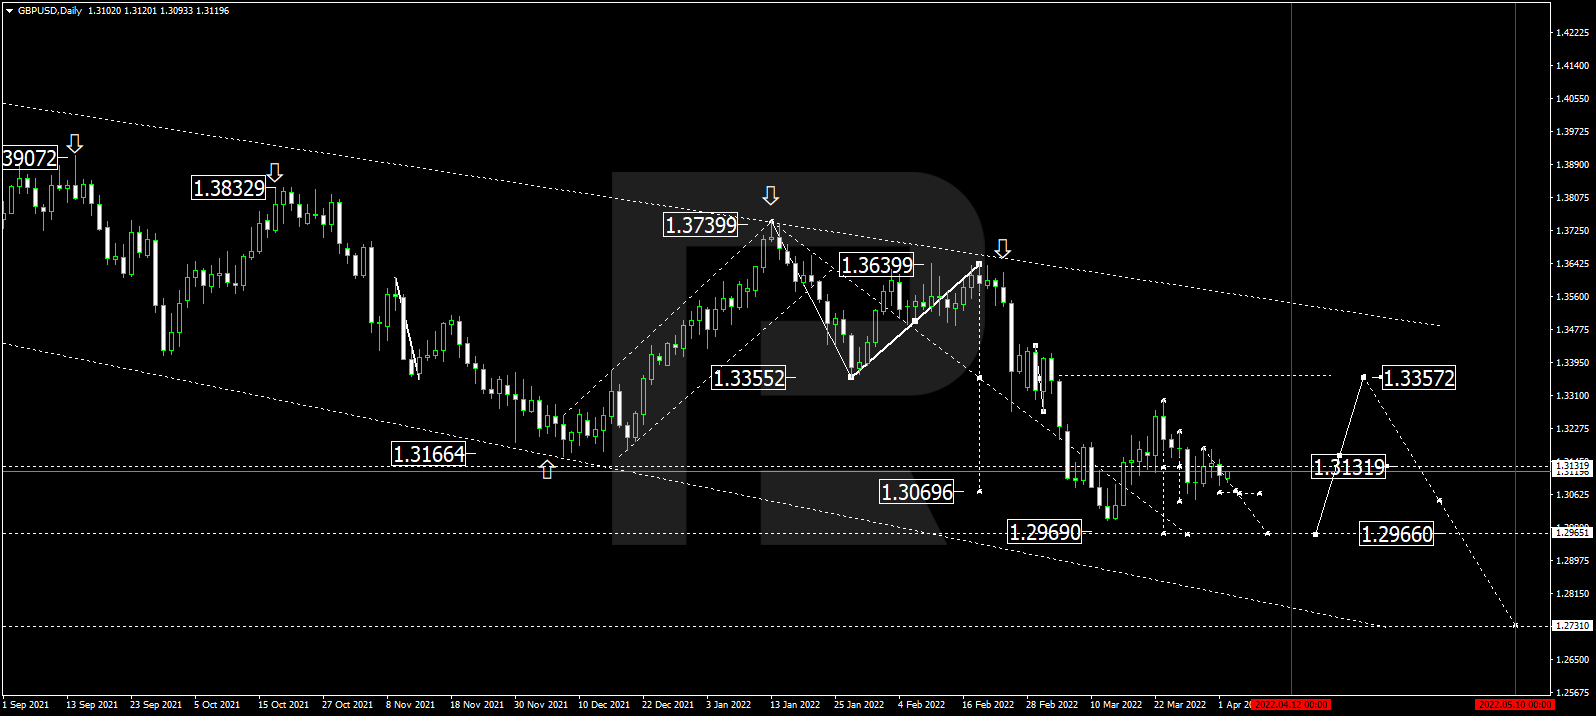
GBPUSD, “Great Britain Pound vs US Dollar”
In the daily chart, after finishing the correction at 1.3300, GBPUSD is trading downwards with the target at 1.2966; it has already broken 1.3131. At the moment, the asset is consolidating below the latter level. After reaching the above-mentioned target, the instrument may start another growth towards 1.3355.
Free Reports:
 Sign Up for Our Stock Market Newsletter – Get updated on News, Charts & Rankings of Public Companies when you join our Stocks Newsletter
 Get our Weekly Commitment of Traders Reports - See where the biggest traders (Hedge Funds and Commercial Hedgers) are positioned in the futures markets on a weekly basis.
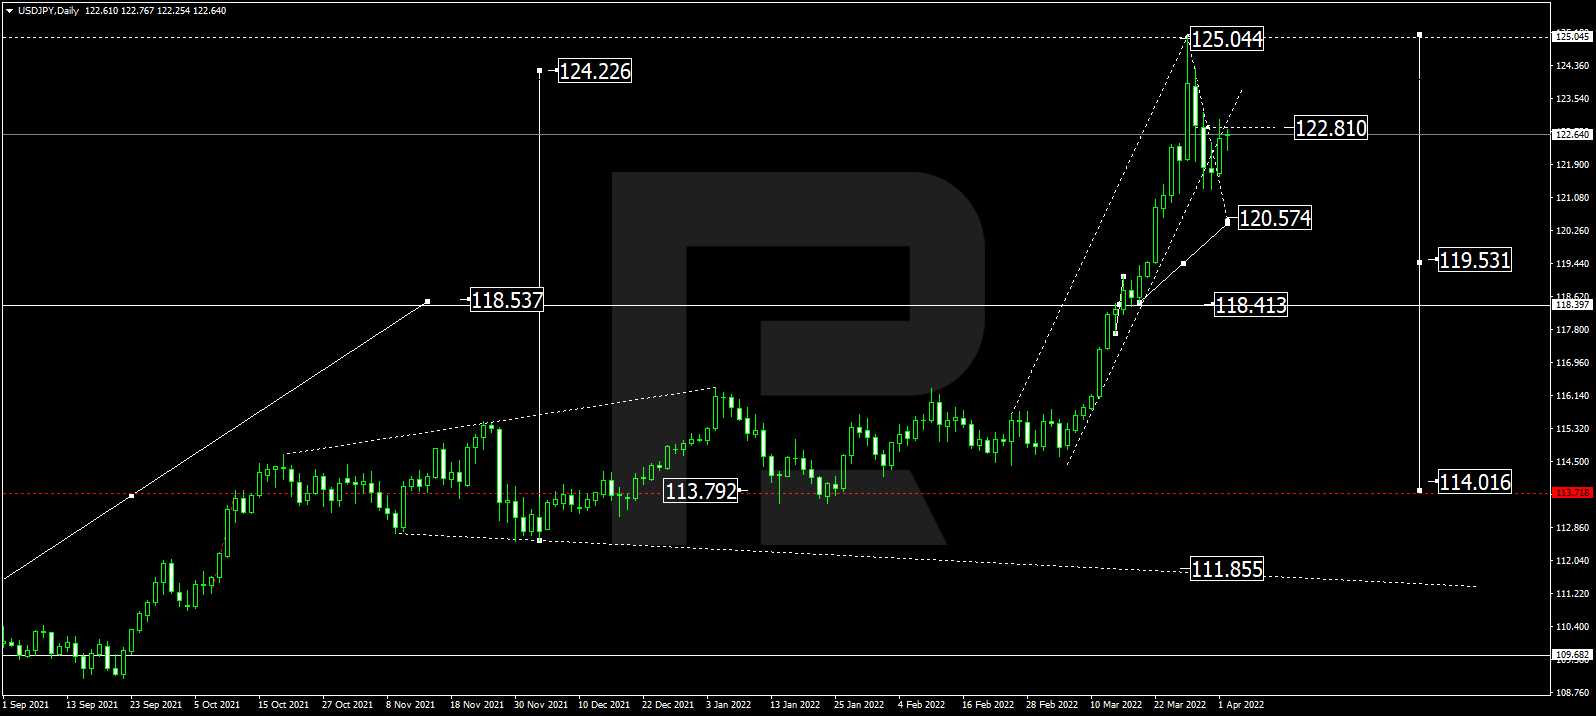
USDJPY, “US Dollar vs Japanese Yen”
In the daily chart, having finished the ascending wave at 118.41 and formed a new consolidation range around this level, USDJPY has broken it to the upside to extend this structure up to 125.04; right now, it is forming the first structure to the downside with the first target at 120.57. Later, the market may correct to test 122.80 from below and then start a new decline to break 118.40. After that, the instrument may continue trading downwards with the target is at 114.00.
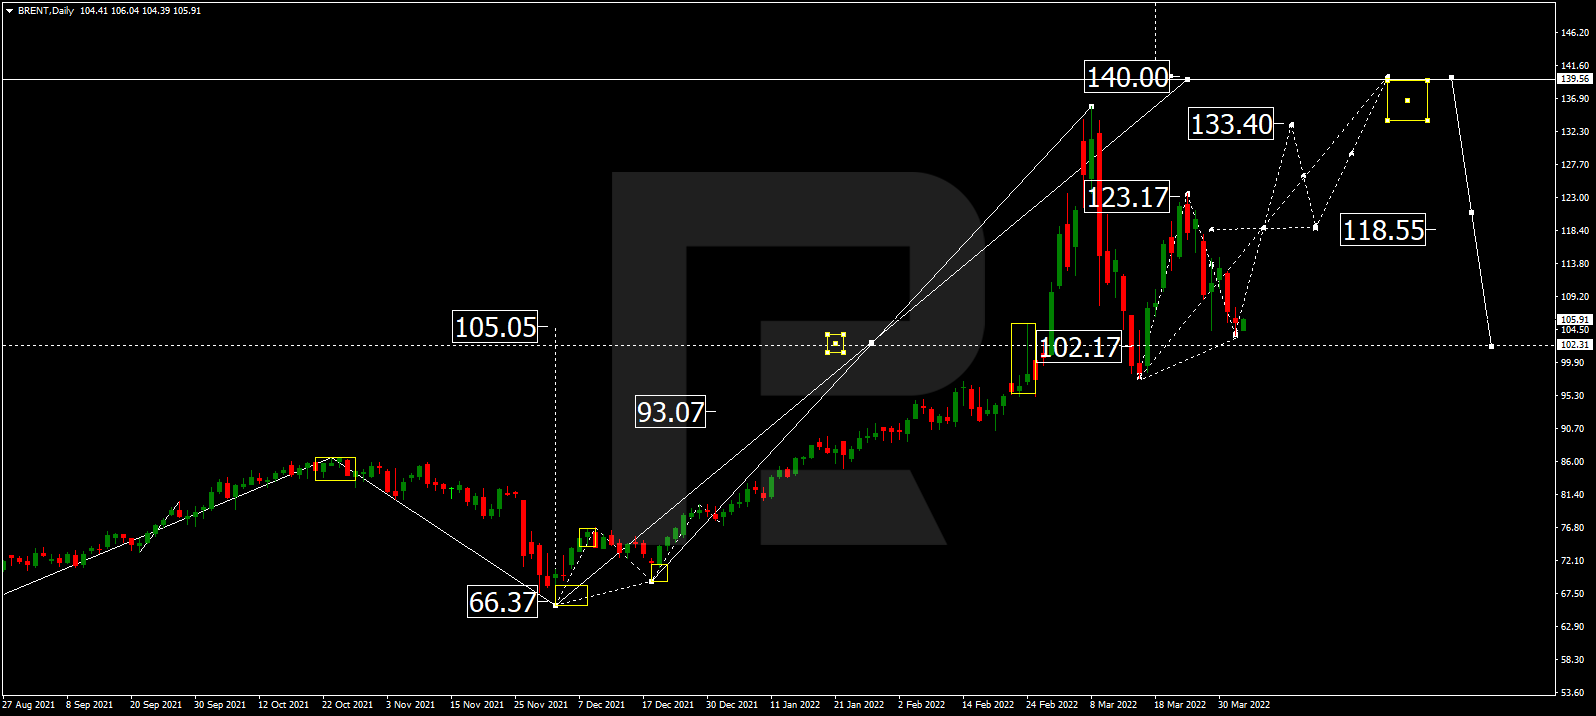
BRENT
As we can see in the daily chart, Brent has completed the correction at 105.00; right now, it is consolidating around this level. Possibly, the asset may form one more ascending wave to break 118.55 and then continue trading upwards with the short-term target at 133.40. Later, the market may start another correction to return to 118.55 and then resume trading upwards to reach 140.00, at least.
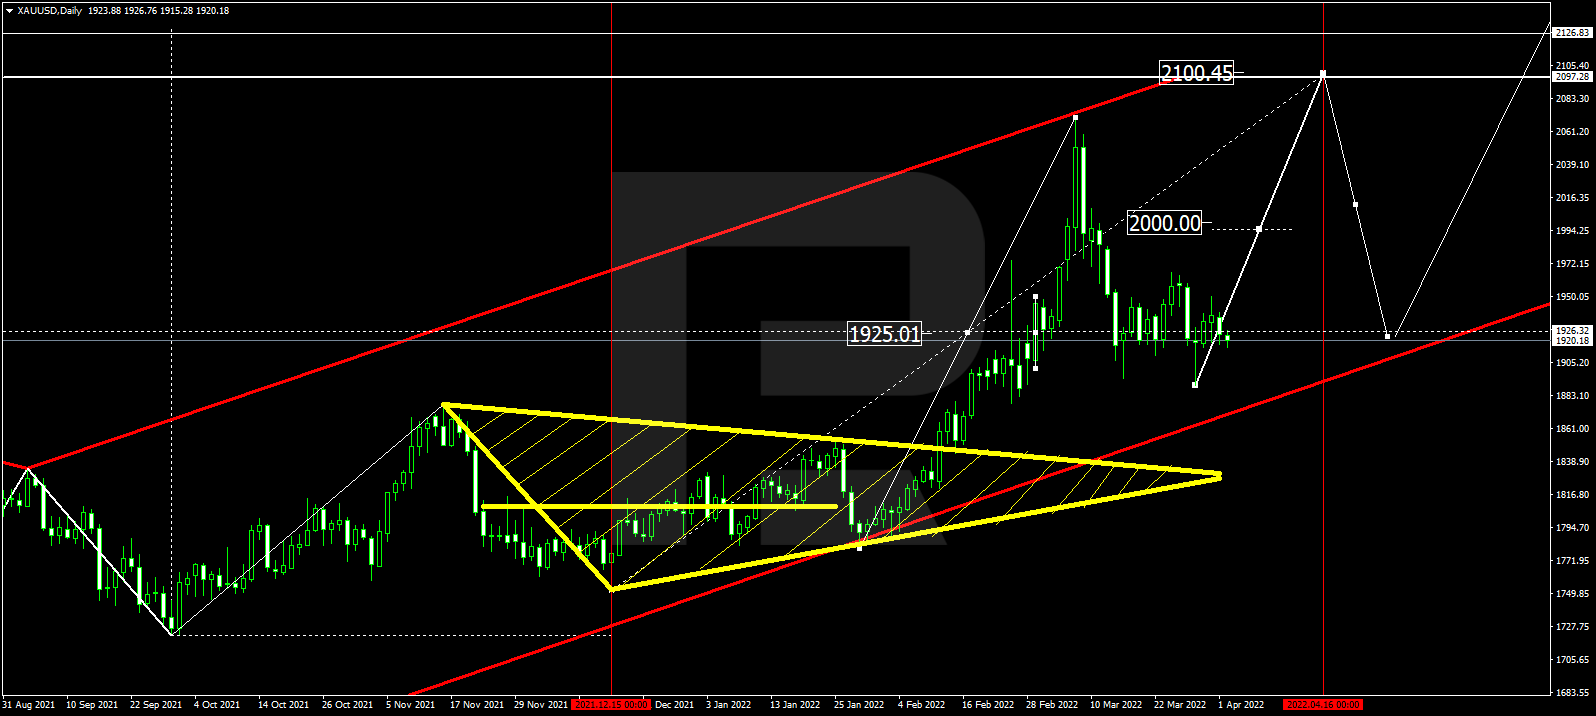
XAUUSD, “Gold vs US Dollar”
In the daily chart, Gold is still consolidating around 1926.30. The main scenario implies further growth towards 2000.00. After that, the instrument may break this level to the upside and form one more ascending structure with the target at 2100.50.
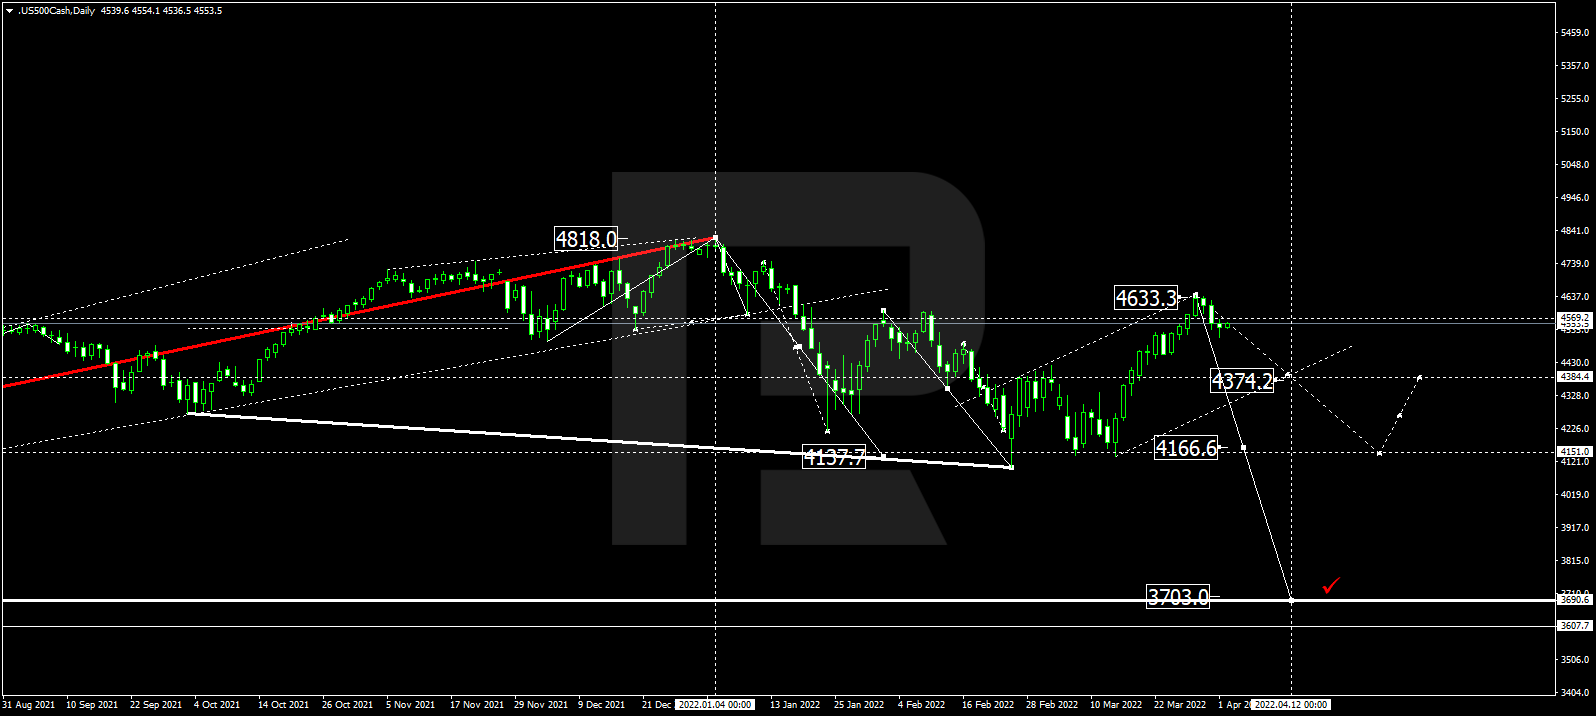
S&P 500
In the daily chart, the S&P index has finished the correctional wave at 4633.3; right now, it is consolidating below this level. Possibly, the asset may form a new descending structure to break 4374.2 and then continue trading downwards with the short-term target at 4166.6.
Article By RoboForex.com
Attention!
Forecasts presented in this section only reflect the author’s private opinion and should not be considered as guidance for trading. RoboForex LP bears no responsibility for trading results based on trading recommendations described in these analytical reviews.

- Natural gas prices are rising amid increasing electricity consumption Jul 1, 2026
- USD/JPY at 40-Year High: Multiple Factors Weigh on the Yen Jul 1, 2026
- Gold Declines: Fed Policy and Geopolitics Weigh Jun 30, 2026
- Oil prices have once again risen above 70 dollars per barrel. The Australian dollar has updated a three‑month low Jun 30, 2026
- EUR/USD: The Advantage Remains with the Dollar Jun 29, 2026
- Escalation of the US–Iran conflict is once again supporting the rise in oil prices Jun 29, 2026
- Oil prices fall back to pre‑war levels. Silver drops to a 7‑month low Jun 25, 2026
- Gold Falls to an Eight-Month Low: This May Not Be the Bottom Jun 25, 2026
- Stock indices came under heavy selling pressure amid growing skepticism about AI investments Jun 24, 2026
- The Pound Is Pressured Not by Politics, but by a Strong US Dollar Jun 24, 2026