Oil prices have hijacked the financial market headlines by surging to levels not seen since 2008.
Brent crude punched above $131 on Tuesday as the United States and Britain moved to ban Russian oil imports. Given how such a move is likely to squeeze supply and create further disruptions in the global energy market, this could propel the oil prices even higher.
Since the start of March, both WTI and brent have appreciated over 30% as the Russian-Ukraine tensions intensified. With oil gaining roughly 65% year-to-date and slowly approaching all-time highs, the next few days promise to be eventful for the global commodity.
Directing our attention away from the fundamentals, the technicals are heavily bullish on the daily, weekly, and monthly timeframes.
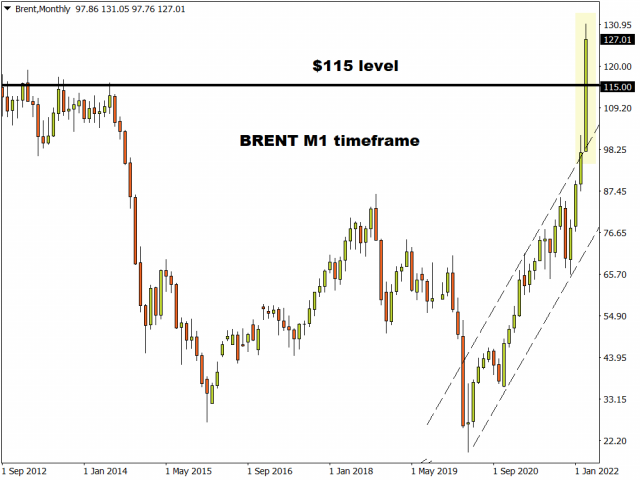
Oil’s explosive momentum on the monthly timeframe resembles a speeding train reaching maximum velocity with geopolitics keeping the engines running at maximum capacity. Things are looking incredibly bullish with the first key level of interest being the all-time high at $147.50. A breakout above this level will open the doors to uncharted territories. If the upside momentum runs out of steam, a decline back towards $115 could be on the cards.
Free Reports:
 Get our Weekly Commitment of Traders Reports - See where the biggest traders (Hedge Funds and Commercial Hedgers) are positioned in the futures markets on a weekly basis.
 Download Our Metatrader 4 Indicators – Put Our Free MetaTrader 4 Custom Indicators on your charts when you join our Weekly Newsletter
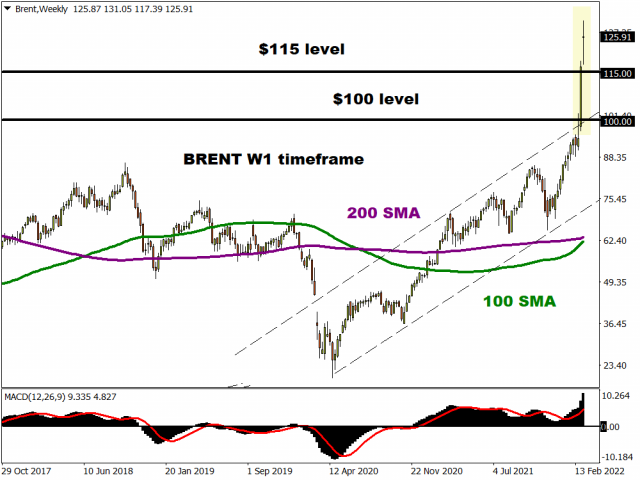
Looking at things on the weekly charts we see a similar story. Prices were already respecting a bullish channel before geopolitics injected bulls with renewed confidence. There have been consistently higher highs and higher lows while the MACD trades above zero. The next major checkpoint for bulls remains the all-time high at $147.50. A failure to push beyond this point could result in a decline back towards $115 and $100, respectively.
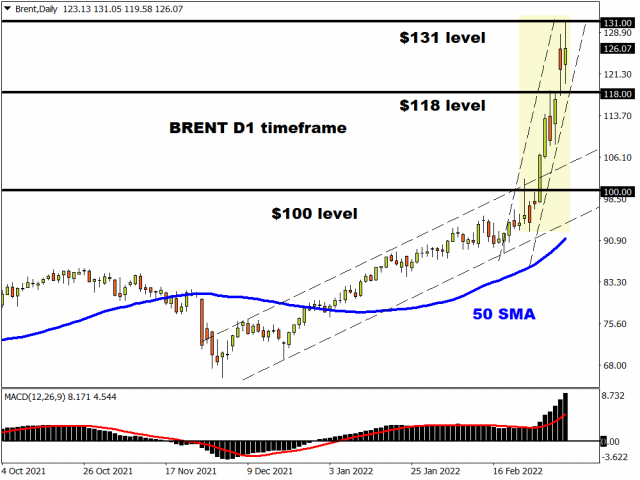
A throwback could on the horizon for brent if $131 becomes a resistance level. Such a development may take prices back towards $118 and $100 before bulls re-enter the scene. The trend remains firmly bullish on the daily charts with lagging and leading indicators signalling further upside. Should the fundamentals continue supporting oil bulls, the path of least resistance should remain north.
Disclaimer: The content in this article comprises personal opinions and should not be construed as containing personal and/or other investment advice and/or an offer of and/or solicitation for any transactions in financial instruments and/or a guarantee and/or prediction of future performance. ForexTime (FXTM), its affiliates, agents, directors, officers or employees do not guarantee the accuracy, validity, timeliness or completeness, of any information or data made available and assume no liability as to any loss arising from any investment based on the same.
 Article by ForexTime
ForexTime Ltd (FXTM) is an award winning international online forex broker regulated by CySEC 185/12 www.forextime.com

- Fast fashion may seem cheap, but it’s taking a costly toll on the planet − and on millions of young customers Nov 25, 2024
- “Trump trades” and geopolitics are the key factors driving market activity Nov 25, 2024
- EUR/USD Amid Slowing European Economy Nov 25, 2024
- COT Metals Charts: Weekly Speculator Changes led by Platinum Nov 23, 2024
- COT Bonds Charts: Speculator Bets led lower by 5-Year & 10-Year Bonds Nov 23, 2024
- COT Soft Commodities Charts: Speculator Bets led lower by Soybean Oil, Soybean Meal & Cotton Nov 23, 2024
- COT Stock Market Charts: Speculator Changes led by S&P500 & Nasdaq Minis Nov 23, 2024
- Bitcoin price is approaching 100,000. Natural gas prices rise due to declining inventories and cold weather Nov 22, 2024
- USD/JPY Awaits Potential Stimulus Impact Nov 22, 2024
- RBNZ may cut the rate by 0.75% next week. NVDA report did not meet investors’ expectations Nov 21, 2024


