
Article By RoboForex.com
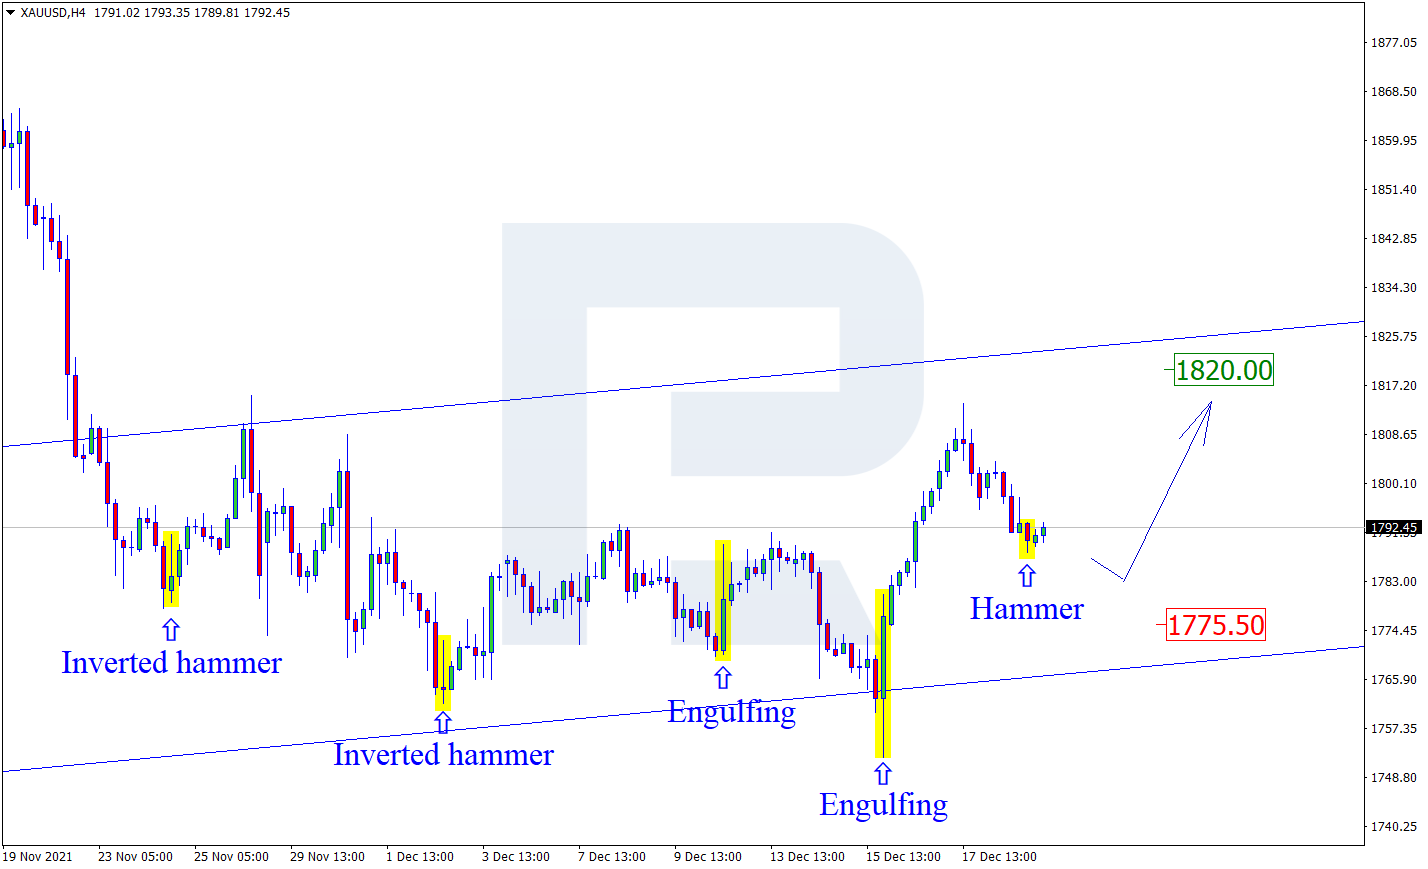
XAUUSD, “Gold vs US Dollar”
As we can see in the H4 chart, the asset is still trading upwards. After forming a Hammer reversal pattern not far from the support level, XAUUSD may reverse and continue forming its rising impulse. In this case, the upside target may be the resistance area at 1820.00. At the same time, an opposite scenario implies that the price may correct towards 1775.00 first and then resume trading upwards.

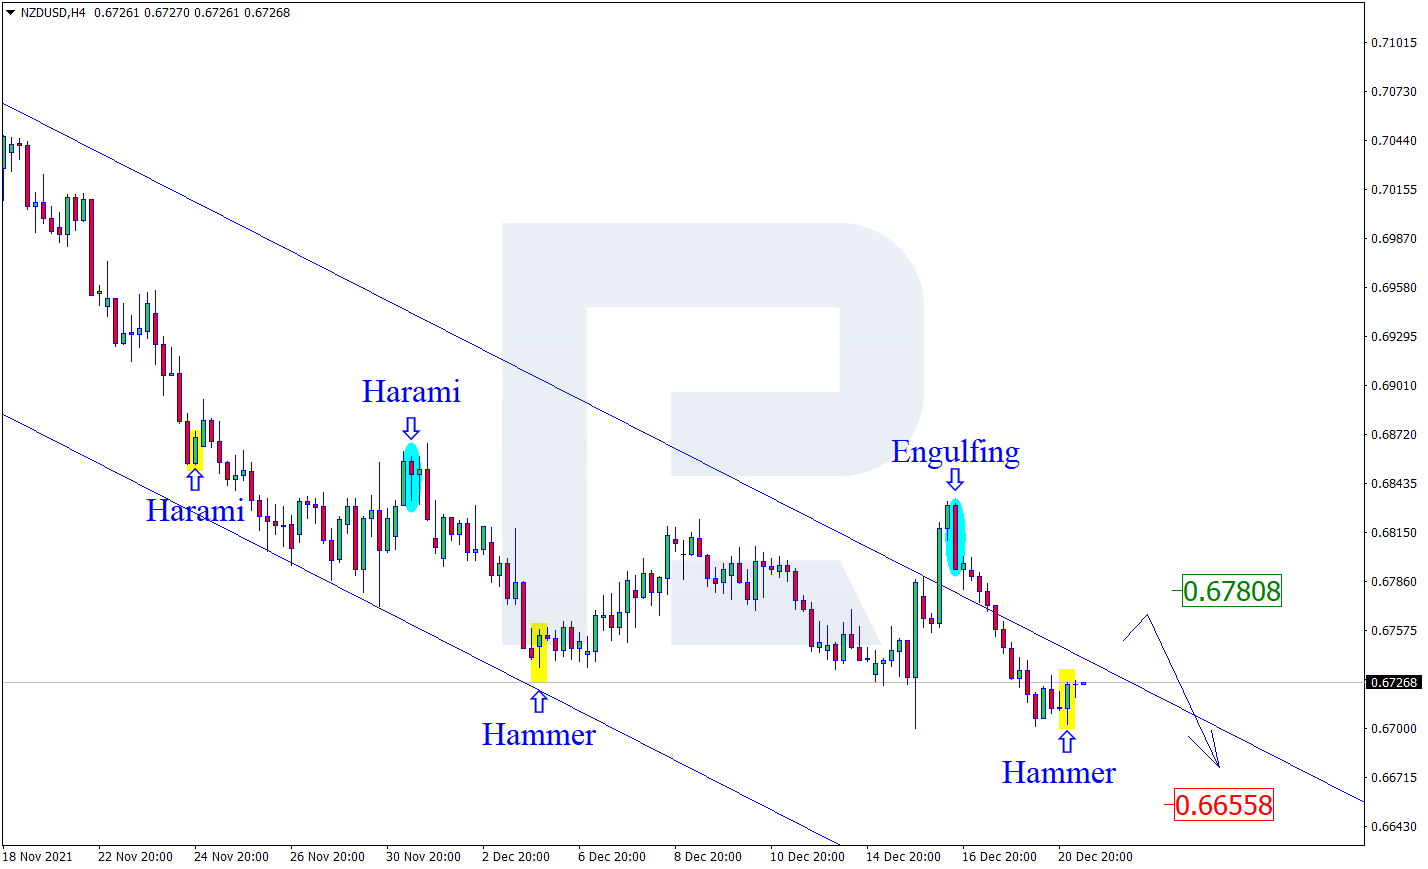
NZDUSD, “New Zealand vs US Dollar”
As we can see in the H4 chart, NZDUSD has formed a Hammer reversal pattern close to the support area. At the moment, the asset may reverse in the form of a new correctional impulse towards the resistance level. In this case, the upside target may be at 0.6780. After that, the asset may rebound from the level and resume moving downwards. However, an alternative scenario implies that the price may continue falling to reach 0.6655 without any corrections towards the resistance level.
Free Reports:
 Sign Up for Our Stock Market Newsletter – Get updated on News, Charts & Rankings of Public Companies when you join our Stocks Newsletter
 Get our Weekly Commitment of Traders Reports - See where the biggest traders (Hedge Funds and Commercial Hedgers) are positioned in the futures markets on a weekly basis.
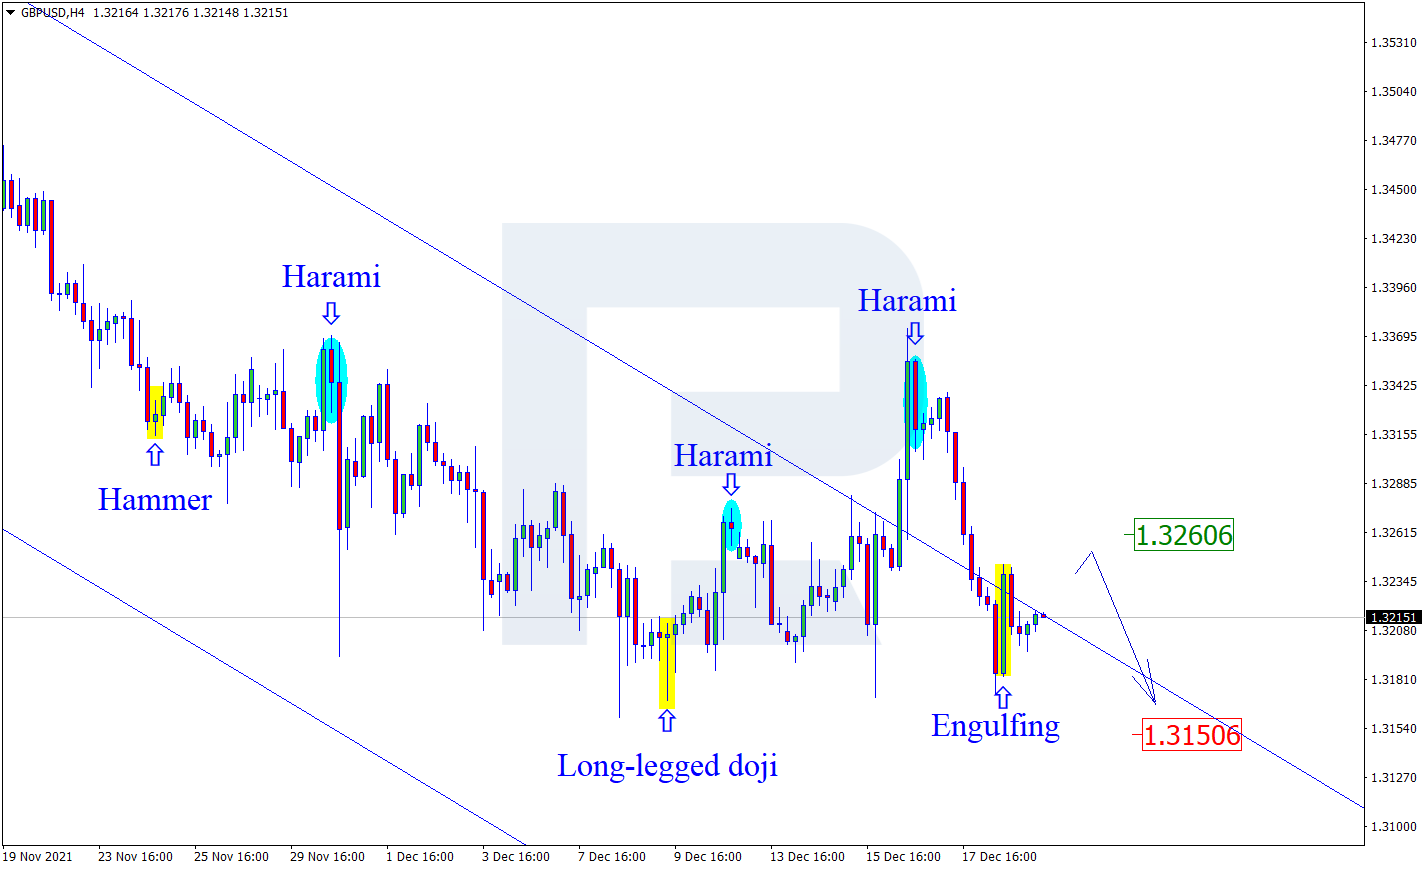
GBPUSD, “Great Britain Pound vs US Dollar”
As we can see in the H4 chart, GBPUSD has formed an Engulfing reversal pattern near the support area. At the moment, the pair may reverse and start a new correctional wave. In this case, the upside correctional target may be at 1.3260. After testing the resistance level, the market may rebound from it and resume trading downwards. Still, there might be an alternative scenario, according to which the asset may continue falling to reach 1.3150 without any corrections towards the resistance level.
Article By RoboForex.com
Attention!
Forecasts presented in this section only reflect the author’s private opinion and should not be considered as guidance for trading. RoboForex LP bears no responsibility for trading results based on trading recommendations described in these analytical reviews.

- Oil prices have fallen to pre‑war levels. AI companies continue to sell off Jul 3, 2026
- Gold Rises Sharply as Markets Reassess Fed Rate Outlook Jul 3, 2026
- The Eurozone has shown a significant slowdown in inflation. Australia has recorded its largest trade deficit since 2015 Jul 2, 2026
- Natural gas prices are rising amid increasing electricity consumption Jul 1, 2026
- USD/JPY at 40-Year High: Multiple Factors Weigh on the Yen Jul 1, 2026
- Gold Declines: Fed Policy and Geopolitics Weigh Jun 30, 2026
- Oil prices have once again risen above 70 dollars per barrel. The Australian dollar has updated a three‑month low Jun 30, 2026
- EUR/USD: The Advantage Remains with the Dollar Jun 29, 2026
- Escalation of the US–Iran conflict is once again supporting the rise in oil prices Jun 29, 2026
- Oil prices fall back to pre‑war levels. Silver drops to a 7‑month low Jun 25, 2026