
Article By RoboForex.com
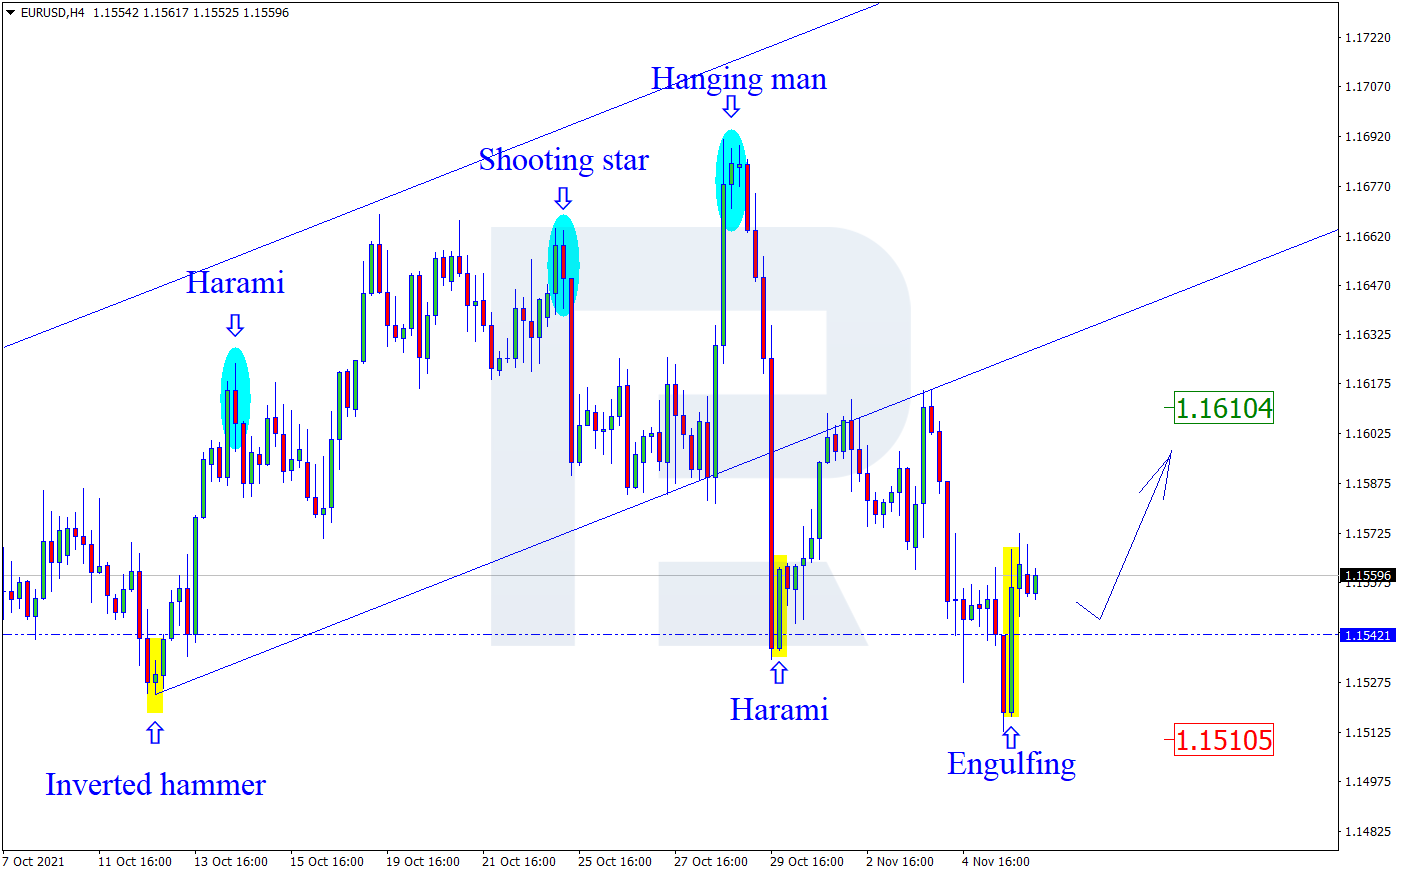
EURUSD, “Euro vs US Dollar”
On H4, near the support level, the pair has formed several reversal candlestick patterns, including a Hammer and an Engulfing. At this stage, going by the pattern, the pair might start an upward momentum. The aim of growth is 1.1610. After a breakaway of the resistance level, the pair can continue with the uptrend. However, the quotations might pull back to 1.1510 before continuing growth.

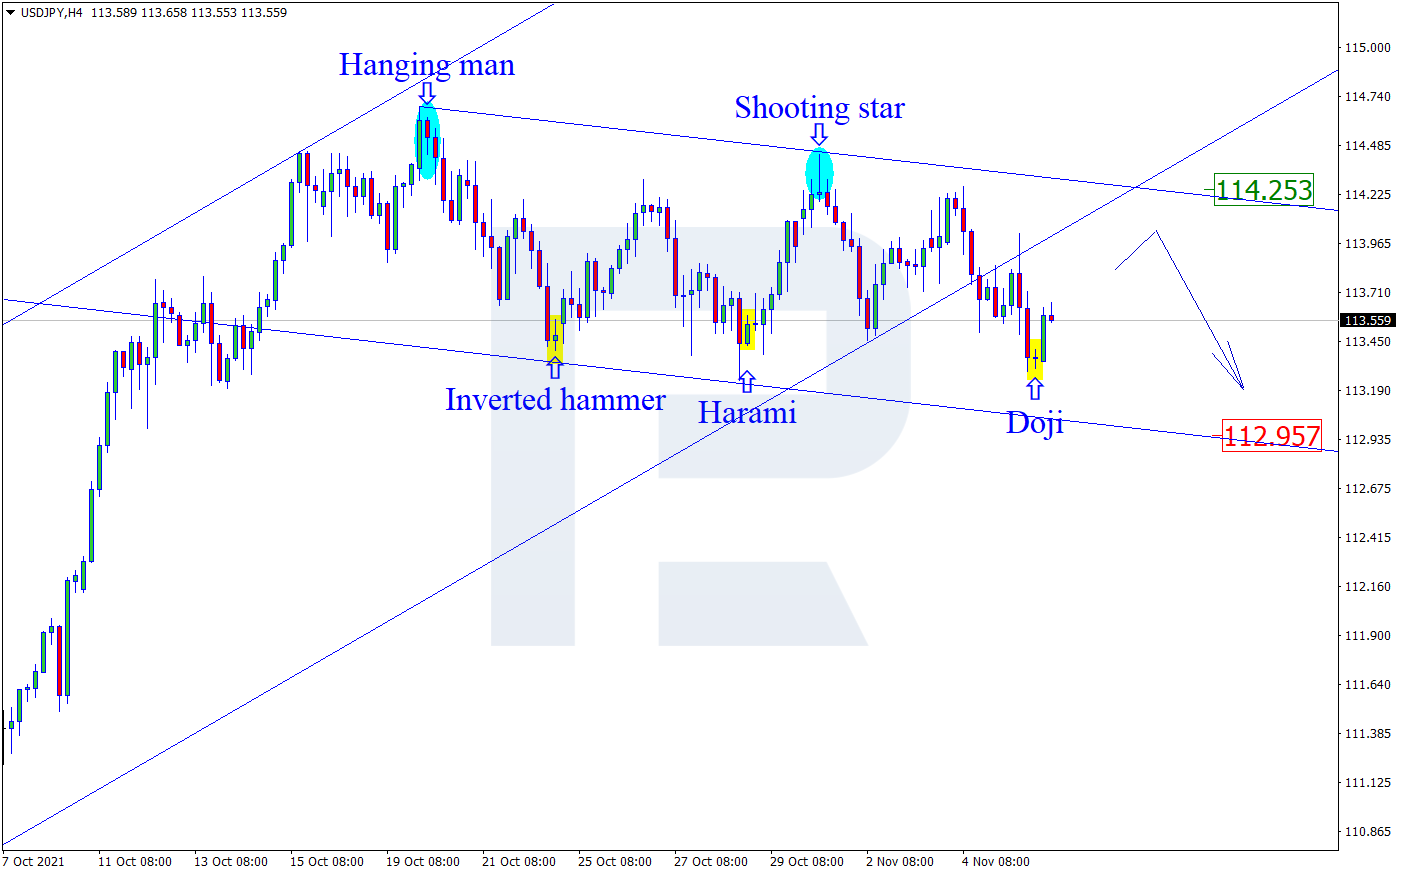
USDJPY, “US Dollar vs Japanese Yen”
On H4, the quotations are testing the resistance level and have formed several reversal patterns, including a Doji. At this stage, going by the patterns, the quotations can start a correction. The aim of the pullback is 114.25. However, the quotations might drop to 112.95 without a pullback to the resistance level.
Free Reports:
 Download Our Metatrader 4 Indicators – Put Our Free MetaTrader 4 Custom Indicators on your charts when you join our Weekly Newsletter
 Get our Weekly Commitment of Traders Reports - See where the biggest traders (Hedge Funds and Commercial Hedgers) are positioned in the futures markets on a weekly basis.
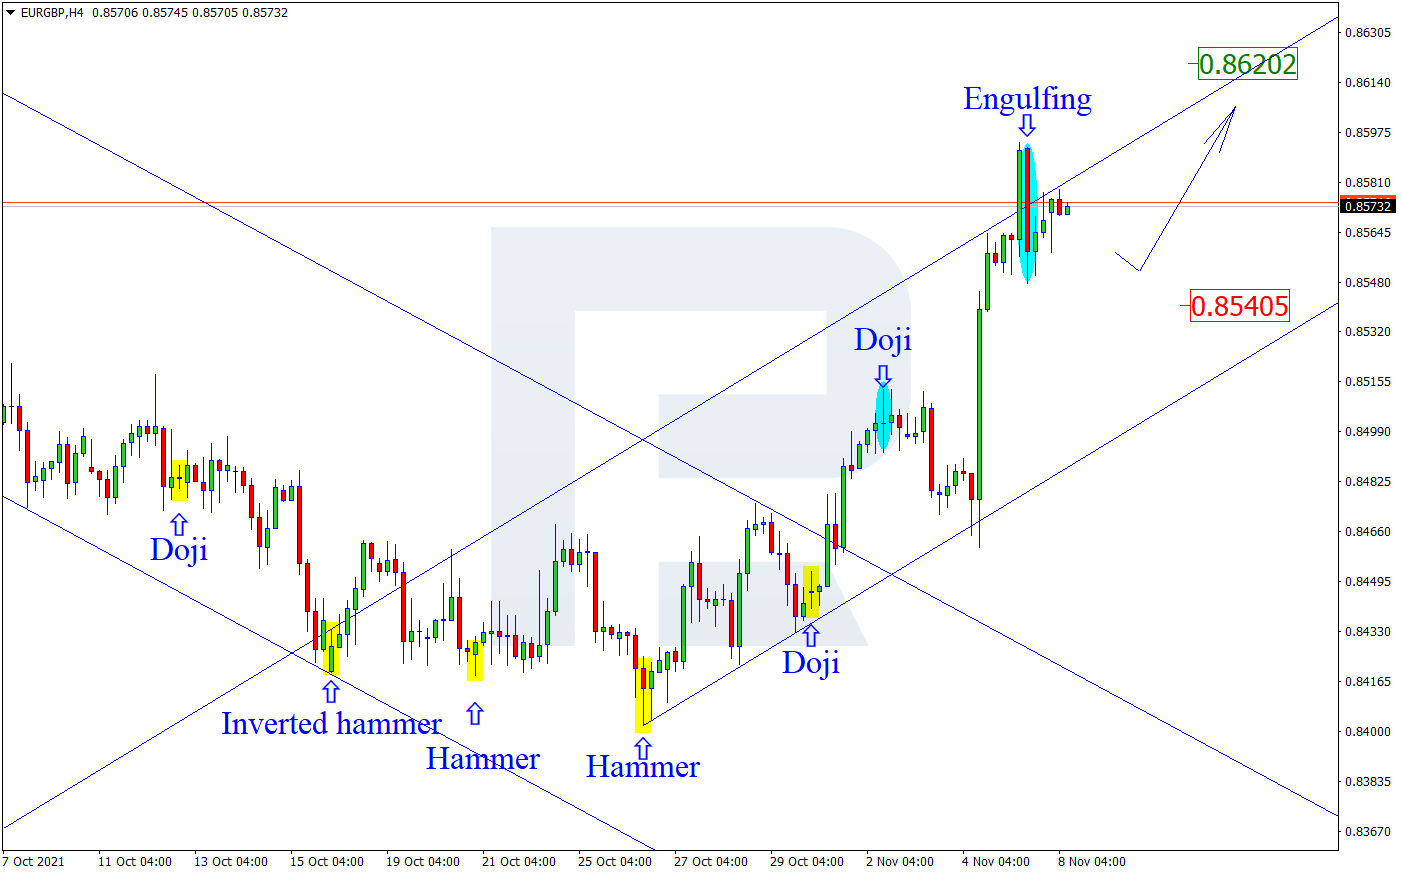
EURGBP, “Euro vs Great Britain Pound”
On H4, at the resistance level, the pair has formed several reversal patterns, including an Engulfing. Currently, going by the signals, the quotations might start a correction. The aim of the pullback is 0.8540. Testing the support level and bouncing off it, the price might continue an uptrend. However, the quotations might grow to 0.8620 without any correction to the support level.
Article By RoboForex.com
Attention!
Forecasts presented in this section only reflect the author’s private opinion and should not be considered as guidance for trading. RoboForex LP bears no responsibility for trading results based on trading recommendations described in these analytical reviews.

- Gold (XAU/USD) Faces Persistent Selling Pressure Jun 10, 2026
- The US technology sector once again came under a wave of selling Jun 10, 2026
- China has shifted to using its own strategic oil reserves Jun 9, 2026
- GBP/USD Remains Under Pressure Despite Attempts to Recover Jun 9, 2026
- SpaceX IPO: Set for $75 billion liftoff Jun 8, 2026
- On Friday, the American stock market experienced one of the strongest crashes in recent times Jun 8, 2026
- EUR/USD at April Lows: What’s Next for the Pair? Jun 8, 2026
- The ceasefire between Israel and Lebanon has reduced the geopolitical premium Jun 5, 2026
- EUR/USD: All Eyes on Non-Farm Payrolls Jun 5, 2026
- The escalation of the conflict in the Middle East put pressure on US and European stock indices Jun 4, 2026