
Article By RoboForex.com
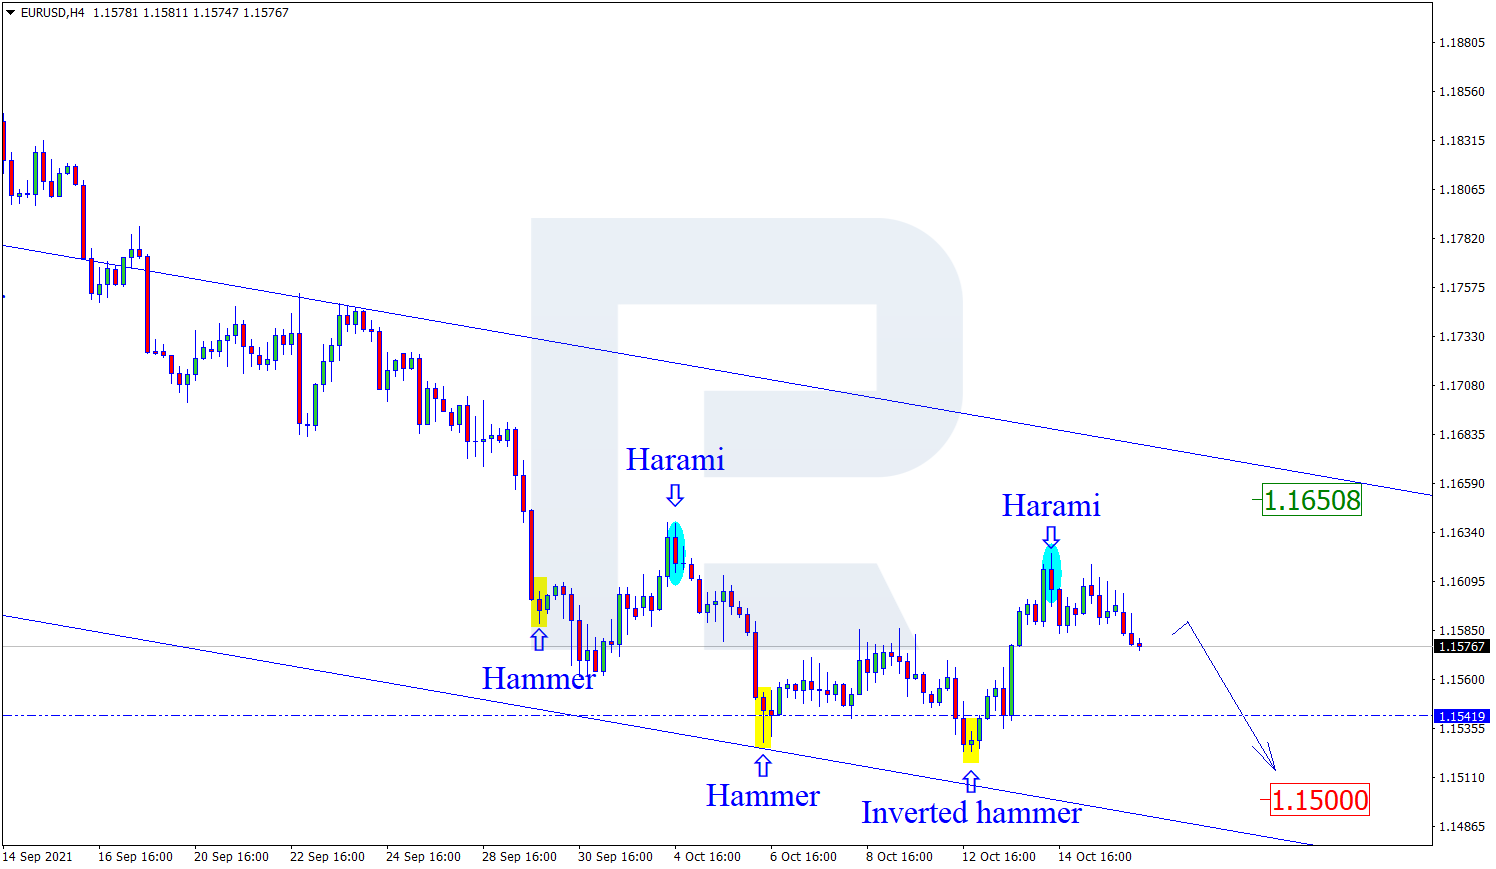
EURUSD, “Euro vs US Dollar”
As we can see in the H4 chart, the asset has completed the correction by forming several reversal patterns, including Harami, close to the resistance level. At the moment, EURUSD may reverse and start a new decline. In this case, the downside target may be at 1.1500. Later, the market may break the support area and continue trading downwards. However, an alternative scenario implies that the price may correct to reach 1.1650 first and then resume trading downwards.

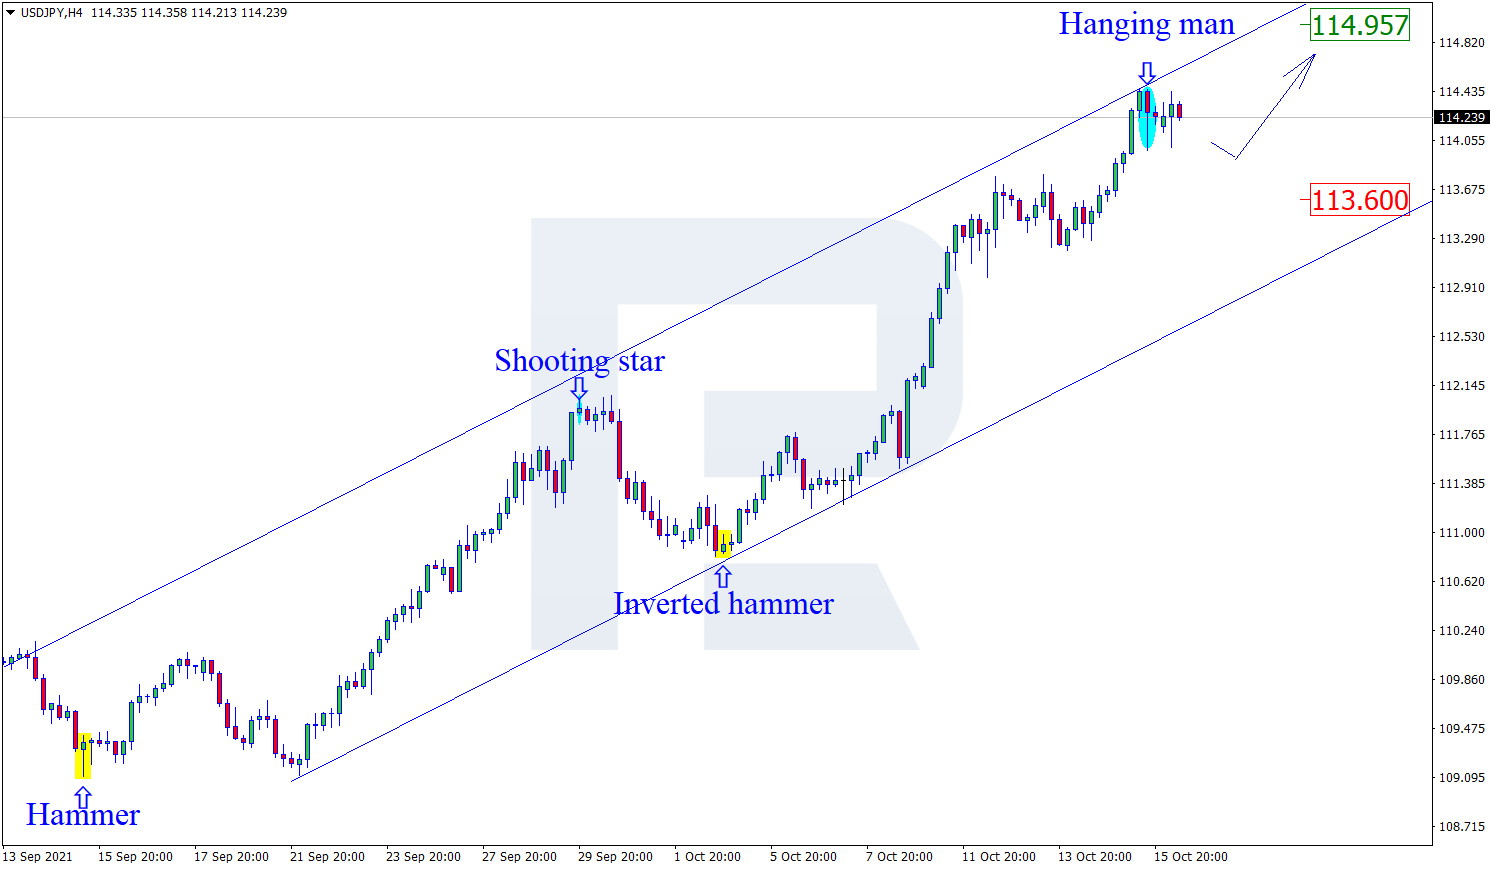
USDJPY, “US Dollar vs Japanese Yen”
As we can see in the H4 chart, USDJPY has formed several reversal patterns, for example, Hanging Man, while testing another resistance area. At the moment, USDJPY is reversing and may start a new correctional impulse towards the support level. In this case, the correctional target may be at 113.60. At the same time, an opposite scenario implies that the price may continue growing towards 114.95 without any corrections.
Free Reports:
 Get our Weekly Commitment of Traders Reports - See where the biggest traders (Hedge Funds and Commercial Hedgers) are positioned in the futures markets on a weekly basis.
 Sign Up for Our Stock Market Newsletter – Get updated on News, Charts & Rankings of Public Companies when you join our Stocks Newsletter
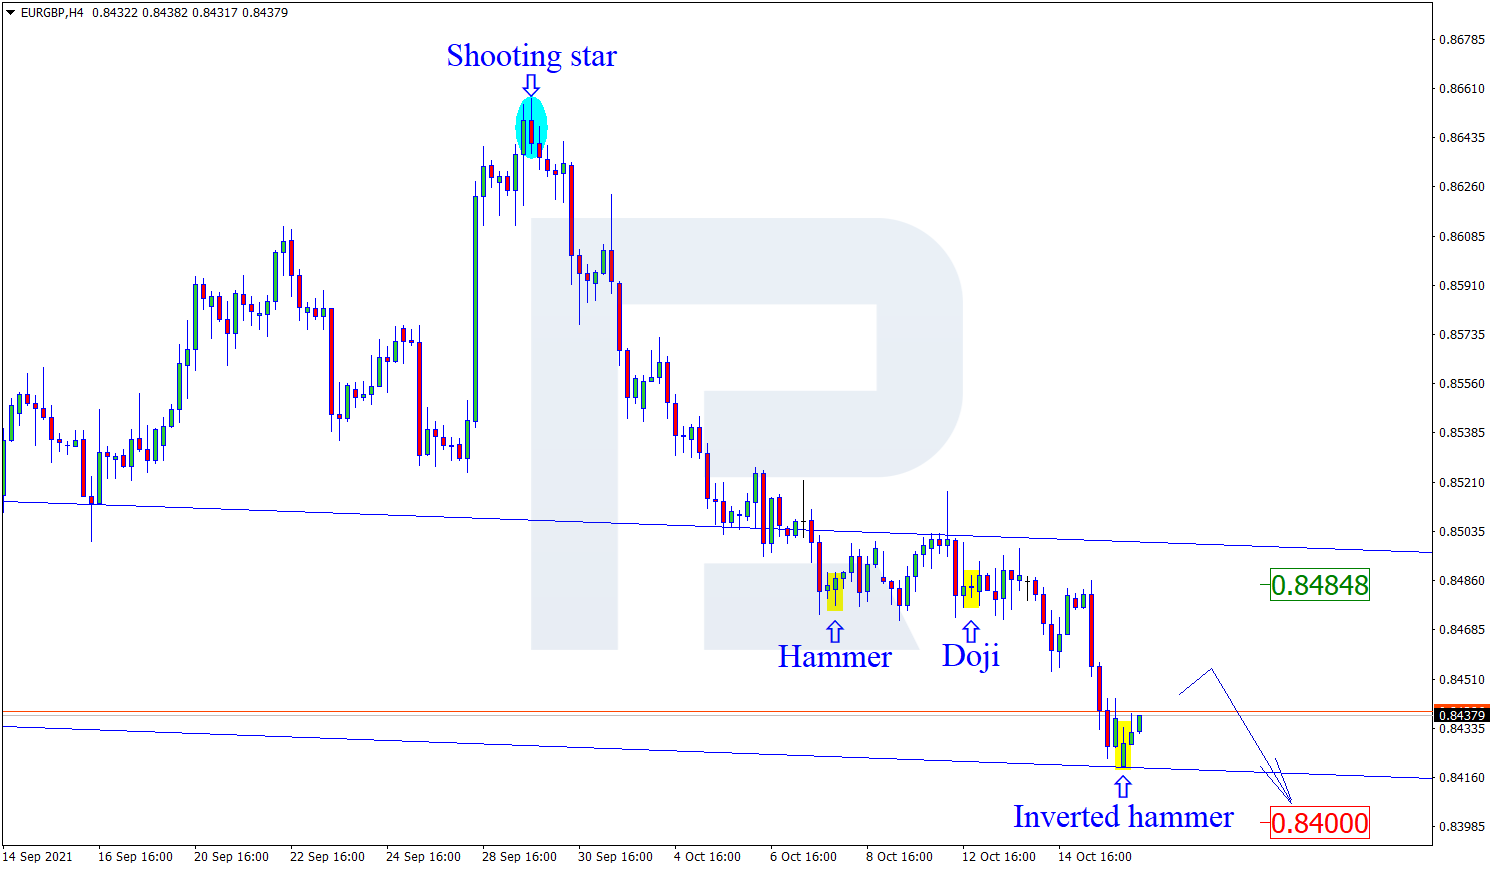
EURGBP, “Euro vs Great Britain Pound”
As we can see in the H4 chart, after forming several reversal patterns, such as Inverted Hammer, near the support level, EURGBP may reverse and start a new pullback. In this case, the correctional target may be at 0.8484. Later, the market may test the resistance area, rebound from it, and resume the descending tendency. Still, there might be an alternative scenario, according to which the asset may continue falling to reach 0.8400 without testing the resistance area.
Article By RoboForex.com
Attention!
Forecasts presented in this section only reflect the author’s private opinion and should not be considered as guidance for trading. RoboForex LP bears no responsibility for trading results based on trading recommendations described in these analytical reviews.

- Gold (XAU/USD) Faces Persistent Selling Pressure Jun 10, 2026
- The US technology sector once again came under a wave of selling Jun 10, 2026
- China has shifted to using its own strategic oil reserves Jun 9, 2026
- GBP/USD Remains Under Pressure Despite Attempts to Recover Jun 9, 2026
- SpaceX IPO: Set for $75 billion liftoff Jun 8, 2026
- On Friday, the American stock market experienced one of the strongest crashes in recent times Jun 8, 2026
- EUR/USD at April Lows: What’s Next for the Pair? Jun 8, 2026
- The ceasefire between Israel and Lebanon has reduced the geopolitical premium Jun 5, 2026
- EUR/USD: All Eyes on Non-Farm Payrolls Jun 5, 2026
- The escalation of the conflict in the Middle East put pressure on US and European stock indices Jun 4, 2026