
Article By RoboForex.com
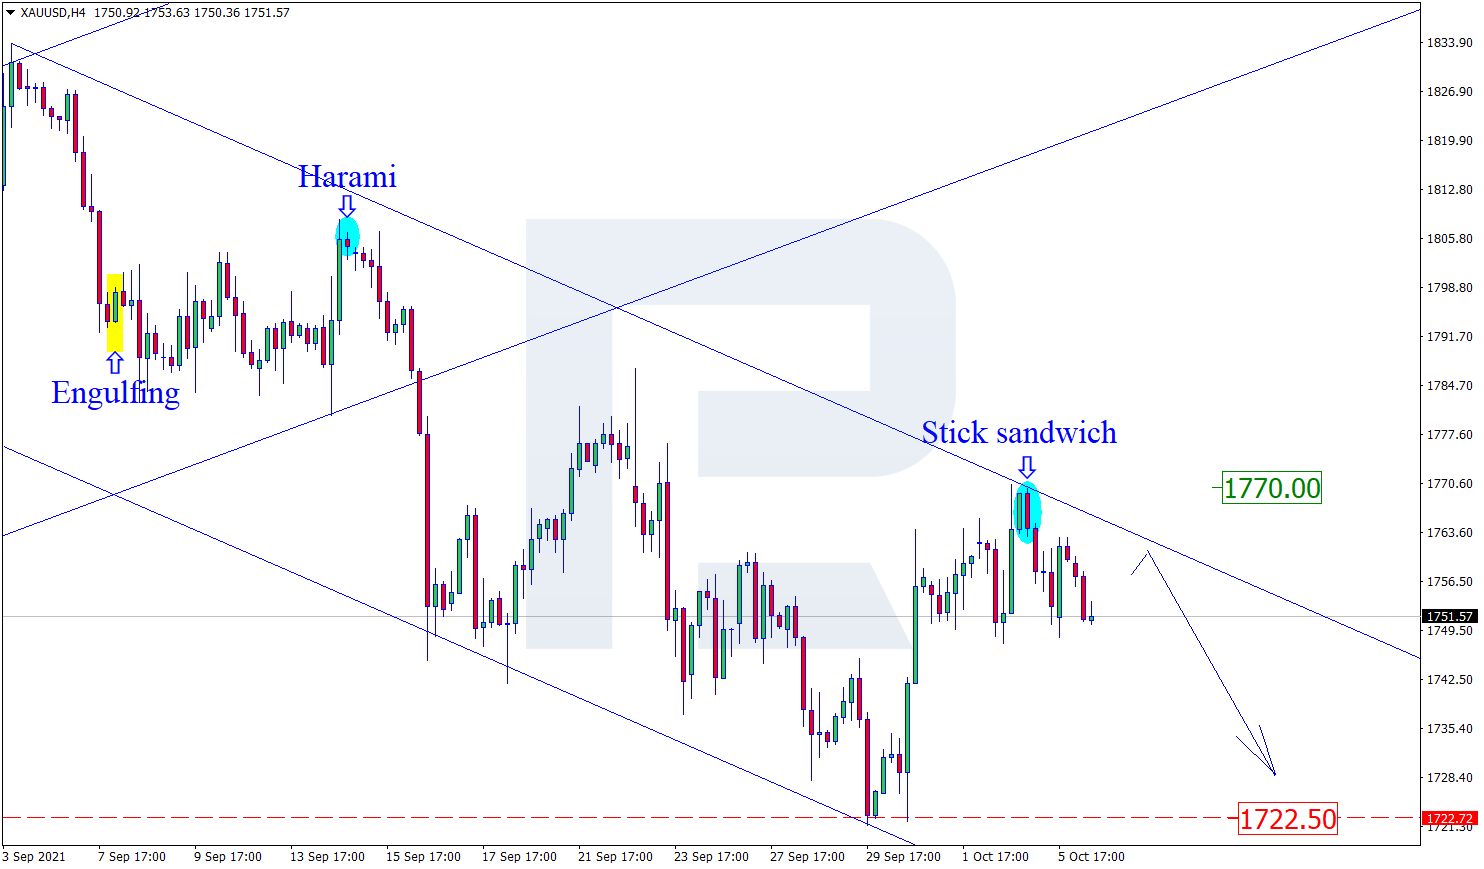
XAUUSD, “Gold vs US Dollar”
As we can see in the H4 chart, the asset is finishing the correctional wave. After forming several reversal patterns, such as Stick Sandwich, not far from the resistance level, XAUUSD may reverse and resume falling. In this case, the downside target may be the support area at 1722.50. At the same time, an opposite scenario implies that the price may grow towards 1770.00 first and then resume trading downwards.

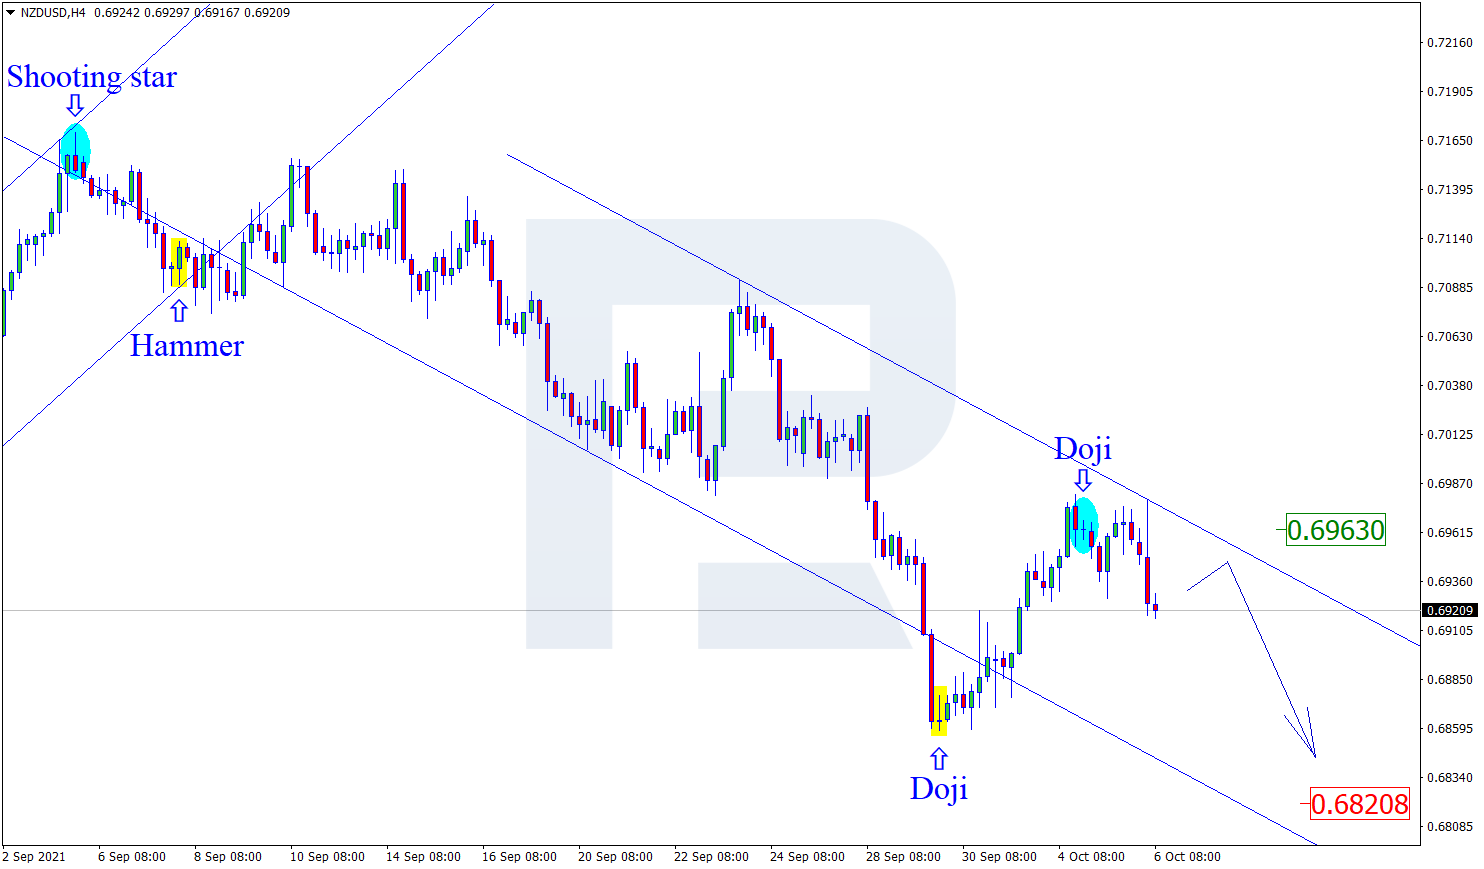
NZDUSD, “New Zealand vs US Dollar”
As we can see in the H4 chart, after testing the resistance area, NZDUSD has formed several reversal patterns, such as Doji. At the moment, the asset is reversing in the form of a new decline. In this case, the downside target may be the support level at 0.6820. After that, the asset may break it and continue moving downwards. However, an alternative scenario implies that the price may grow to reach 0.6963 before resuming its descending tendency.
Free Reports:
 Sign Up for Our Stock Market Newsletter – Get updated on News, Charts & Rankings of Public Companies when you join our Stocks Newsletter
 Get our Weekly Commitment of Traders Reports - See where the biggest traders (Hedge Funds and Commercial Hedgers) are positioned in the futures markets on a weekly basis.
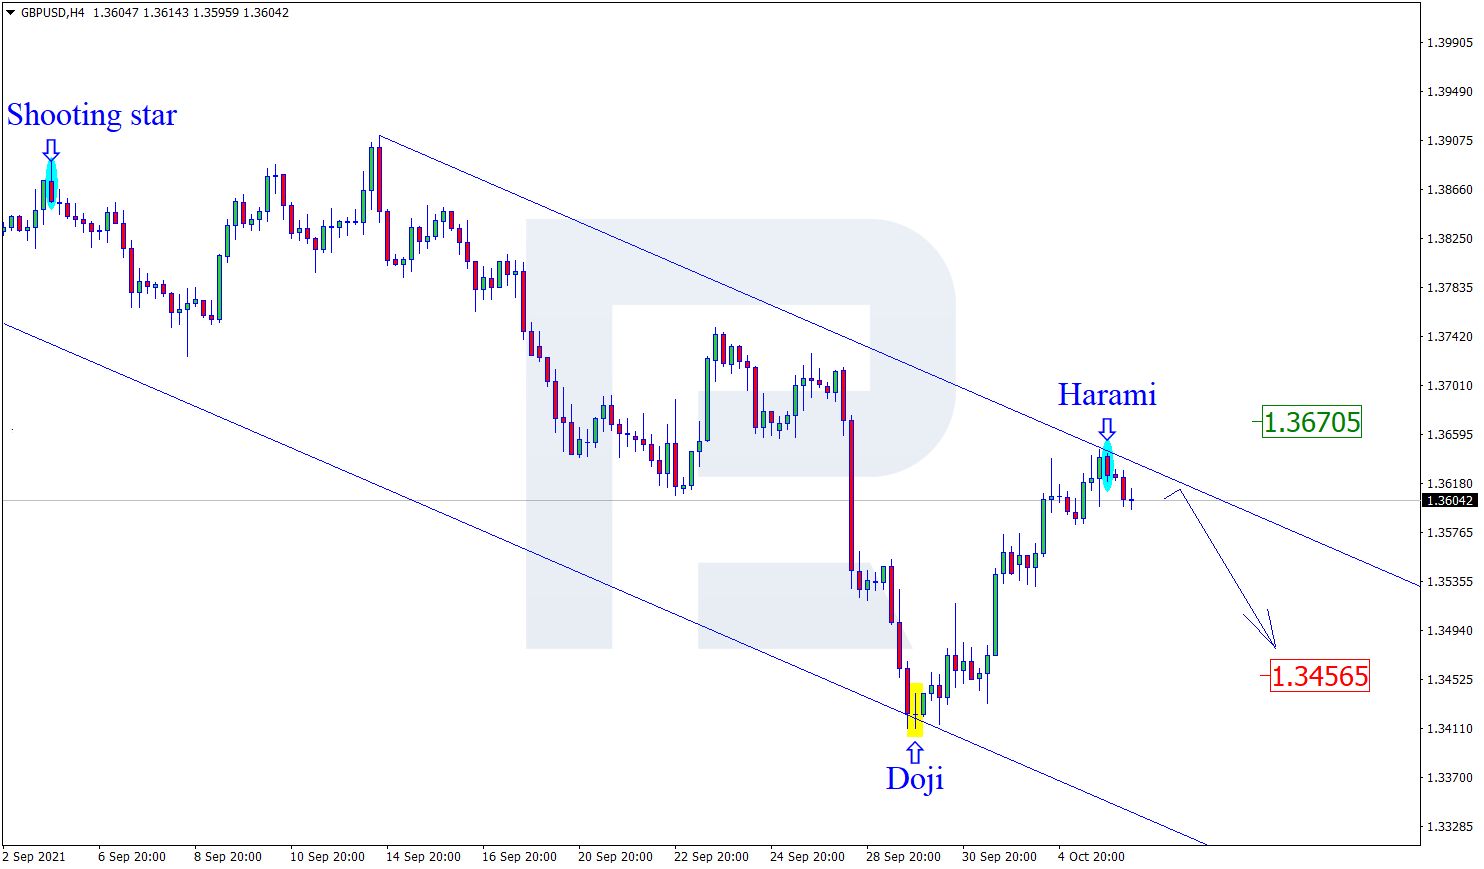
GBPUSD, “Great Britain Pound vs US Dollar”
As we can see in the H4 chart, the asset is forming another descending wave from the channel’s upside border. By now, GBPUSD has formed several reversal patterns, such as Harami, not far from the resistance area. At the moment, the pair is reversing in the form of a new decline. In this case, the downside target may be at 1.3456. After testing this level, the market may break it and continue falling. Still, there might be an alternative scenario, according to which the asset may correct towards 1.3670 before reversing.
Article By RoboForex.com
Attention!
Forecasts presented in this section only reflect the author’s private opinion and should not be considered as guidance for trading. RoboForex LP bears no responsibility for trading results based on trading recommendations described in these analytical reviews.

- The ceasefire between Israel and Lebanon has reduced the geopolitical premium Jun 5, 2026
- EUR/USD: All Eyes on Non-Farm Payrolls Jun 5, 2026
- The escalation of the conflict in the Middle East put pressure on US and European stock indices Jun 4, 2026
- Gold Remains Under Pressure, but a Rebound Is Still Possible Jun 4, 2026
- Bitcoin drops below the psychological $70,000 level. The US stock indices hit new record highs Jun 3, 2026
- EUR/USD on Edge as Markets Await Key Employment Data Jun 3, 2026
- Oil prices surged again amid rumors of a freeze in diplomacy between the United States and Iran Jun 2, 2026
- GBP/USD in a State of Uncertainty: Risks Remain, but Market Reactions Are Muted Jun 2, 2026
- The US stock indices once again finished the trading session at new all‑time highs Jun 1, 2026
- USD/JPY Approaches 160.00: Is Another Intervention Coming? Jun 1, 2026