
By CountingPips.com COT Home | Data Tables | Data Downloads | Newsletter
Here are the latest charts and statistics for the Commitment of Traders (COT) data published by the Commodities Futures Trading Commission (CFTC).
The latest COT data is updated through Tuesday August 24 2021 and shows a quick view of how large traders (for-profit speculators and commercial entities) were positioned in the futures markets.
3-Month Eurodollars Futures:
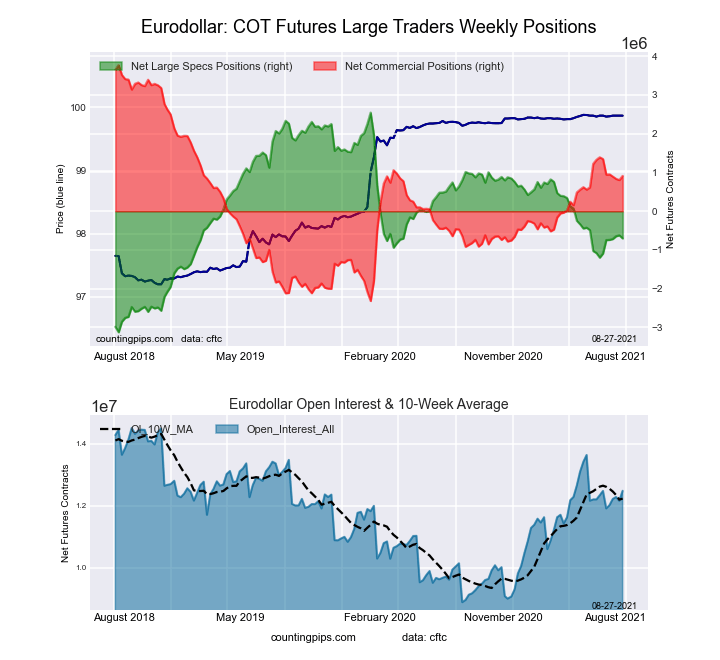 The 3-Month Eurodollars large speculator standing this week equaled a net position of -702,015 contracts in the data reported through Tuesday. This was a weekly lowering of -78,587 contracts from the previous week which had a total of -623,428 net contracts.
This week’s current strength score (the trader positioning range over the past three years, measured from 0 to 100) shows the speculators are currently Bearish with a score of 42.7 percent. The commercials are Bullish with a score of 53.0 percent and the small traders (not shown in chart) are Bullish with a score of 75.8 percent.
| 3-Month Eurodollars Statistics | SPECULATORS | COMMERCIALS | SMALL TRADERS |
| – Percent of Open Interest Longs: | 17.2 | 59.6 | 5.0 |
| – Percent of Open Interest Shorts: | 22.8 | 52.3 | 6.7 |
| – Net Position: | -702,015 | 909,814 | -207,799 |
| – Gross Longs: | 2,140,571 | 7,436,636 | 629,349 |
| – Gross Shorts: | 2,842,586 | 6,526,822 | 837,148 |
| – Long to Short Ratio: | 0.8 to 1 | 1.1 to 1 | 0.8 to 1 |
| NET POSITION TREND: | |||
| – COT Index Score (3 Year Range Pct): | 42.7 | 53.0 | 75.8 |
| – COT Index Reading (3 Year Range): | Bearish | Bullish | Bullish |
| NET POSITION MOVEMENT INDEX: | |||
| – 6-Week Change in Strength Index: | 6.9 | -7.2 | 5.9 |
Free Reports:
 Get our Weekly Commitment of Traders Reports - See where the biggest traders (Hedge Funds and Commercial Hedgers) are positioned in the futures markets on a weekly basis.
 Sign Up for Our Stock Market Newsletter – Get updated on News, Charts & Rankings of Public Companies when you join our Stocks Newsletter
30-Day Federal Funds Futures:
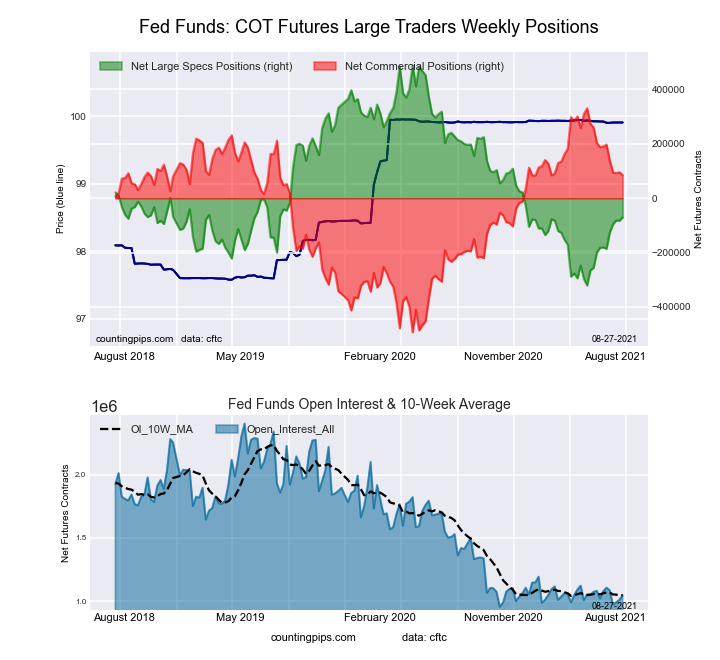 The 30-Day Federal Funds large speculator standing this week equaled a net position of -70,439 contracts in the data reported through Tuesday. This was a weekly increase of 12,650 contracts from the previous week which had a total of -83,089 net contracts.
This week’s current strength score (the trader positioning range over the past three years, measured from 0 to 100) shows the speculators are currently Bearish with a score of 30.9 percent. The commercials are Bullish with a score of 70.1 percent and the small traders (not shown in chart) are Bearish with a score of 45.5 percent.
| 30-Day Federal Funds Statistics | SPECULATORS | COMMERCIALS | SMALL TRADERS |
| – Percent of Open Interest Longs: | 6.0 | 75.5 | 2.1 |
| – Percent of Open Interest Shorts: | 12.7 | 67.4 | 3.5 |
| – Net Position: | -70,439 | 84,483 | -14,044 |
| – Gross Longs: | 62,457 | 788,837 | 22,378 |
| – Gross Shorts: | 132,896 | 704,354 | 36,422 |
| – Long to Short Ratio: | 0.5 to 1 | 1.1 to 1 | 0.6 to 1 |
| NET POSITION TREND: | |||
| – COT Index Score (3 Year Range Pct): | 30.9 | 70.1 | 45.5 |
| – COT Index Reading (3 Year Range): | Bearish | Bullish | Bearish |
| NET POSITION MOVEMENT INDEX: | |||
| – 6-Week Change in Strength Index: | 13.6 | -12.9 | -8.3 |
2-Year Treasury Note Futures:
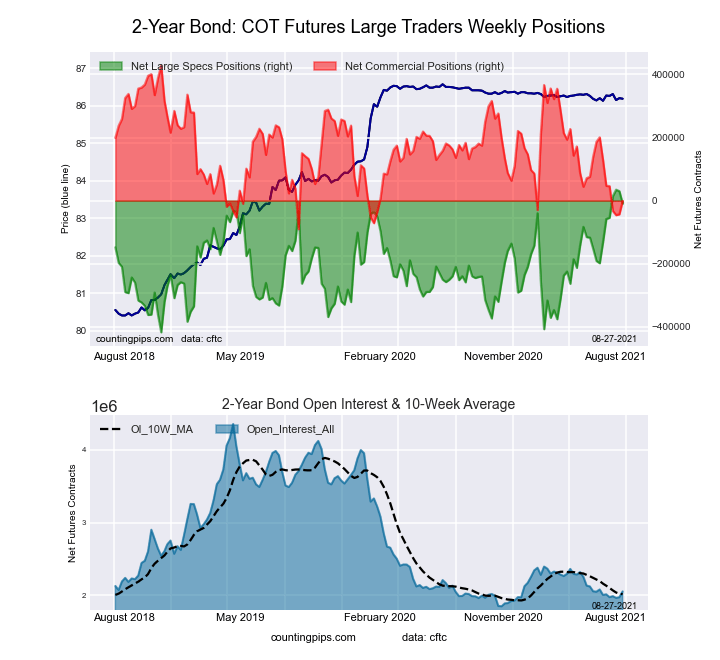 The 2-Year Treasury Note large speculator standing this week equaled a net position of -9,366 contracts in the data reported through Tuesday. This was a weekly reduction of -39,563 contracts from the previous week which had a total of 30,197 net contracts.
This week’s current strength score (the trader positioning range over the past three years, measured from 0 to 100) shows the speculators are currently Bullish-Extreme with a score of 90.3 percent. The commercials are Bearish-Extreme with a score of 17.3 percent and the small traders (not shown in chart) are Bearish with a score of 35.0 percent.
| 2-Year Treasury Note Statistics | SPECULATORS | COMMERCIALS | SMALL TRADERS |
| – Percent of Open Interest Longs: | 18.5 | 67.3 | 7.6 |
| – Percent of Open Interest Shorts: | 18.9 | 67.3 | 7.1 |
| – Net Position: | -9,366 | -824 | 10,190 |
| – Gross Longs: | 379,752 | 1,381,496 | 156,602 |
| – Gross Shorts: | 389,118 | 1,382,320 | 146,412 |
| – Long to Short Ratio: | 1.0 to 1 | 1.0 to 1 | 1.1 to 1 |
| NET POSITION TREND: | |||
| – COT Index Score (3 Year Range Pct): | 90.3 | 17.3 | 35.0 |
| – COT Index Reading (3 Year Range): | Bullish-Extreme | Bearish-Extreme | Bearish |
| NET POSITION MOVEMENT INDEX: | |||
| – 6-Week Change in Strength Index: | 27.0 | -24.9 | 4.4 |
5-Year Treasury Note Futures:
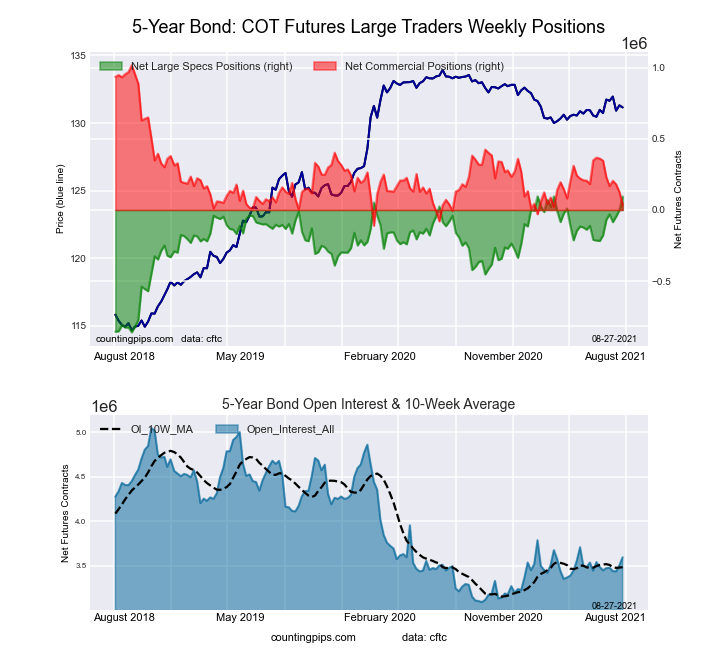 The 5-Year Treasury Note large speculator standing this week equaled a net position of 95,201 contracts in the data reported through Tuesday. This was a weekly lift of 97,283 contracts from the previous week which had a total of -2,082 net contracts.
This week’s current strength score (the trader positioning range over the past three years, measured from 0 to 100) shows the speculators are currently Bullish-Extreme with a score of 100.0 percent. The commercials are Bearish-Extreme with a score of 13.1 percent and the small traders (not shown in chart) are Bearish-Extreme with a score of 15.1 percent.
| 5-Year Treasury Note Statistics | SPECULATORS | COMMERCIALS | SMALL TRADERS |
| – Percent of Open Interest Longs: | 13.4 | 72.6 | 9.1 |
| – Percent of Open Interest Shorts: | 10.7 | 71.5 | 12.8 |
| – Net Position: | 95,201 | 37,665 | -132,866 |
| – Gross Longs: | 481,119 | 2,610,347 | 327,344 |
| – Gross Shorts: | 385,918 | 2,572,682 | 460,210 |
| – Long to Short Ratio: | 1.2 to 1 | 1.0 to 1 | 0.7 to 1 |
| NET POSITION TREND: | |||
| – COT Index Score (3 Year Range Pct): | 100.0 | 13.1 | 15.1 |
| – COT Index Reading (3 Year Range): | Bullish-Extreme | Bearish-Extreme | Bearish-Extreme |
| NET POSITION MOVEMENT INDEX: | |||
| – 6-Week Change in Strength Index: | 28.6 | -27.4 | 15.1 |
10-Year Treasury Note Futures:
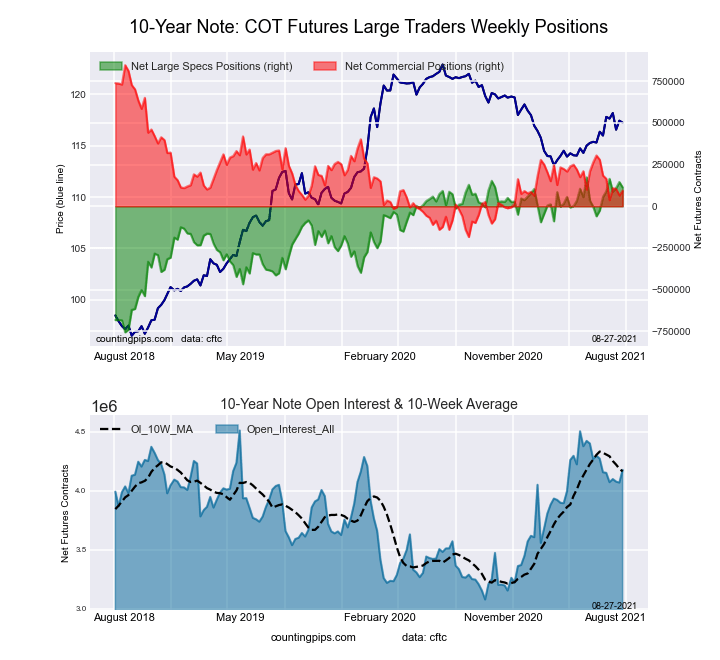 The 10-Year Treasury Note large speculator standing this week equaled a net position of 113,312 contracts in the data reported through Tuesday. This was a weekly decrease of -31,904 contracts from the previous week which had a total of 145,216 net contracts.
This week’s current strength score (the trader positioning range over the past three years, measured from 0 to 100) shows the speculators are currently Bullish-Extreme with a score of 93.5 percent. The commercials are Bearish with a score of 27.0 percent and the small traders (not shown in chart) are Bearish-Extreme with a score of 19.4 percent.
| 10-Year Treasury Note Statistics | SPECULATORS | COMMERCIALS | SMALL TRADERS |
| – Percent of Open Interest Longs: | 21.2 | 67.0 | 9.2 |
| – Percent of Open Interest Shorts: | 18.4 | 64.7 | 14.2 |
| – Net Position: | 113,312 | 94,012 | -207,324 |
| – Gross Longs: | 883,348 | 2,796,374 | 385,697 |
| – Gross Shorts: | 770,036 | 2,702,362 | 593,021 |
| – Long to Short Ratio: | 1.1 to 1 | 1.0 to 1 | 0.7 to 1 |
| NET POSITION TREND: | |||
| – COT Index Score (3 Year Range Pct): | 93.5 | 27.0 | 19.4 |
| – COT Index Reading (3 Year Range): | Bullish-Extreme | Bearish | Bearish-Extreme |
| NET POSITION MOVEMENT INDEX: | |||
| – 6-Week Change in Strength Index: | 6.2 | -8.7 | 8.8 |
Ultra 10-Year Notes Futures:
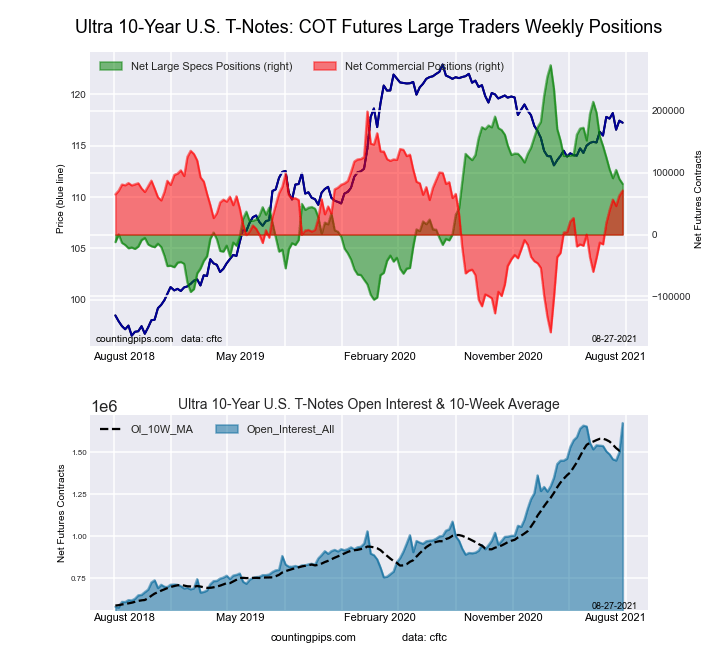 The Ultra 10-Year Notes large speculator standing this week equaled a net position of 81,912 contracts in the data reported through Tuesday. This was a weekly lowering of -7,871 contracts from the previous week which had a total of 89,783 net contracts.
This week’s current strength score (the trader positioning range over the past three years, measured from 0 to 100) shows the speculators are currently Bearish with a score of 49.4 percent. The commercials are Bullish with a score of 64.2 percent and the small traders (not shown in chart) are Bearish-Extreme with a score of 4.5 percent.
| Ultra 10-Year Notes Statistics | SPECULATORS | COMMERCIALS | SMALL TRADERS |
| – Percent of Open Interest Longs: | 13.1 | 67.9 | 8.2 |
| – Percent of Open Interest Shorts: | 8.2 | 63.7 | 17.4 |
| – Net Position: | 81,912 | 71,018 | -152,930 |
| – Gross Longs: | 219,188 | 1,137,478 | 137,975 |
| – Gross Shorts: | 137,276 | 1,066,460 | 290,905 |
| – Long to Short Ratio: | 1.6 to 1 | 1.1 to 1 | 0.5 to 1 |
| NET POSITION TREND: | |||
| – COT Index Score (3 Year Range Pct): | 49.4 | 64.2 | 4.5 |
| – COT Index Reading (3 Year Range): | Bearish | Bullish | Bearish-Extreme |
| NET POSITION MOVEMENT INDEX: | |||
| – 6-Week Change in Strength Index: | -16.2 | 24.3 | -19.1 |
US Treasury Bonds Futures:
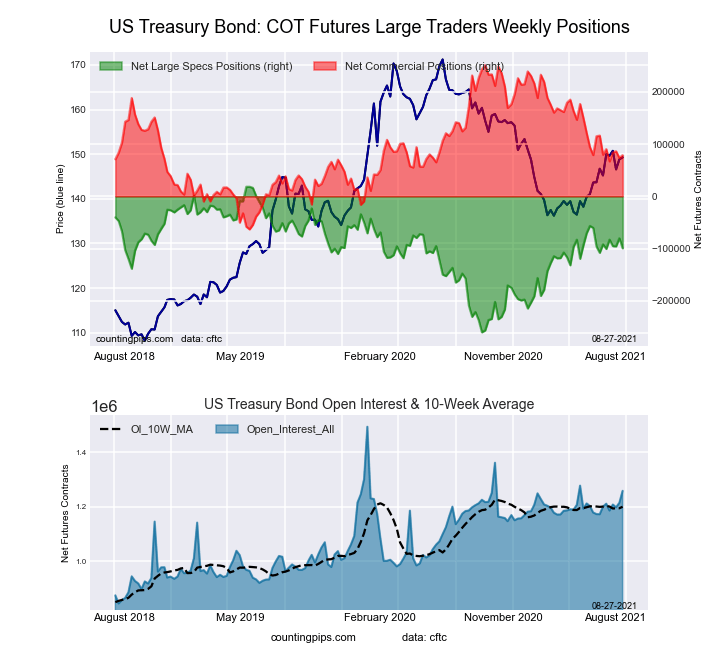 The US Treasury Bonds large speculator standing this week equaled a net position of -99,332 contracts in the data reported through Tuesday. This was a weekly fall of -19,127 contracts from the previous week which had a total of -80,205 net contracts.
This week’s current strength score (the trader positioning range over the past three years, measured from 0 to 100) shows the speculators are currently Bullish with a score of 57.7 percent. The commercials are Bearish with a score of 45.2 percent and the small traders (not shown in chart) are Bullish with a score of 69.0 percent.
| US Treasury Bonds Statistics | SPECULATORS | COMMERCIALS | SMALL TRADERS |
| – Percent of Open Interest Longs: | 10.1 | 72.2 | 15.6 |
| – Percent of Open Interest Shorts: | 17.9 | 66.0 | 14.0 |
| – Net Position: | -99,332 | 78,597 | 20,735 |
| – Gross Longs: | 126,525 | 909,245 | 196,360 |
| – Gross Shorts: | 225,857 | 830,648 | 175,625 |
| – Long to Short Ratio: | 0.6 to 1 | 1.1 to 1 | 1.1 to 1 |
| NET POSITION TREND: | |||
| – COT Index Score (3 Year Range Pct): | 57.7 | 45.2 | 69.0 |
| – COT Index Reading (3 Year Range): | Bullish | Bearish | Bullish |
| NET POSITION MOVEMENT INDEX: | |||
| – 6-Week Change in Strength Index: | -2.7 | -0.3 | 6.7 |
Ultra US Treasury Bonds Futures:
 The Ultra US Treasury Bonds large speculator standing this week equaled a net position of -253,970 contracts in the data reported through Tuesday. This was a weekly decrease of -6,623 contracts from the previous week which had a total of -247,347 net contracts.
This week’s current strength score (the trader positioning range over the past three years, measured from 0 to 100) shows the speculators are currently Bullish-Extreme with a score of 81.6 percent. The commercials are Bearish with a score of 32.6 percent and the small traders (not shown in chart) are Bearish with a score of 37.8 percent.
| Ultra US Treasury Bonds Statistics | SPECULATORS | COMMERCIALS | SMALL TRADERS |
| – Percent of Open Interest Longs: | 9.1 | 73.8 | 12.3 |
| – Percent of Open Interest Shorts: | 28.2 | 55.7 | 11.3 |
| – Net Position: | -253,970 | 240,631 | 13,339 |
| – Gross Longs: | 120,907 | 980,555 | 163,388 |
| – Gross Shorts: | 374,877 | 739,924 | 150,049 |
| – Long to Short Ratio: | 0.3 to 1 | 1.3 to 1 | 1.1 to 1 |
| NET POSITION TREND: | |||
| – COT Index Score (3 Year Range Pct): | 81.6 | 32.6 | 37.8 |
| – COT Index Reading (3 Year Range): | Bullish-Extreme | Bearish | Bearish |
| NET POSITION MOVEMENT INDEX: | |||
| – 6-Week Change in Strength Index: | -7.5 | 7.1 | 2.7 |
Article By CountingPips.com – Receive our weekly COT Reports by Email
*COT Report: The COT data, released weekly to the public each Friday, is updated through the most recent Tuesday (data is 3 days old) and shows a quick view of how large speculators or non-commercials (for-profit traders) were positioned in the futures markets.
The CFTC categorizes trader positions according to commercial hedgers (traders who use futures contracts for hedging as part of the business), non-commercials (large traders who speculate to realize trading profits) and nonreportable traders (usually small traders/speculators).
Find CFTC criteria here: (http://www.cftc.gov/MarketReports/CommitmentsofTraders/ExplanatoryNotes/index.htm).

- Gold (XAU/USD) Faces Persistent Selling Pressure Jun 10, 2026
- The US technology sector once again came under a wave of selling Jun 10, 2026
- China has shifted to using its own strategic oil reserves Jun 9, 2026
- GBP/USD Remains Under Pressure Despite Attempts to Recover Jun 9, 2026
- SpaceX IPO: Set for $75 billion liftoff Jun 8, 2026
- On Friday, the American stock market experienced one of the strongest crashes in recent times Jun 8, 2026
- EUR/USD at April Lows: What’s Next for the Pair? Jun 8, 2026
- The ceasefire between Israel and Lebanon has reduced the geopolitical premium Jun 5, 2026
- EUR/USD: All Eyes on Non-Farm Payrolls Jun 5, 2026
- The escalation of the conflict in the Middle East put pressure on US and European stock indices Jun 4, 2026