
By CountingPips.com COT Home | Data Tables | Data Downloads | Newsletter
Here are the latest charts and statistics for the Commitment of Traders (COT) data published by the Commodities Futures Trading Commission (CFTC).
The latest COT data is updated through Tuesday August 17 2021 and shows a quick view of how large traders (for-profit speculators and commercial entities) were positioned in the futures markets.
WTI Crude Oil Futures :
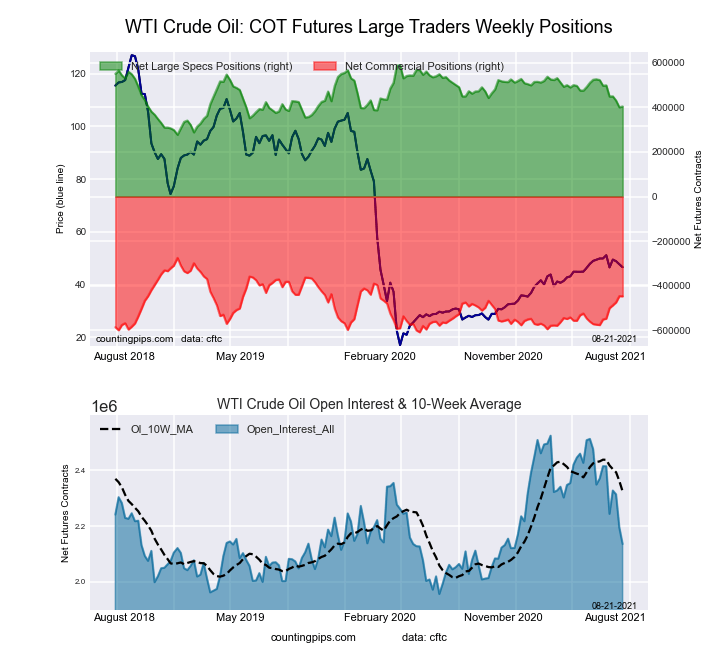 The WTI Crude Oil Futures large speculator standing this week recorded a net position of 404,323 contracts in the data reported through Tuesday. This was a weekly advance of 3,910 contracts from the previous week which had a total of 400,413 net contracts.
This week’s current strength score (the trader positioning range over the past three years, measured from 0 to 100) shows the speculators are currently Bearish with a score of 40.7 percent. The commercials are Bearish with a score of 48.4 percent and the small traders (not shown in chart) are Bullish with a score of 75.5 percent.
| WTI Crude Oil Futures Statistics | SPECULATORS | COMMERCIALS | SMALL TRADERS |
| – Percent of Open Interest Longs: | 25.2 | 33.4 | 4.3 |
| – Percent of Open Interest Shorts: | 6.3 | 54.3 | 2.3 |
| – Net Position: | 404,323 | -447,254 | 42,931 |
| – Gross Longs: | 538,862 | 712,347 | 91,029 |
| – Gross Shorts: | 134,539 | 1,159,601 | 48,098 |
| – Long to Short Ratio: | 4.0 to 1 | 0.6 to 1 | 1.9 to 1 |
| NET POSITION TREND: | |||
| – COT Index Score (3 Year Range Pct): | 40.7 | 48.4 | 75.5 |
| – COT Index Reading (3 Year Range): | Bearish | Bearish | Bullish |
| NET POSITION MOVEMENT INDEX: | |||
| – 6-Week Change in Strength Index: | -29.8 | 31.2 | -15.6 |
Free Reports:
 Download Our Metatrader 4 Indicators – Put Our Free MetaTrader 4 Custom Indicators on your charts when you join our Weekly Newsletter
 Get our Weekly Commitment of Traders Reports - See where the biggest traders (Hedge Funds and Commercial Hedgers) are positioned in the futures markets on a weekly basis.
Brent Crude Oil Futures :
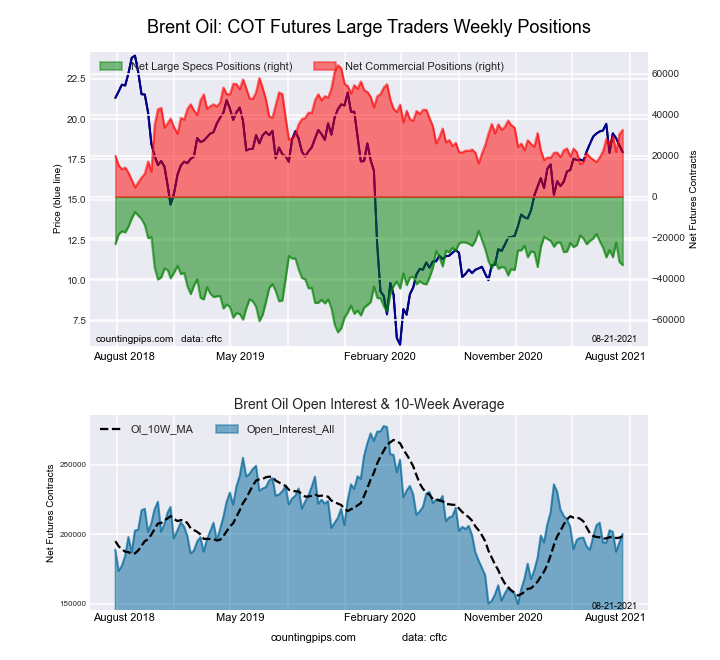 The Brent Crude Oil Futures large speculator standing this week recorded a net position of -33,377 contracts in the data reported through Tuesday. This was a weekly decline of -1,553 contracts from the previous week which had a total of -31,824 net contracts.
This week’s current strength score (the trader positioning range over the past three years, measured from 0 to 100) shows the speculators are currently Bullish with a score of 55.8 percent. The commercials are Bearish with a score of 47.1 percent and the small traders (not shown in chart) are Bearish with a score of 42.1 percent.
| Brent Crude Oil Futures Statistics | SPECULATORS | COMMERCIALS | SMALL TRADERS |
| – Percent of Open Interest Longs: | 17.0 | 54.2 | 3.8 |
| – Percent of Open Interest Shorts: | 33.7 | 37.9 | 3.4 |
| – Net Position: | -33,377 | 32,613 | 764 |
| – Gross Longs: | 33,994 | 108,374 | 7,522 |
| – Gross Shorts: | 67,371 | 75,761 | 6,758 |
| – Long to Short Ratio: | 0.5 to 1 | 1.4 to 1 | 1.1 to 1 |
| NET POSITION TREND: | |||
| – COT Index Score (3 Year Range Pct): | 55.8 | 47.1 | 42.1 |
| – COT Index Reading (3 Year Range): | Bullish | Bearish | Bearish |
| NET POSITION MOVEMENT INDEX: | |||
| – 6-Week Change in Strength Index: | -14.5 | 17.4 | -16.3 |
Natural Gas Futures :
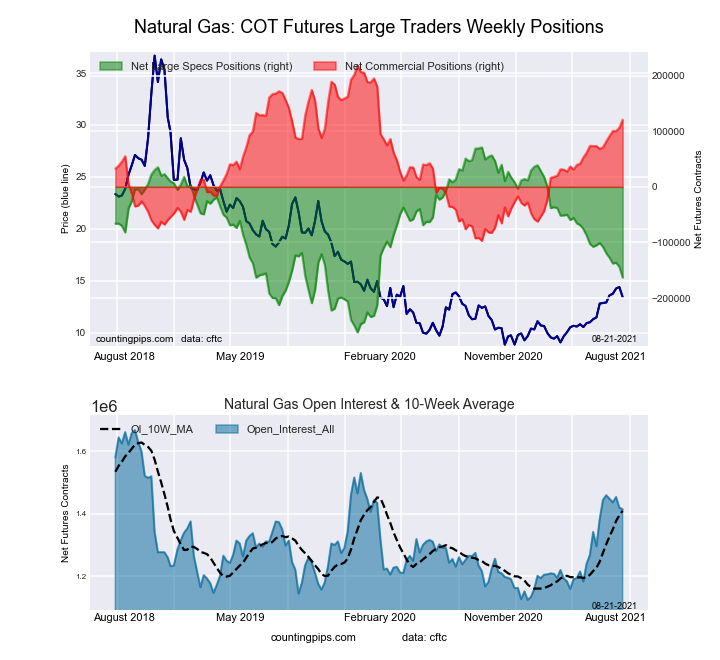 The Natural Gas Futures large speculator standing this week recorded a net position of -163,065 contracts in the data reported through Tuesday. This was a weekly fall of -19,145 contracts from the previous week which had a total of -143,920 net contracts.
This week’s current strength score (the trader positioning range over the past three years, measured from 0 to 100) shows the speculators are currently Bearish with a score of 29.6 percent. The commercials are Bullish with a score of 69.0 percent and the small traders (not shown in chart) are Bullish-Extreme with a score of 82.4 percent.
| Natural Gas Futures Statistics | SPECULATORS | COMMERCIALS | SMALL TRADERS |
| – Percent of Open Interest Longs: | 23.7 | 44.3 | 5.0 |
| – Percent of Open Interest Shorts: | 35.2 | 35.7 | 2.0 |
| – Net Position: | -163,065 | 120,768 | 42,297 |
| – Gross Longs: | 335,240 | 626,403 | 70,417 |
| – Gross Shorts: | 498,305 | 505,635 | 28,120 |
| – Long to Short Ratio: | 0.7 to 1 | 1.2 to 1 | 2.5 to 1 |
| NET POSITION TREND: | |||
| – COT Index Score (3 Year Range Pct): | 29.6 | 69.0 | 82.4 |
| – COT Index Reading (3 Year Range): | Bearish | Bullish | Bullish-Extreme |
| NET POSITION MOVEMENT INDEX: | |||
| – 6-Week Change in Strength Index: | -16.5 | 15.6 | 18.2 |
Gasoline Blendstock Futures :
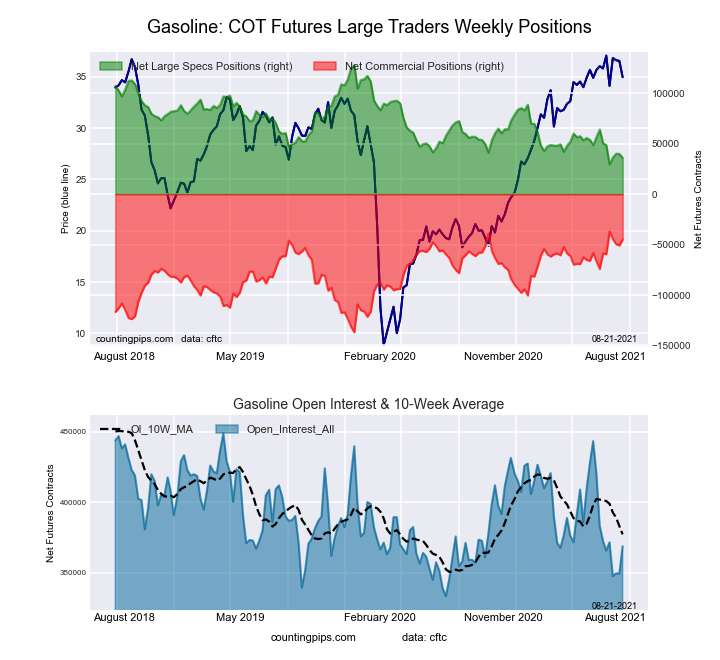 The Gasoline Blendstock Futures large speculator standing this week recorded a net position of 35,747 contracts in the data reported through Tuesday. This was a weekly decline of -4,091 contracts from the previous week which had a total of 39,838 net contracts.
This week’s current strength score (the trader positioning range over the past three years, measured from 0 to 100) shows the speculators are currently Bearish-Extreme with a score of 6.5 percent. The commercials are Bullish-Extreme with a score of 92.0 percent and the small traders (not shown in chart) are Bullish with a score of 67.1 percent.
| Nasdaq Mini Futures Statistics | SPECULATORS | COMMERCIALS | SMALL TRADERS |
| – Percent of Open Interest Longs: | 26.7 | 51.1 | 6.3 |
| – Percent of Open Interest Shorts: | 17.0 | 63.3 | 3.8 |
| – Net Position: | 35,747 | -45,046 | 9,299 |
| – Gross Longs: | 98,409 | 188,294 | 23,373 |
| – Gross Shorts: | 62,662 | 233,340 | 14,074 |
| – Long to Short Ratio: | 1.6 to 1 | 0.8 to 1 | 1.7 to 1 |
| NET POSITION TREND: | |||
| – COT Index Score (3 Year Range Pct): | 6.5 | 92.0 | 67.1 |
| – COT Index Reading (3 Year Range): | Bearish-Extreme | Bullish-Extreme | Bullish |
| NET POSITION MOVEMENT INDEX: | |||
| – 6-Week Change in Strength Index: | -14.9 | 13.7 | 6.0 |
#2 Heating Oil NY-Harbor Futures :
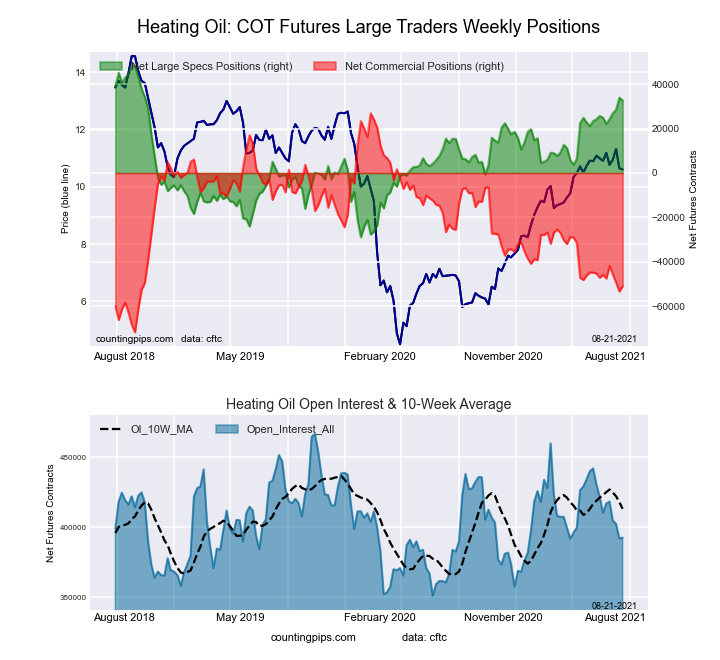 The #2 Heating Oil NY-Harbor Futures large speculator standing this week recorded a net position of 32,579 contracts in the data reported through Tuesday. This was a weekly decrease of -1,336 contracts from the previous week which had a total of 33,915 net contracts.
This week’s current strength score (the trader positioning range over the past three years, measured from 0 to 100) shows the speculators are currently Bullish with a score of 79.4 percent. The commercials are Bearish with a score of 21.0 percent and the small traders (not shown in chart) are Bullish with a score of 72.0 percent.
| Heating Oil Futures Statistics | SPECULATORS | COMMERCIALS | SMALL TRADERS |
| – Percent of Open Interest Longs: | 18.6 | 52.5 | 11.1 |
| – Percent of Open Interest Shorts: | 10.3 | 65.5 | 6.4 |
| – Net Position: | 32,579 | -50,962 | 18,383 |
| – Gross Longs: | 72,810 | 206,120 | 43,399 |
| – Gross Shorts: | 40,231 | 257,082 | 25,016 |
| – Long to Short Ratio: | 1.8 to 1 | 0.8 to 1 | 1.7 to 1 |
| NET POSITION TREND: | |||
| – COT Index Score (3 Year Range Pct): | 79.4 | 21.0 | 72.0 |
| – COT Index Reading (3 Year Range): | Bullish | Bearish | Bullish |
| NET POSITION MOVEMENT INDEX: | |||
| – 6-Week Change in Strength Index: | 10.0 | -5.3 | -10.1 |
Bloomberg Commodity Index Futures :
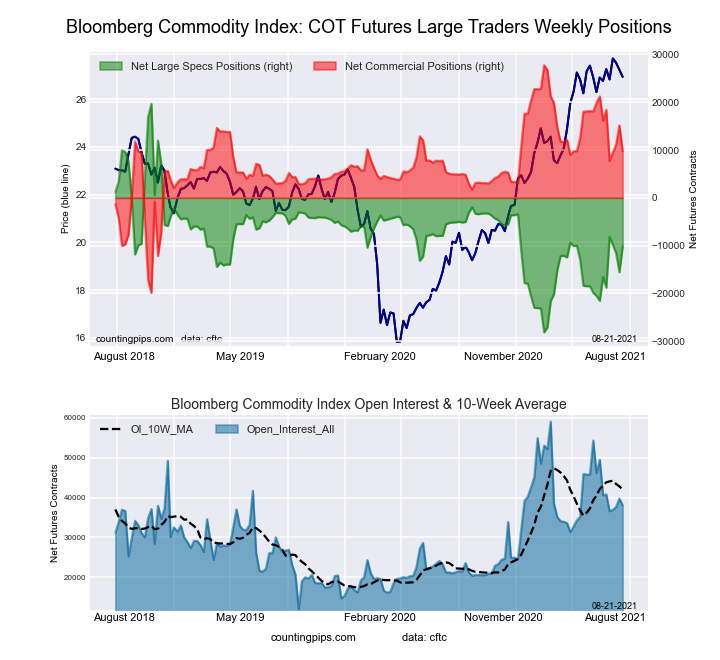 The Bloomberg Commodity Index Futures large speculator standing this week recorded a net position of -10,133 contracts in the data reported through Tuesday. This was a weekly lift of 5,417 contracts from the previous week which had a total of -15,550 net contracts.
This week’s current strength score (the trader positioning range over the past three years, measured from 0 to 100) shows the speculators are currently Bearish with a score of 37.6 percent. The commercials are Bullish with a score of 62.2 percent and the small traders (not shown in chart) are Bearish with a score of 40.4 percent.
| Bloomberg Index Futures Statistics | SPECULATORS | COMMERCIALS | SMALL TRADERS |
| – Percent of Open Interest Longs: | 63.5 | 34.6 | 1.2 |
| – Percent of Open Interest Shorts: | 90.1 | 8.9 | 0.3 |
| – Net Position: | -10,133 | 9,766 | 367 |
| – Gross Longs: | 24,150 | 13,166 | 475 |
| – Gross Shorts: | 34,283 | 3,400 | 108 |
| – Long to Short Ratio: | 0.7 to 1 | 3.9 to 1 | 4.4 to 1 |
| NET POSITION TREND: | |||
| – COT Index Score (3 Year Range Pct): | 37.6 | 62.2 | 40.4 |
| – COT Index Reading (3 Year Range): | Bearish | Bullish | Bearish |
| NET POSITION MOVEMENT INDEX: | |||
| – 6-Week Change in Strength Index: | 13.4 | -13.5 | 1.1 |
Article By CountingPips.com – Receive our weekly COT Reports by Email
*COT Report: The COT data, released weekly to the public each Friday, is updated through the most recent Tuesday (data is 3 days old) and shows a quick view of how large speculators or non-commercials (for-profit traders) were positioned in the futures markets.
The CFTC categorizes trader positions according to commercial hedgers (traders who use futures contracts for hedging as part of the business), non-commercials (large traders who speculate to realize trading profits) and nonreportable traders (usually small traders/speculators).
Find CFTC criteria here: (http://www.cftc.gov/MarketReports/CommitmentsofTraders/ExplanatoryNotes/index.htm).

- RoboForex Brings Full-Scale Trading to Telegram Jul 7, 2026
- Your Bourse Integrates TradingView Charts and Trading Platform Library with Trade Server Jul 7, 2026
- Yen Still Under Pressure: Markets Await Action from Authorities Jul 7, 2026
- Germany’s DAX Index has updated its all‑time high. OPEC+ countries have agreed to increase production Jul 7, 2026
- Oil prices have stabilized. The Canadian dollar continues to trade near yearly lows. Jul 6, 2026
- EUR/USD in a Narrow Range: Focus on Fed Minutes Jul 6, 2026
- Oil prices have fallen to pre‑war levels. AI companies continue to sell off Jul 3, 2026
- Gold Rises Sharply as Markets Reassess Fed Rate Outlook Jul 3, 2026
- The Eurozone has shown a significant slowdown in inflation. Australia has recorded its largest trade deficit since 2015 Jul 2, 2026
- Natural gas prices are rising amid increasing electricity consumption Jul 1, 2026