
By Orbex
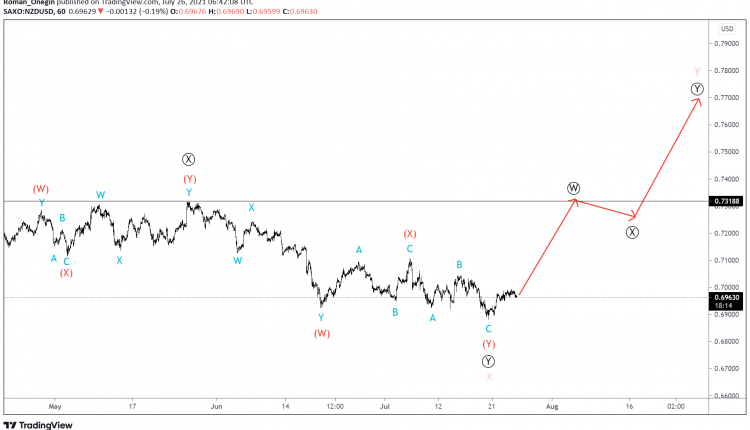
The current structure of the NZDUSD pair hints at the completion of an intervening wave x of the cycle degree. The pattern has taken the form of a primary double zigzag.
In the last section of the chart, we see an upward move, which could indicate the development of the initial part of the cycle wave y. This could also be a primary double zigzag, like the previous wave x.
We can expect the end of the first actionary wave Ⓦ in the area of 0.731. This was formed by the intervening wave Ⓧ.

Free Reports:
 Get our Weekly Commitment of Traders Reports - See where the biggest traders (Hedge Funds and Commercial Hedgers) are positioned in the futures markets on a weekly basis.
 Download Our Metatrader 4 Indicators – Put Our Free MetaTrader 4 Custom Indicators on your charts when you join our Weekly Newsletter
There is a possible second option, where the formation of the cycle intervening wave x has not yet ended. Perhaps its last primary wave Ⓨ is still under development, or rather its intermediate wave (Y).
Wave (Y) suggests a bearish triple zigzag, which consists of minor sub-waves W-X-Y-X-Z.
In the near future, the pair will continue to decline in wave Z to 0.679, where primary waves Ⓦ and Ⓨ will be equal.
By Orbex

- The Tech‑heavy NASDAQ Index jumped by more than 3.3%. The offshore yuan is trading at its highest level since 2023 Jul 31, 2026
- USD/JPY After Volatility: Multiple Events in One Day Jul 31, 2026
- The US indices sell off amid renewed US-Iran clashes. Oil jumps by 7% Jul 30, 2026
- USD/JPY Temporary in Equilibrium: Multiple Factors in Focus Jul 30, 2026
- GBP/USD at Month’s Lows: The Outlook Remains Weak Jul 29, 2026
- Crude oil falls below $80 per barrel. Australia sees inflation slowdown Jul 29, 2026
- The US Tech sector hit by sell‑off. Oil prices decline on renewed negotiations Jul 28, 2026
- Gold Declines, Focus on Fed and Falling Oil Prices Jul 28, 2026
- This week will be one of the most crowded for central‑bank meetings Jul 27, 2026
- EUR/USD Ahead of a Key Week: Holding Near Lows Jul 27, 2026