
By Dmitriy Gurkovskiy, Chief Analyst at RoboForex
Early in another week of July, the oil market is looking neutral: market concerns about lack of decisions from OPEC+ sputtered out, while weekly reports on the Natural Gas Storage and Crude Oil Inventories are already included in prices. As a result, Brent is trading at $75.40.
The cartel and its allies will have to come to an agreement anyway: the global economic recovery will require more energies, and if OPEC+ wants to preserve market stability, as well as the balance between supply and demand, it will have to find a compromise. It doesn’t mean that the direct confrontation between the cartel and UAE disappeared but the parties are highly likely to come to a compromiseб at least for a while.
Given the current recovery rates, the global supply shortage is estimated at 3 million barrels per day. OPEC+ has good chances to eliminate this gap.
The USA is still influenced by a seasonal factor, which affects weekly reports on the Crude Oil Inventories and they show slight declines. It allows bulls to remains quite active.
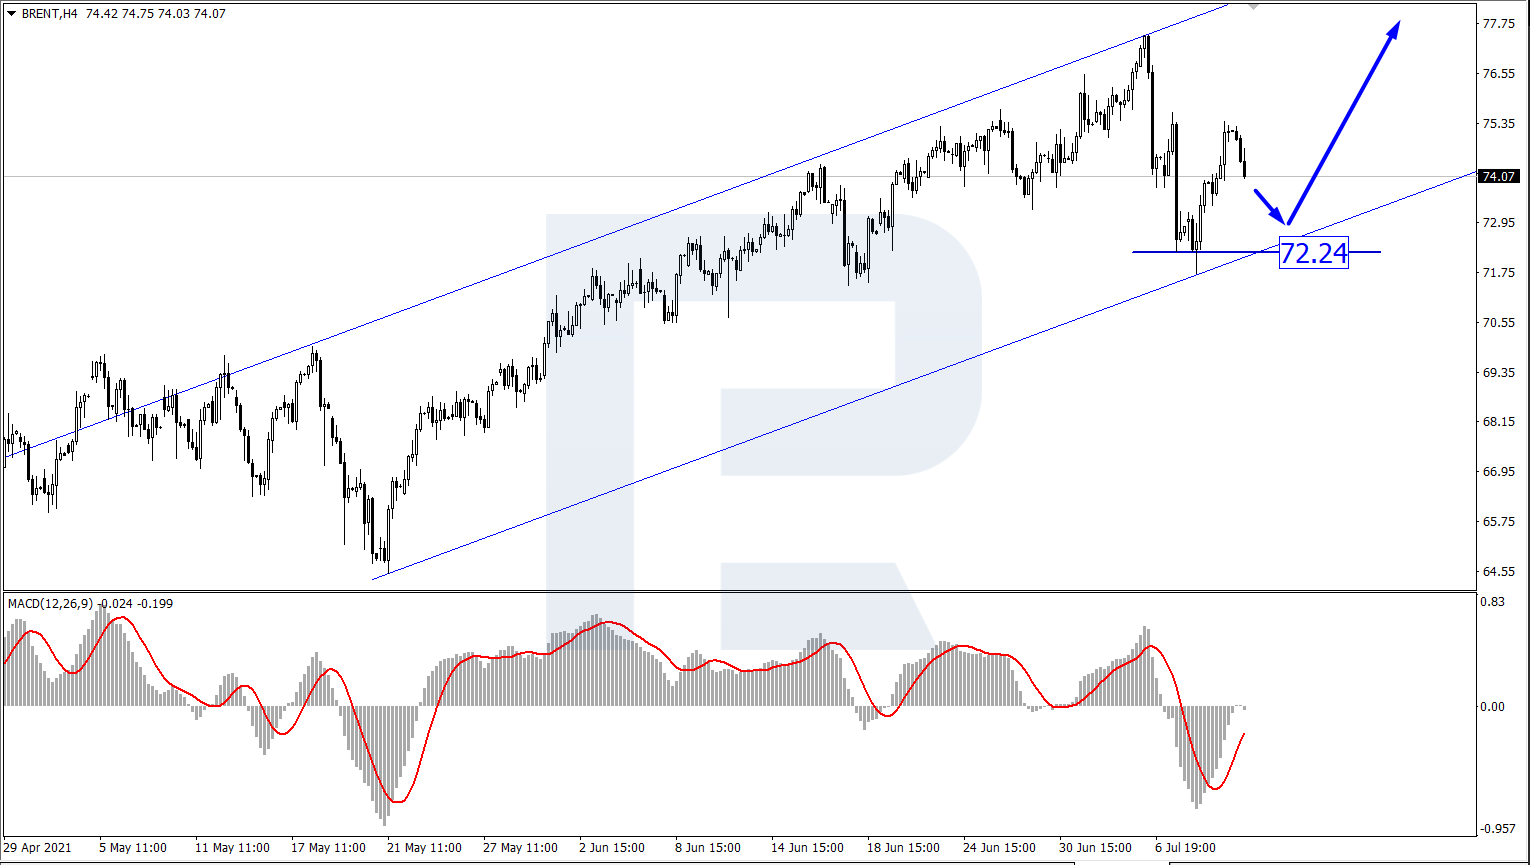
In the H4 chart, after updating the highs, Brent is still forming the correctional wave. Today, the asset may reach 72.24. After completing the correction, the instrument may resume trading within the uptrend with the target at 78.00. From the technical point of view, this scenario is confirmed by MACD Oscillator: its signal line is still moving below, thus indicating the correctional wave.
Free Reports:
 Get our Weekly Commitment of Traders Reports - See where the biggest traders (Hedge Funds and Commercial Hedgers) are positioned in the futures markets on a weekly basis.
 Download Our Metatrader 4 Indicators – Put Our Free MetaTrader 4 Custom Indicators on your charts when you join our Weekly Newsletter
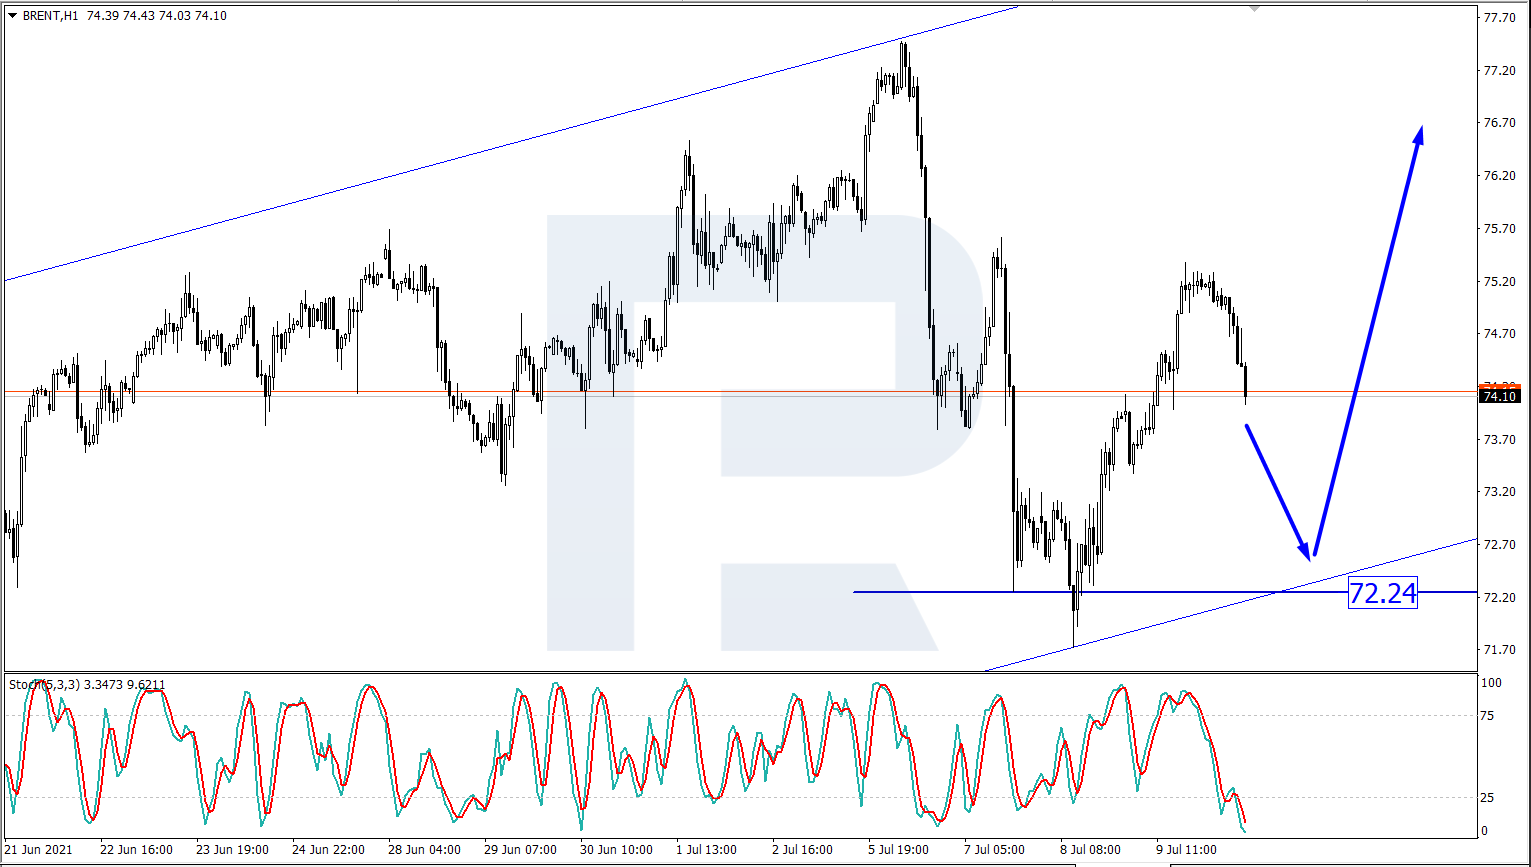
As we can see in the H1 chart, the situation is pretty similar. Brent continues correcting downwards and may soon reach 72.24. From the technical point of view, this idea is confirmed by the Stochastic Oscillator: its signal line is moving below 25, thus indicating that the correction continues.
Disclaimer
Any forecasts contained herein are based on the author’s particular opinion. This analysis may not be treated as trading advice. RoboForex bears no responsibility for trading results based on trading recommendations and reviews contained herein.

- The United States and Iran have signed a peace agreement – oil has fallen to 80 dollars per barrel. Jun 15, 2026
- COT Metals Charts: Speculator Bets led by Steel Jun 14, 2026
- COT Bonds Charts: Speculator Bets led by 2-Year Bonds & Ultra 10-Year Bonds Jun 14, 2026
- COT Energy Charts: Speculator Bets led by Brent Oil Jun 14, 2026
- COT Soft Commodities Charts: Weekly Speculator Bets led lower by Corn and Soybean Meal Jun 14, 2026
- Today investors’ focus is directed at the historic IPO of SpaceX Jun 12, 2026
- USD/JPY Continues Its Climb: Is There a Limit? Jun 11, 2026
- Investors launched broad profit‑taking in the technology sector. The Bank of Canada kept its rate at 2.25% Jun 11, 2026
- Gold (XAU/USD) Faces Persistent Selling Pressure Jun 10, 2026
- The US technology sector once again came under a wave of selling Jun 10, 2026