
Article By RoboForex.com
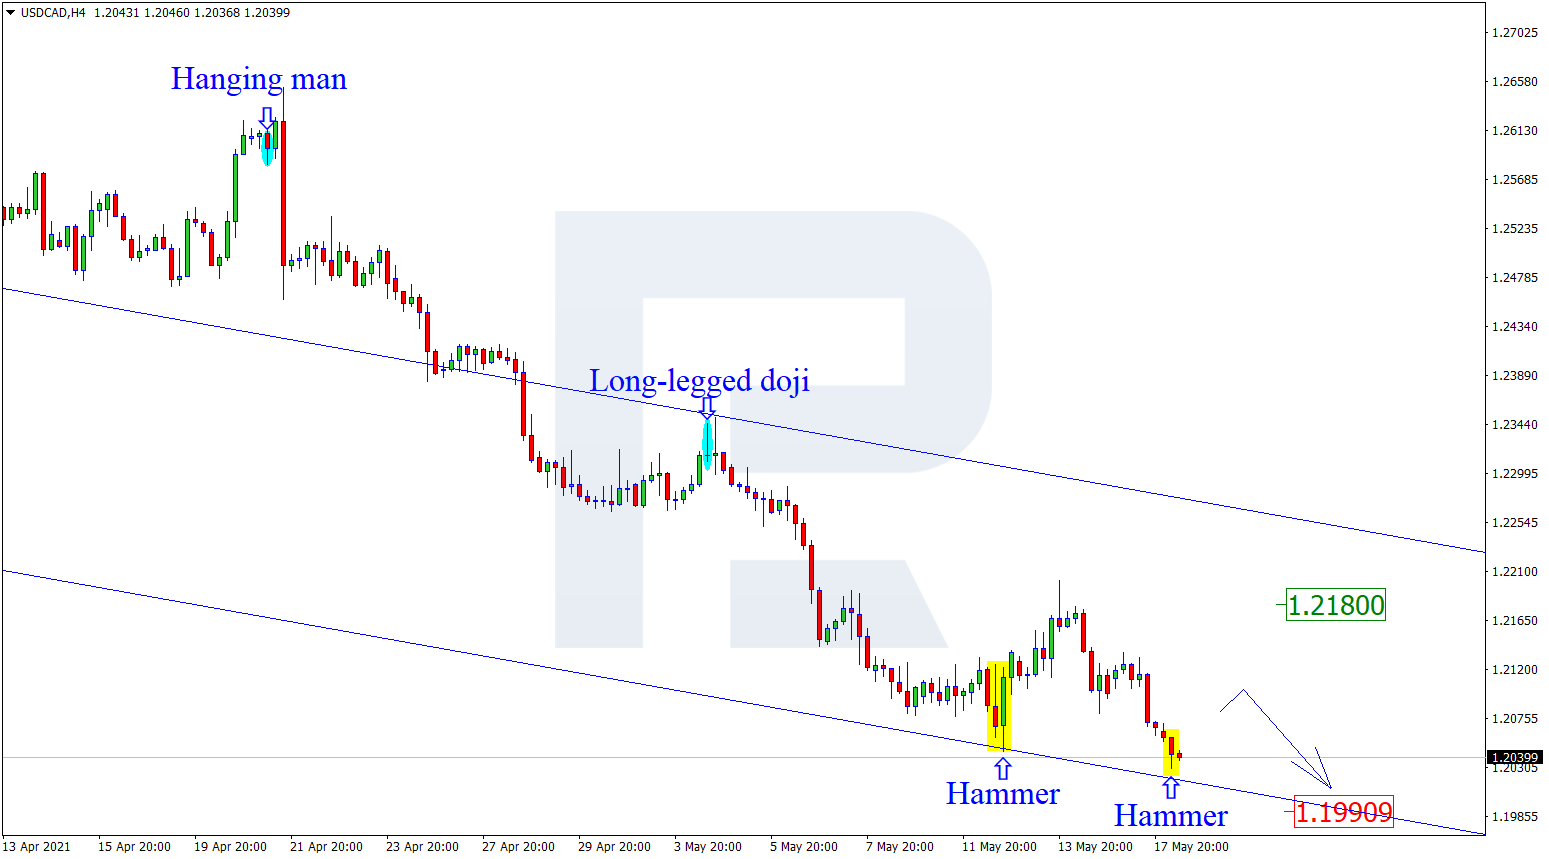
USDCAD, “US Dollar vs Canadian Dollar”
As we can see in the H4 chart, after forming several reversal patterns, including Hammer, not far from the support level, USDCAD may reverse and start a new correction towards 1.2180. After testing this level, the price may rebound and resume its descending tendency. However, an alternative scenario implies that the asset may fall to reach the next support level at 1.1990 without reversing and correcting.

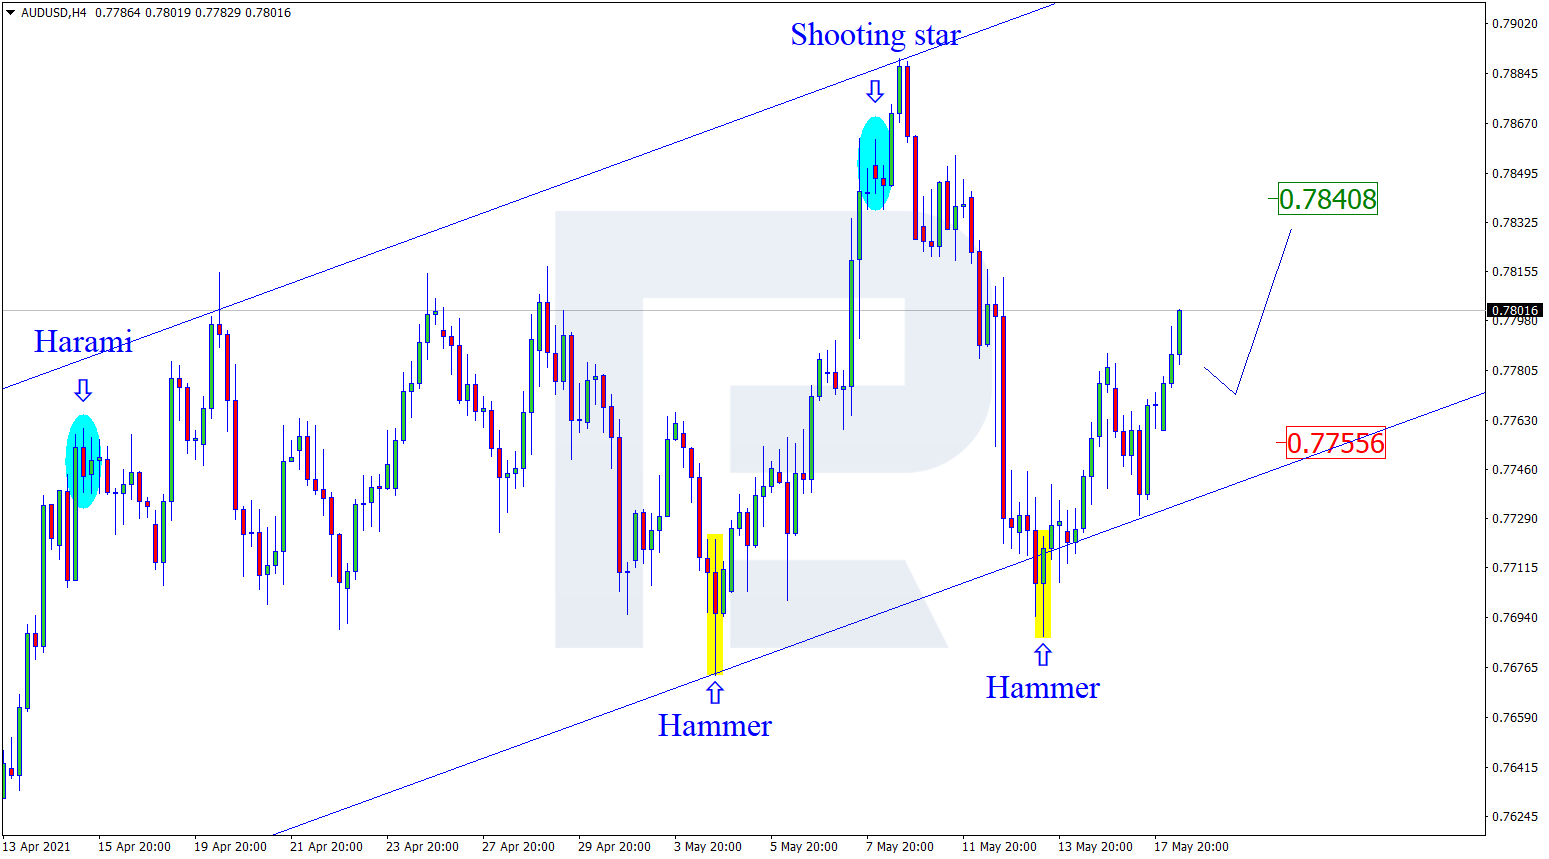
AUDUSD, “Australian Dollar vs US Dollar”
As we can see in the H4 chart, AUDUSD has formed several reversal patterns, such as Hammer, not far from the support level. At the moment, the asset is reversing in favor of the ascending tendency. In this case, the upside target may be the resistance area at 0.7840. At the same time, an opposite scenario implies that the price may fall towards the support level at 0.7755, rebound from it, and then resume trading upwards.
Free Reports:
 Download Our Metatrader 4 Indicators – Put Our Free MetaTrader 4 Custom Indicators on your charts when you join our Weekly Newsletter
 Get our Weekly Commitment of Traders Reports - See where the biggest traders (Hedge Funds and Commercial Hedgers) are positioned in the futures markets on a weekly basis.
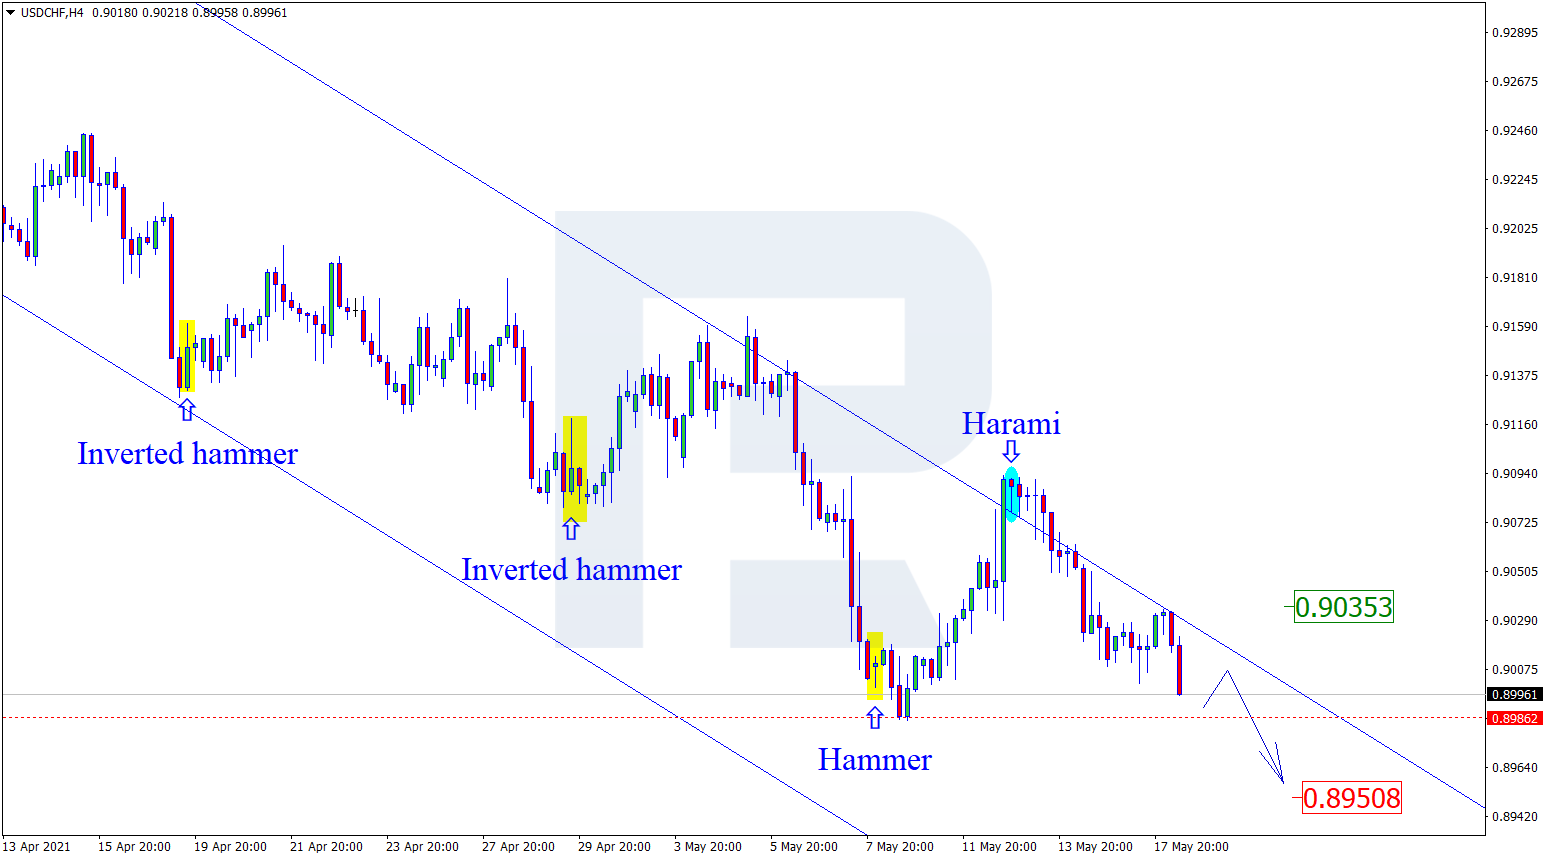
USDCHF, “US Dollar vs Swiss Franc”
As we can see in the H4 chart, the asset is testing the support area. At the moment, after forming several reversal patterns, such as Harami, not far from the resistance area, USDCHF has reversed to resume trading downwards. In this case, the downside target may be the support level at 0.8950. Still, there might be an alternative scenario, according to which the asset may correct to reach 0.9035 before a further decline.
Article By RoboForex.com
Attention!
Forecasts presented in this section only reflect the author’s private opinion and should not be considered as guidance for trading. RoboForex LP bears no responsibility for trading results based on trading recommendations described in these analytical reviews.

- China has shifted to using its own strategic oil reserves Jun 9, 2026
- GBP/USD Remains Under Pressure Despite Attempts to Recover Jun 9, 2026
- SpaceX IPO: Set for $75 billion liftoff Jun 8, 2026
- On Friday, the American stock market experienced one of the strongest crashes in recent times Jun 8, 2026
- EUR/USD at April Lows: What’s Next for the Pair? Jun 8, 2026
- The ceasefire between Israel and Lebanon has reduced the geopolitical premium Jun 5, 2026
- EUR/USD: All Eyes on Non-Farm Payrolls Jun 5, 2026
- The escalation of the conflict in the Middle East put pressure on US and European stock indices Jun 4, 2026
- Gold Remains Under Pressure, but a Rebound Is Still Possible Jun 4, 2026
- Bitcoin drops below the psychological $70,000 level. The US stock indices hit new record highs Jun 3, 2026