
Article By RoboForex.com
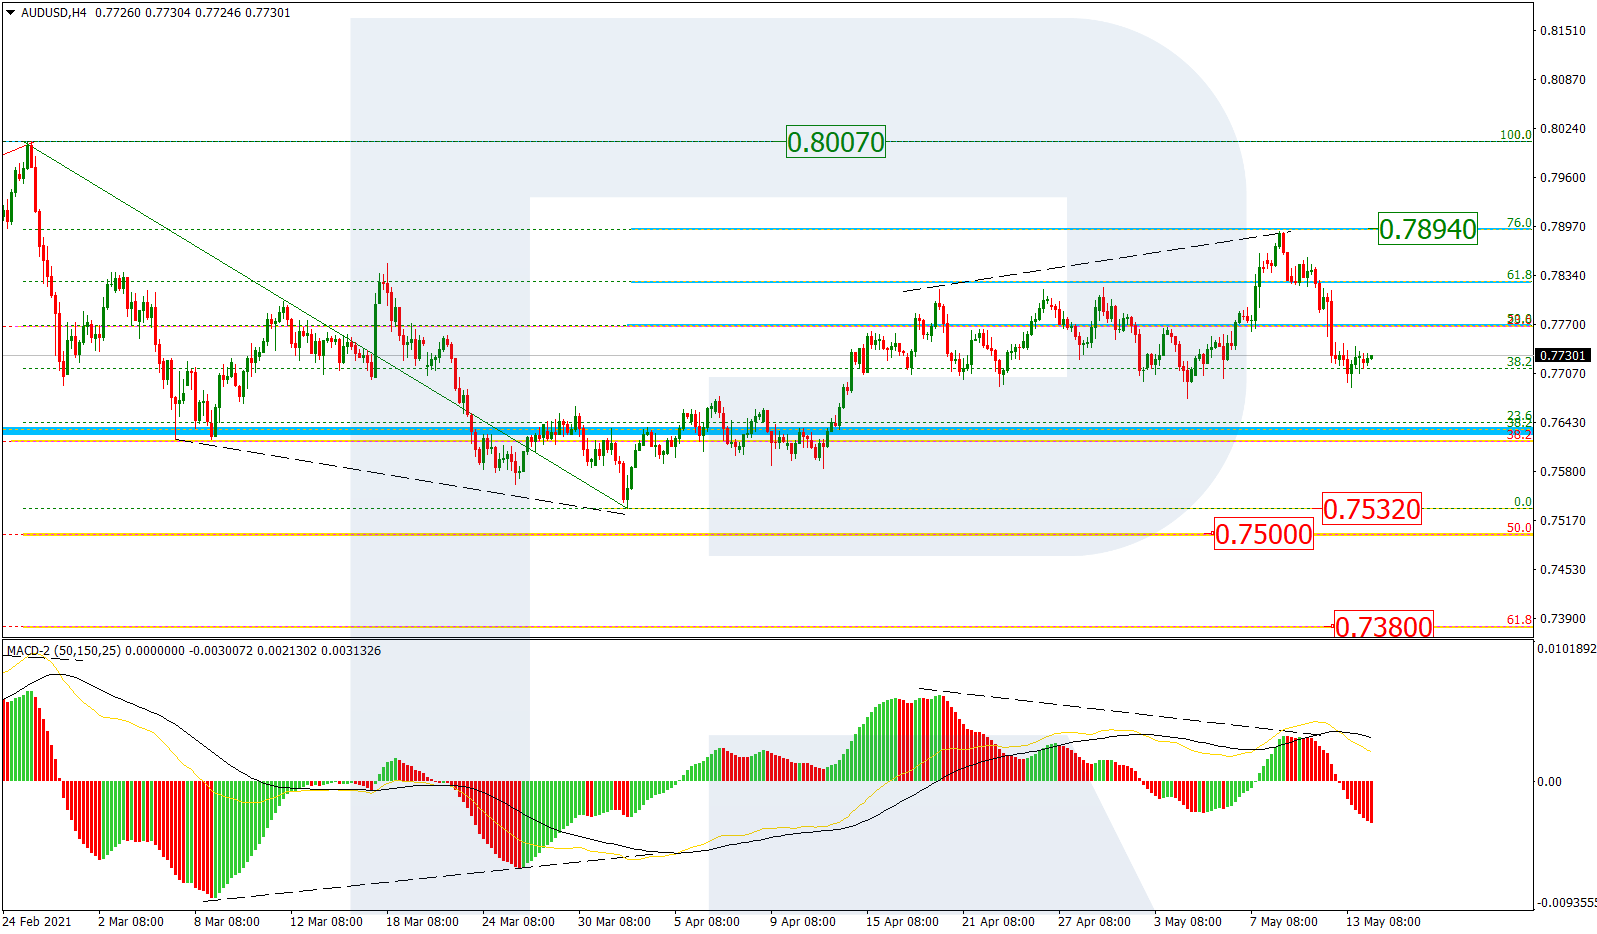
AUDUSD, “Australian Dollar vs US Dollar”
As we can see in the H4 chart, a divergence on MACD made AUDUSD complete the ascending correction not far from 76.0% fibo. It means that a further uptrend towards the local high at 0.8007 is very unlikely and the asset may start a new mid-term decline instead. Possibly, the pair may fall to break the low at 0.7532 and then continue the correction towards 50.0% and 61.8% fibo at 0.7500 and 0.7380 respectively.

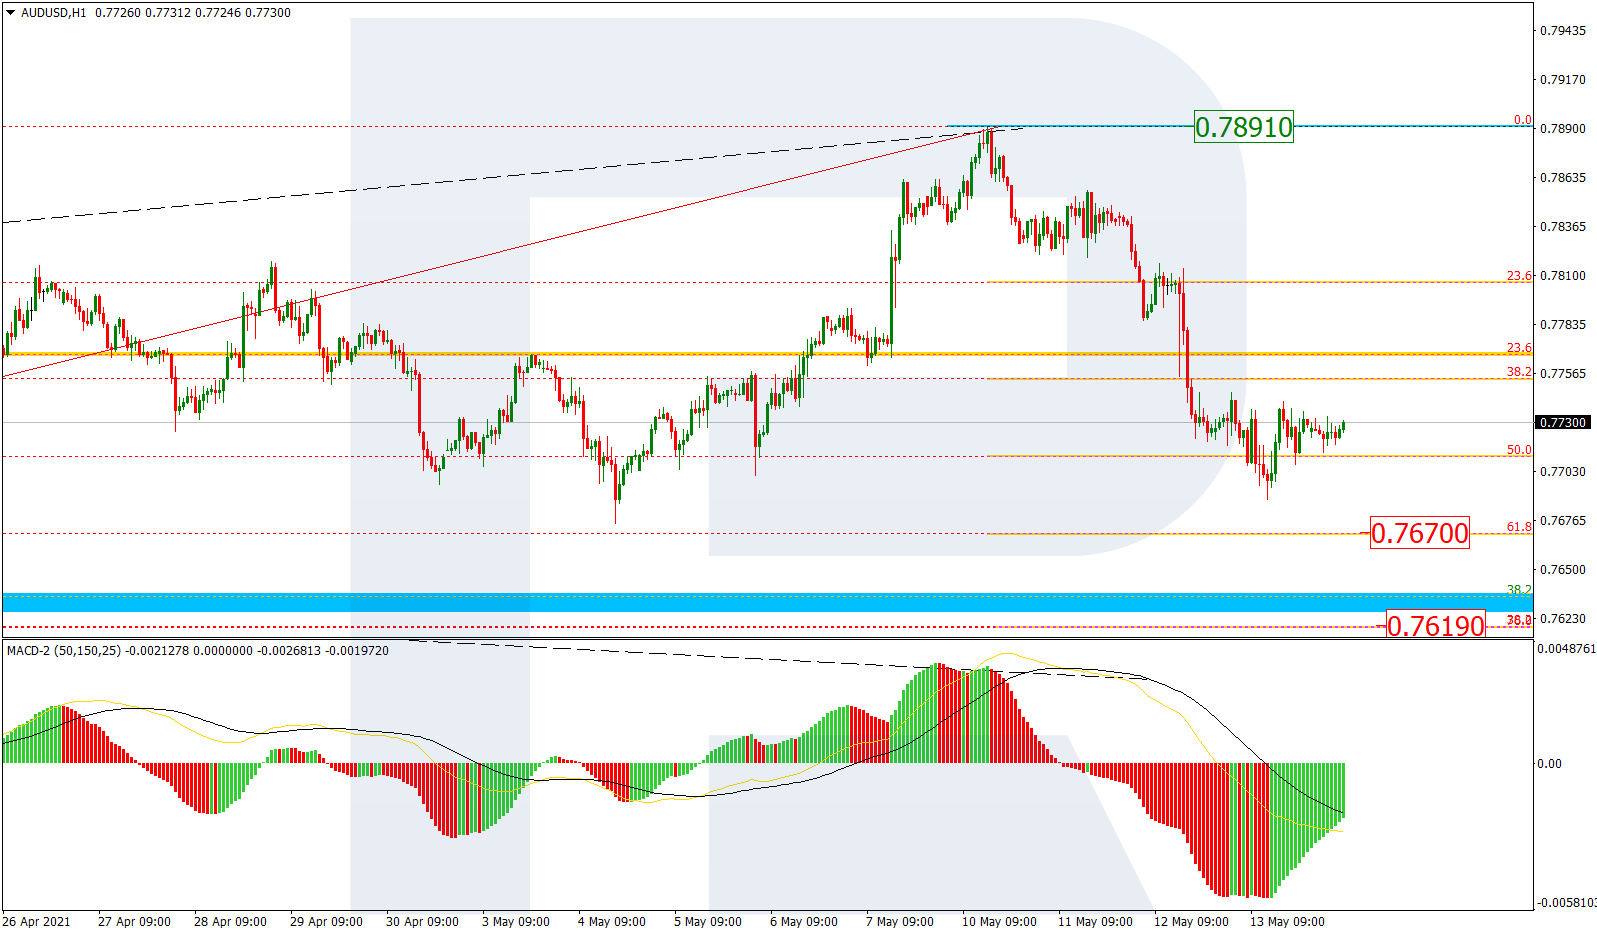
The H1 chart of UADUSD shows that the descending wave has reached 50.0% fibo after a divergence. At the moment, the price is forming a short-term internal pullback. After completing the pullback, the asset may resume falling towards 61.8% and 76.0% fibo at 0.7670 and 0.7619 respectively. The resistance is the local high at 0.7891.
Free Reports:
 Sign Up for Our Stock Market Newsletter – Get updated on News, Charts & Rankings of Public Companies when you join our Stocks Newsletter
 Get our Weekly Commitment of Traders Reports - See where the biggest traders (Hedge Funds and Commercial Hedgers) are positioned in the futures markets on a weekly basis.
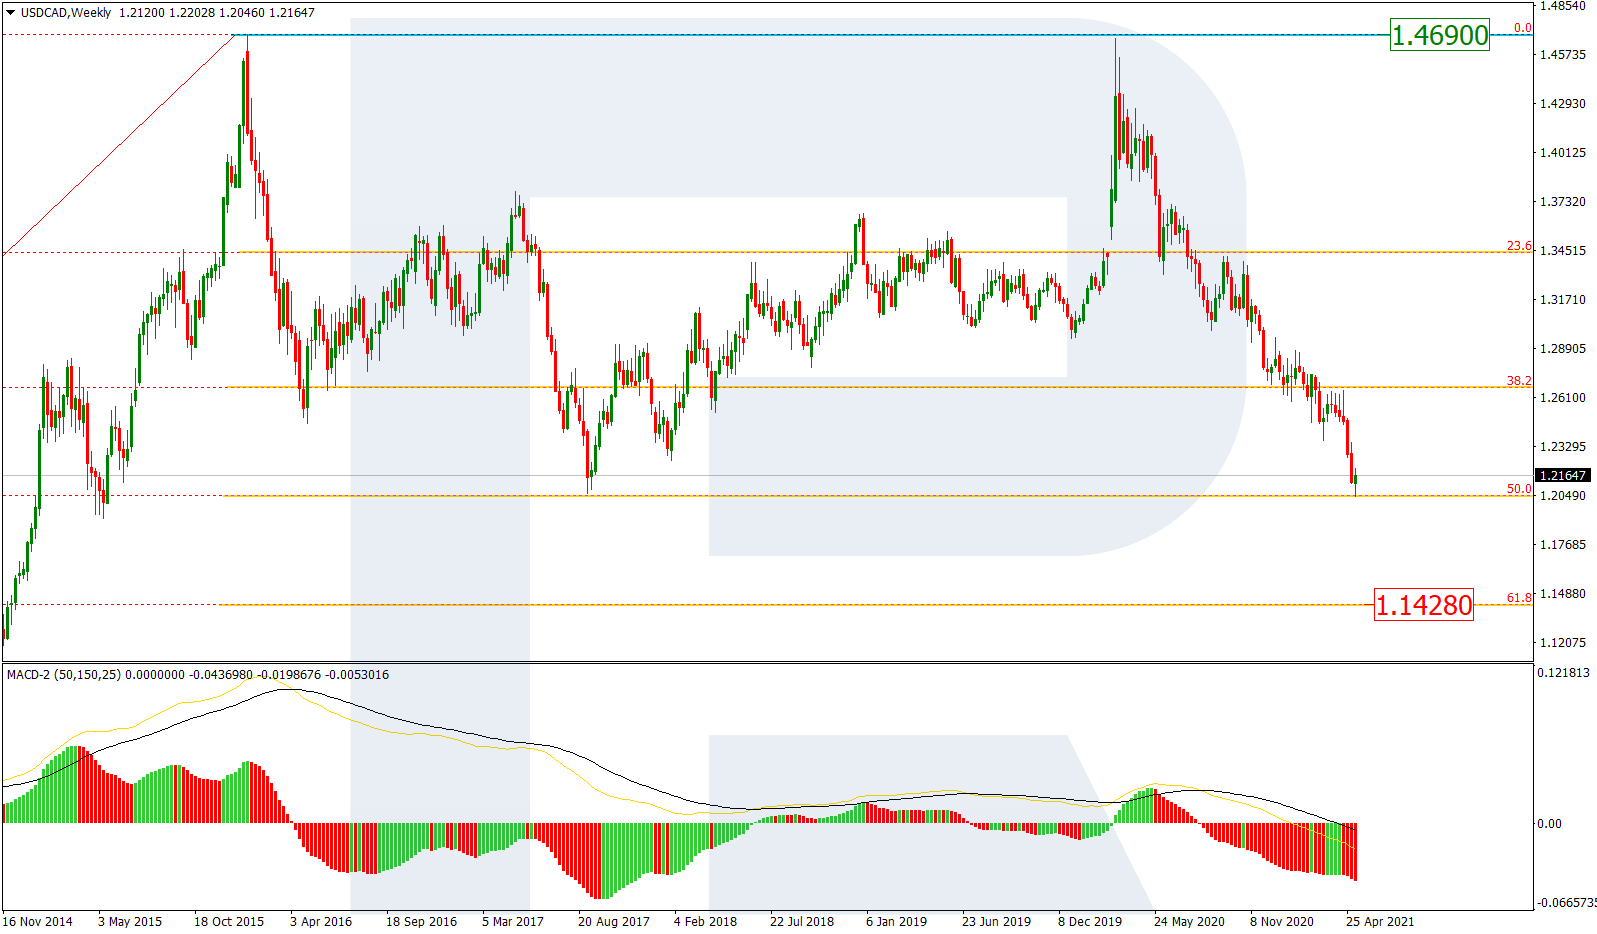
USDCAD, “US Dollar vs Canadian Dollar”
To understand what might happen to USDCAD in the nearest future, it will be better to look at the weekly chart. As we can see here, another long-term descending wave has re-tested 50.0% fibo. In this case, the asset is expected to continue falling to reach 61.8% fibo (1.1428) but only after correcting towards 38.2% fibo. One shouldn’t expect the instrument to grow towards the high at 1.4690 in the foreseeable future.
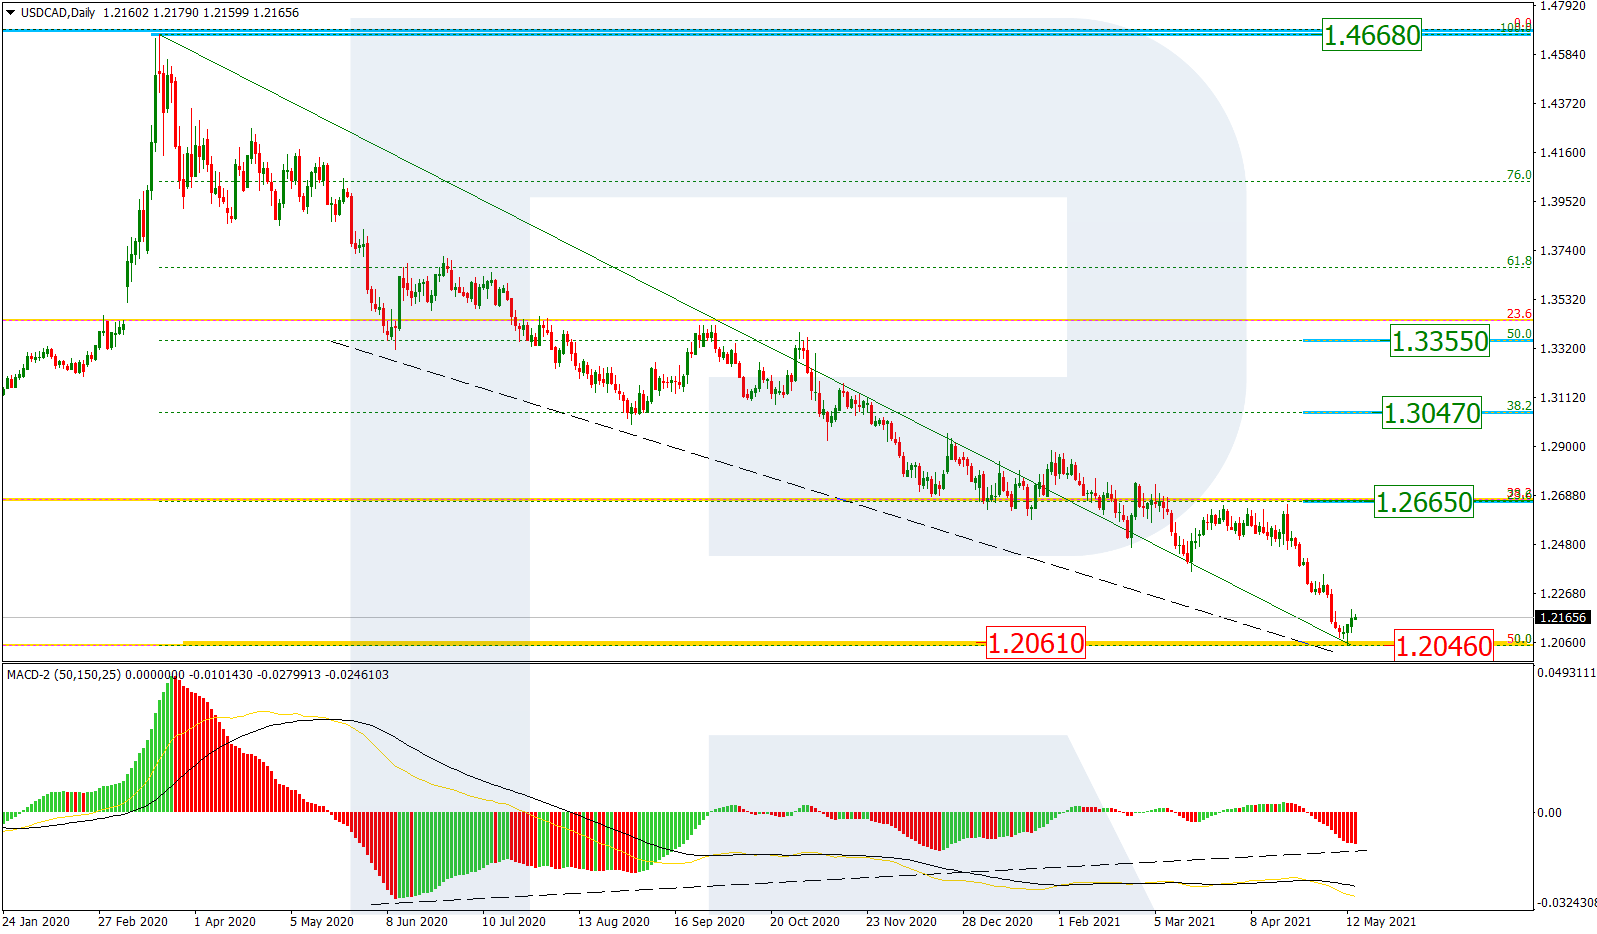
In the daily chart, USDCAD has tested the fractal at 1.2061. There is a convergence on MACD, which may hint at a new correctional uptrend in the next several months towards 23.6%, 38.2%, and 50.0% fibo at 1.2665, 1.3047, and 1.3355 respectively. The support is the low at 1.2046.
Article By RoboForex.com
Attention!
Forecasts presented in this section only reflect the author’s private opinion and should not be considered as guidance for trading. RoboForex LP bears no responsibility for trading results based on trading recommendations described in these analytical reviews.

- Gold Declines: Fed Policy and Geopolitics Weigh Jun 30, 2026
- Oil prices have once again risen above 70 dollars per barrel. The Australian dollar has updated a three‑month low Jun 30, 2026
- EUR/USD: The Advantage Remains with the Dollar Jun 29, 2026
- Escalation of the US–Iran conflict is once again supporting the rise in oil prices Jun 29, 2026
- Oil prices fall back to pre‑war levels. Silver drops to a 7‑month low Jun 25, 2026
- Gold Falls to an Eight-Month Low: This May Not Be the Bottom Jun 25, 2026
- Stock indices came under heavy selling pressure amid growing skepticism about AI investments Jun 24, 2026
- The Pound Is Pressured Not by Politics, but by a Strong US Dollar Jun 24, 2026
- Global crude oil prices continued to decline. The AUD/USD exchange rate hit an 11‑week low Jun 23, 2026
- EUR/USD Remains Under Sellers’ Control as the Dollar Stays Strong Jun 23, 2026