
Article By RoboForex.com
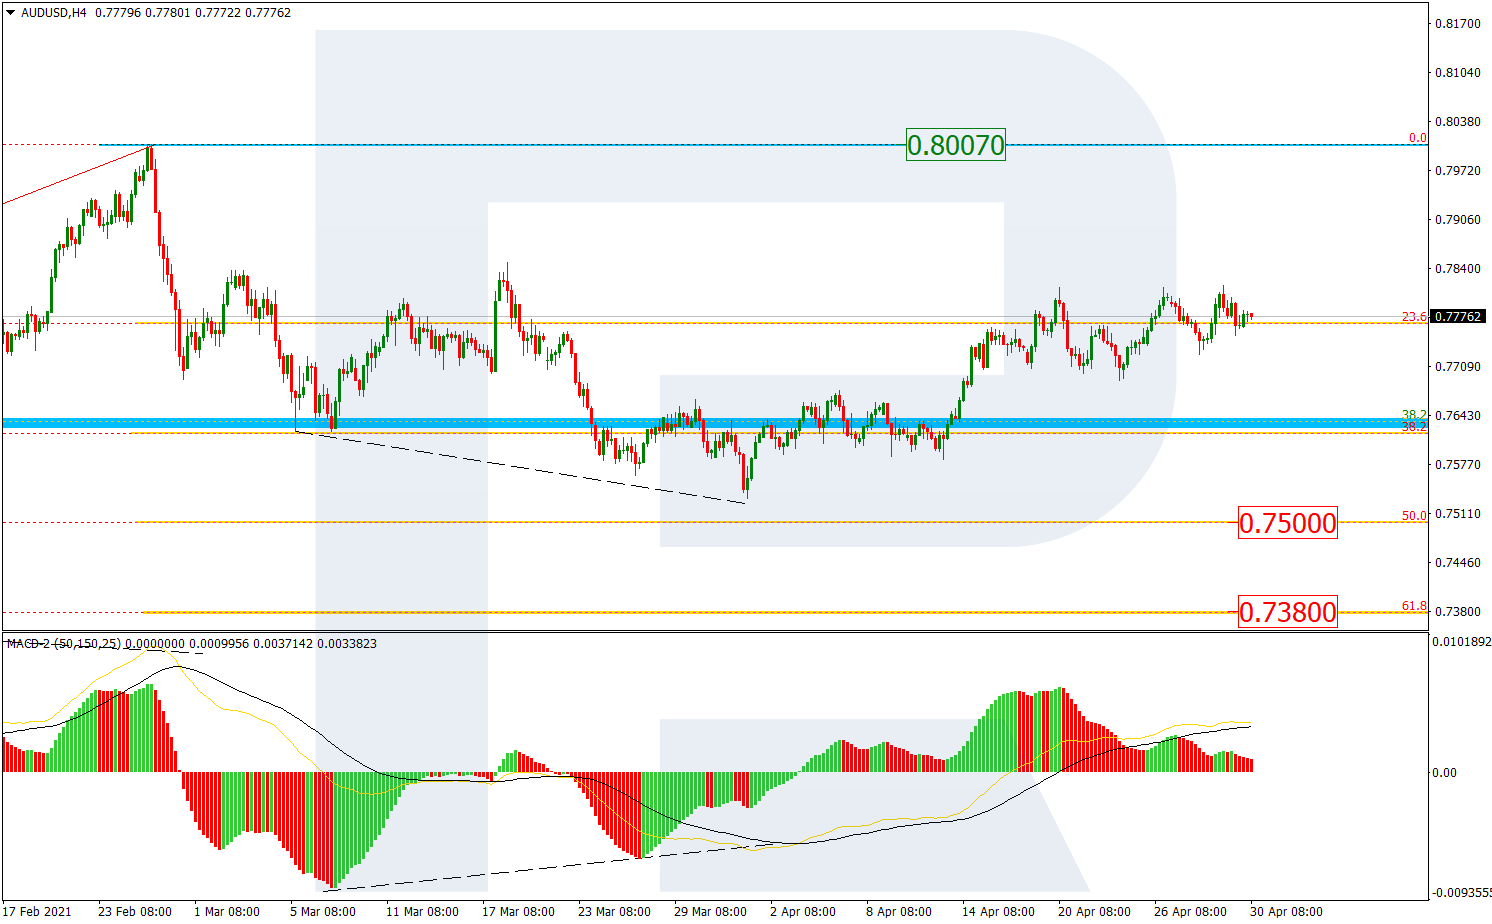
AUDUSD, “Australian Dollar vs US Dollar”
As we can see in the H4 chart, a convergence on MACD made AUDUSD return to 23.6% fibo; right now, the asset is still testing this level. This movement may be called a local consolidation. In this case, there are two possible scenarios for the asset to choose from. The first one implies a further uptrend towards the high at 0.8007. The second scenario suggests that the pair may break the range to the downside and continue the correction to reach 50.0% and 61.8% fibo at 0.7500 and 0.7380 respectively.

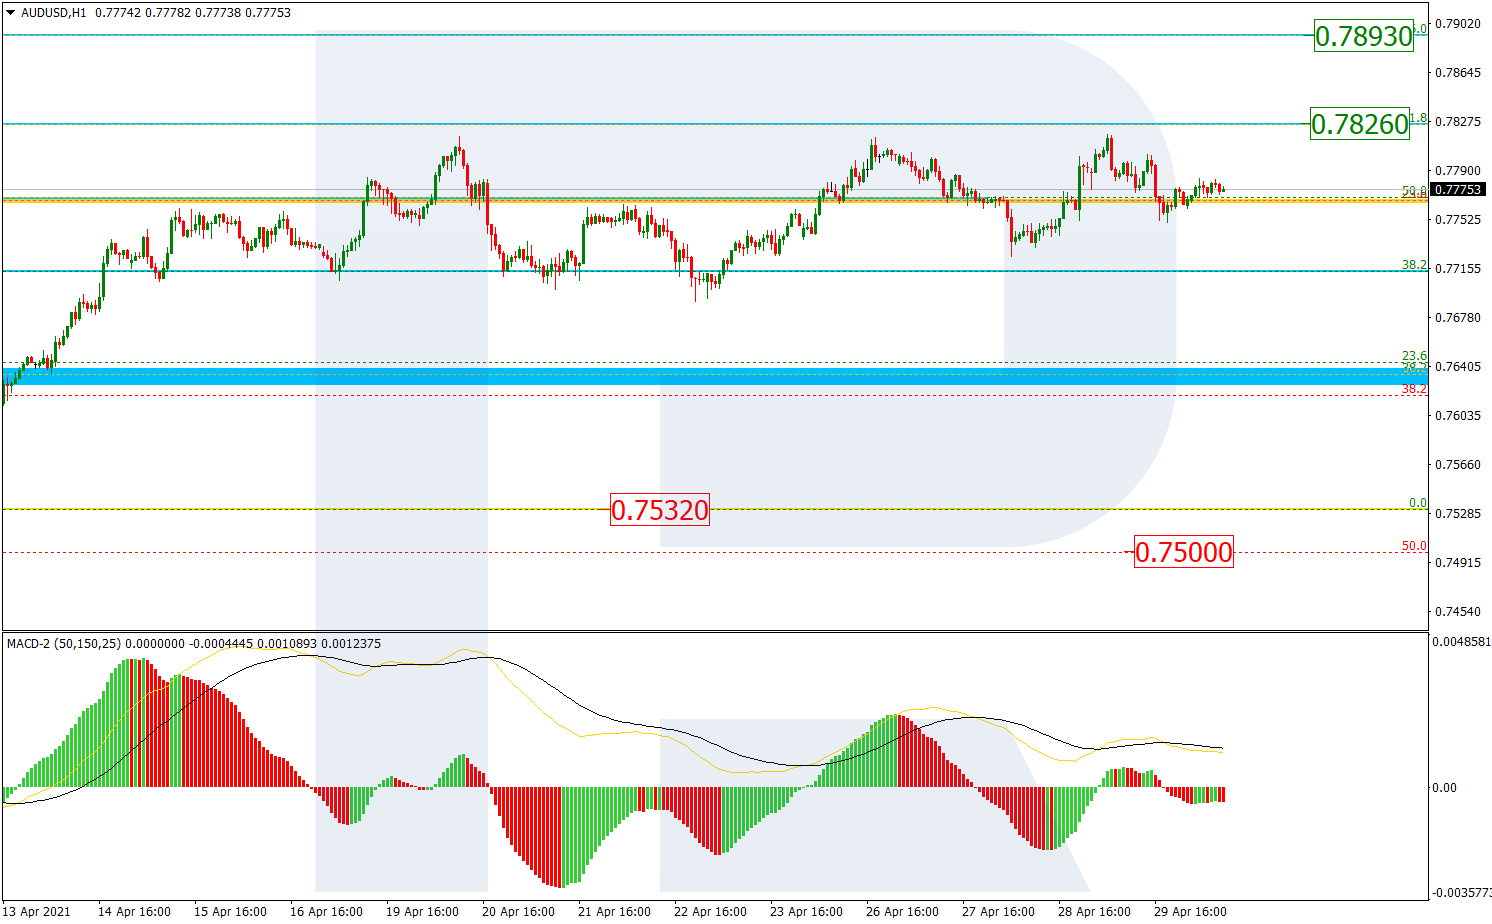
The H1 chart of UADUSD shows that the correctional uptrend is trying to reach 61.8% fibo at 0.7826. if the price breaks this level, it may continue growing towards 76.0% fibo at 0.7893 and then the high. The local support is the low at 0.7532.
Free Reports:
 Get our Weekly Commitment of Traders Reports - See where the biggest traders (Hedge Funds and Commercial Hedgers) are positioned in the futures markets on a weekly basis.
 Sign Up for Our Stock Market Newsletter – Get updated on News, Charts & Rankings of Public Companies when you join our Stocks Newsletter
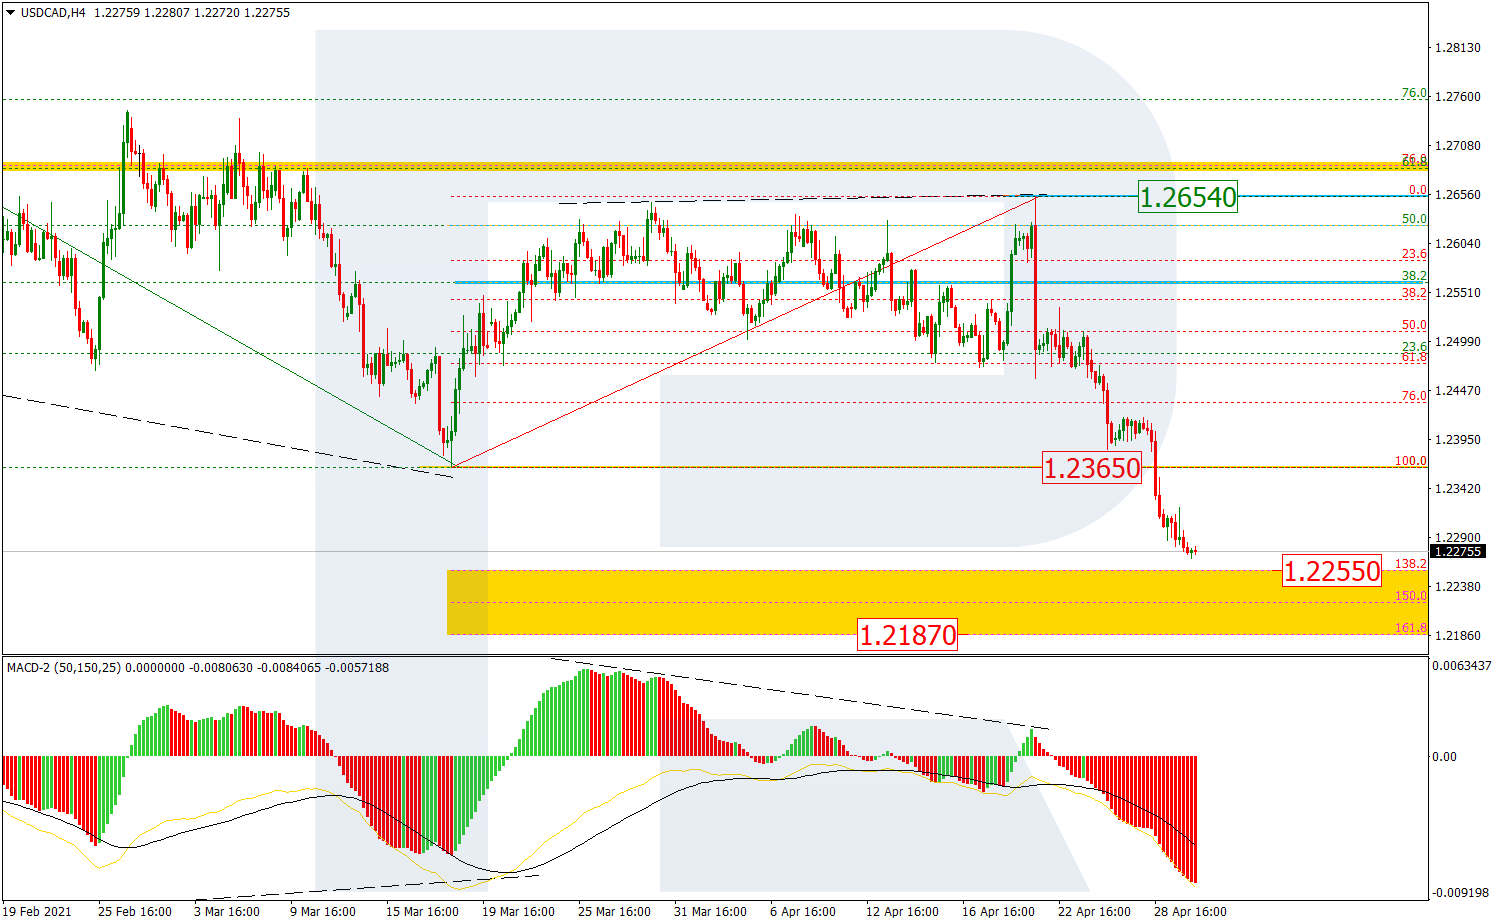
USDCAD, “US Dollar vs Canadian Dollar”
In the H4 chart, after finishing the correctional uptrend, USDCAD has formed a strong descending impulse to break the low at 1.2365. Later, the market may continue falling towards the post-correctional extension area between 138.2% and 161.8% fibo at 1.2255 and 1.2186 respectively. The resistance is the fractal high at 1.2654.
As we can see in the H1 chart, a convergence is making the pair finish the descending wave on its way towards the post-correctional extension area between 138.2% and 161.8% fibo at 1.2255 and 1.2187 respectively. Later, the asset may correct upwards to reach 23.6%, 38.2%, and 50.0% fibo at 1.2360, 1.2416, and 1.2461 respectively.

Article By RoboForex.com
Attention!
Forecasts presented in this section only reflect the author’s private opinion and should not be considered as guidance for trading. RoboForex LP bears no responsibility for trading results based on trading recommendations described in these analytical reviews.

- USD/JPY Continues Its Climb: Is There a Limit? Jun 11, 2026
- Investors launched broad profit‑taking in the technology sector. The Bank of Canada kept its rate at 2.25% Jun 11, 2026
- Gold (XAU/USD) Faces Persistent Selling Pressure Jun 10, 2026
- The US technology sector once again came under a wave of selling Jun 10, 2026
- China has shifted to using its own strategic oil reserves Jun 9, 2026
- GBP/USD Remains Under Pressure Despite Attempts to Recover Jun 9, 2026
- SpaceX IPO: Set for $75 billion liftoff Jun 8, 2026
- On Friday, the American stock market experienced one of the strongest crashes in recent times Jun 8, 2026
- EUR/USD at April Lows: What’s Next for the Pair? Jun 8, 2026
- The ceasefire between Israel and Lebanon has reduced the geopolitical premium Jun 5, 2026