
By CountingPips.com COT Home | Data Tables | Data Downloads | Newsletter
Here are the latest charts and statistics for the Commitment of Traders (COT) data published by the Commodities Futures Trading Commission (CFTC).
The latest COT data is updated through Tuesday April 20 2021 and shows a quick view of how large traders (for-profit speculators and commercial entities) were positioned in the futures markets.
CORN Futures:
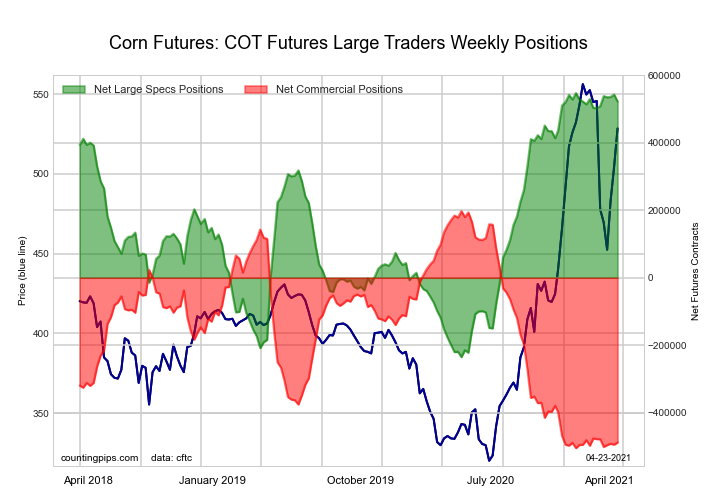
The CORN large speculator standing this week resulted in a net position of 522,745 contracts in the data reported through Tuesday. This was a weekly reduction of -20,541 contracts from the previous week which had a total of 543,286 net contracts.
This week’s current strength score (the trader positioning range over the past three years, measured from 0 to 100) shows the speculators are currently Bullish-Extreme with a score of 96.8 percent. The commercials are Bearish-Extreme with a score of 2.4 percent and the small traders (not shown in chart) are Bearish with a score of 28.1 percent.
| CORN Futures Statistics | SPECULATORS | COMMERCIALS | SMALL TRADERS |
| – Percent of Open Interest Longs: | 33.6 | 44.4 | 9.0 |
| – Percent of Open Interest Shorts: | 4.7 | 71.4 | 10.9 |
| – Net Position: | 522,745 | -488,504 | -34,241 |
| – Gross Longs: | 607,454 | 804,549 | 162,882 |
| – Gross Shorts: | 84,709 | 1,293,053 | 197,123 |
| – Long to Short Ratio: | 7.2 to 1 | 0.6 to 1 | 0.8 to 1 |
| NET POSITION TREND: | |||
| – COT Index Score (3 Year Range Pct): | 96.8 | 2.4 | 28.1 |
| – COT Index Reading (3 Year Range): | Bullish-Extreme | Bearish-Extreme | Bearish |
| NET POSITION MOVEMENT INDEX: | |||
| – 6-Week Change in Strength Index: | 2.5 | -1.5 | -4.9 |
Free Reports:
 Get our Weekly Commitment of Traders Reports - See where the biggest traders (Hedge Funds and Commercial Hedgers) are positioned in the futures markets on a weekly basis.
 Sign Up for Our Stock Market Newsletter – Get updated on News, Charts & Rankings of Public Companies when you join our Stocks Newsletter
SUGAR Futures:
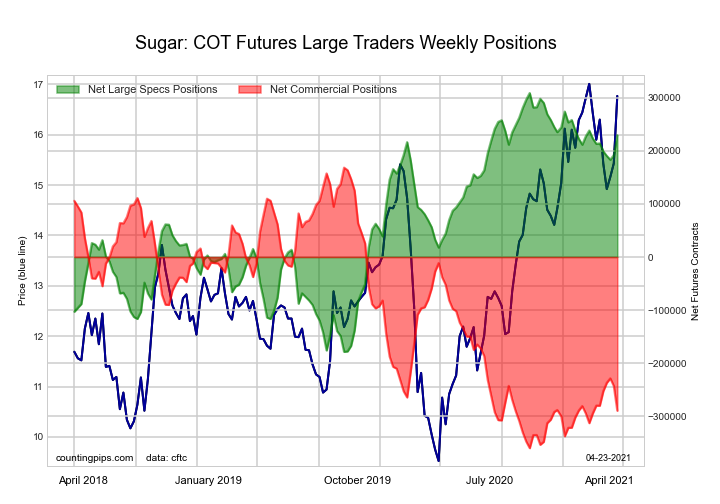
The SUGAR large speculator standing this week resulted in a net position of 229,169 contracts in the data reported through Tuesday. This was a weekly gain of 37,552 contracts from the previous week which had a total of 191,617 net contracts.
This week’s current strength score (the trader positioning range over the past three years, measured from 0 to 100) shows the speculators are currently Bullish-Extreme with a score of 83.7 percent. The commercials are Bearish-Extreme with a score of 13.3 percent and the small traders (not shown in chart) are Bullish-Extreme with a score of 82.0 percent.
| SUGAR Futures Statistics | SPECULATORS | COMMERCIALS | SMALL TRADERS |
| – Percent of Open Interest Longs: | 27.2 | 50.0 | 9.8 |
| – Percent of Open Interest Shorts: | 4.6 | 78.5 | 3.9 |
| – Net Position: | 229,169 | -289,150 | 59,981 |
| – Gross Longs: | 275,744 | 507,114 | 99,684 |
| – Gross Shorts: | 46,575 | 796,264 | 39,703 |
| – Long to Short Ratio: | 5.9 to 1 | 0.6 to 1 | 2.5 to 1 |
| NET POSITION TREND: | |||
| – COT Index Score (3 Year Range Pct): | 83.7 | 13.3 | 82.0 |
| – COT Index Reading (3 Year Range): | Bullish-Extreme | Bearish-Extreme | Bullish-Extreme |
| NET POSITION MOVEMENT INDEX: | |||
| – 6-Week Change in Strength Index: | 3.3 | -1.8 | -8.3 |
COFFEE Futures:

The COFFEE large speculator standing this week resulted in a net position of 42,102 contracts in the data reported through Tuesday. This was a weekly lift of 7,242 contracts from the previous week which had a total of 34,860 net contracts.
This week’s current strength score (the trader positioning range over the past three years, measured from 0 to 100) shows the speculators are currently Bullish-Extreme with a score of 85.3 percent. The commercials are Bearish-Extreme with a score of 15.7 percent and the small traders (not shown in chart) are Bearish-Extreme with a score of 16.6 percent.
| COFFEE Futures Statistics | SPECULATORS | COMMERCIALS | SMALL TRADERS |
| – Percent of Open Interest Longs: | 25.0 | 50.4 | 4.0 |
| – Percent of Open Interest Shorts: | 9.6 | 67.3 | 2.5 |
| – Net Position: | 42,102 | -46,183 | 4,081 |
| – Gross Longs: | 68,374 | 138,164 | 10,965 |
| – Gross Shorts: | 26,272 | 184,347 | 6,884 |
| – Long to Short Ratio: | 2.6 to 1 | 0.7 to 1 | 1.6 to 1 |
| NET POSITION TREND: | |||
| – COT Index Score (3 Year Range Pct): | 85.3 | 15.7 | 16.6 |
| – COT Index Reading (3 Year Range): | Bullish-Extreme | Bearish-Extreme | Bearish-Extreme |
| NET POSITION MOVEMENT INDEX: | |||
| – 6-Week Change in Strength Index: | -7.1 | 8.5 | -11.8 |
SOYBEANS Futures:
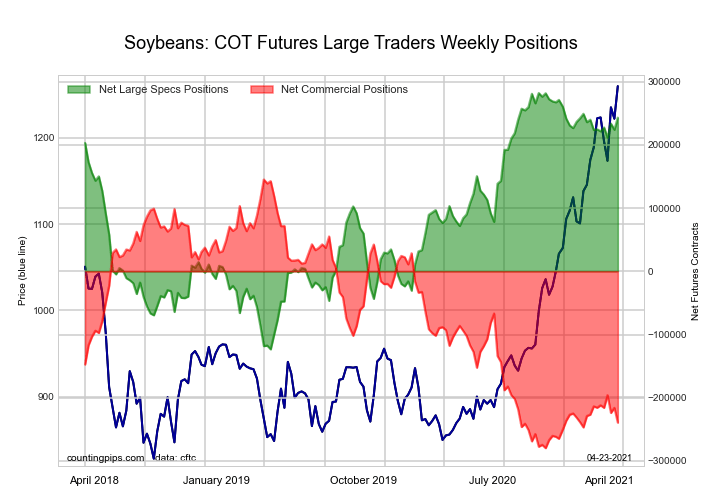
The SOYBEANS large speculator standing this week resulted in a net position of 243,162 contracts in the data reported through Tuesday. This was a weekly rise of 19,144 contracts from the previous week which had a total of 224,018 net contracts.
This week’s current strength score (the trader positioning range over the past three years, measured from 0 to 100) shows the speculators are currently Bullish-Extreme with a score of 90.4 percent. The commercials are Bearish-Extreme with a score of 9.5 percent and the small traders (not shown in chart) are Bullish with a score of 71.5 percent.
| SOYBEANS Futures Statistics | SPECULATORS | COMMERCIALS | SMALL TRADERS |
| – Percent of Open Interest Longs: | 32.3 | 44.1 | 8.1 |
| – Percent of Open Interest Shorts: | 5.3 | 70.7 | 8.5 |
| – Net Position: | 243,162 | -239,391 | -3,771 |
| – Gross Longs: | 290,953 | 397,485 | 72,842 |
| – Gross Shorts: | 47,791 | 636,876 | 76,613 |
| – Long to Short Ratio: | 6.1 to 1 | 0.6 to 1 | 1.0 to 1 |
| NET POSITION TREND: | |||
| – COT Index Score (3 Year Range Pct): | 90.4 | 9.5 | 71.5 |
| – COT Index Reading (3 Year Range): | Bullish-Extreme | Bearish-Extreme | Bullish |
| NET POSITION MOVEMENT INDEX: | |||
| – 6-Week Change in Strength Index: | 4.5 | -5.5 | 7.0 |
SOYBEAN OIL Futures:
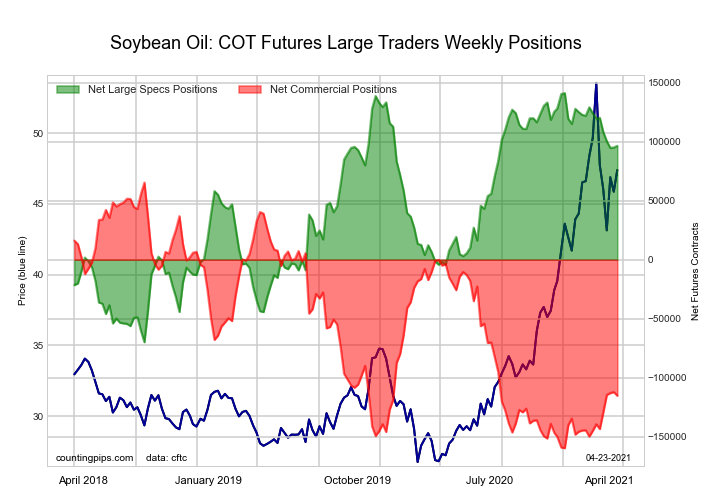
The SOYBEAN OIL large speculator standing this week resulted in a net position of 96,464 contracts in the data reported through Tuesday. This was a weekly lift of 1,361 contracts from the previous week which had a total of 95,103 net contracts.
This week’s current strength score (the trader positioning range over the past three years, measured from 0 to 100) shows the speculators are currently Bullish with a score of 78.8 percent. The commercials are Bearish-Extreme with a score of 19.7 percent and the small traders (not shown in chart) are Bullish-Extreme with a score of 83.3 percent.
| SOYBEAN OIL Futures Statistics | SPECULATORS | COMMERCIALS | SMALL TRADERS |
| – Percent of Open Interest Longs: | 26.5 | 47.2 | 8.9 |
| – Percent of Open Interest Shorts: | 7.8 | 69.6 | 5.3 |
| – Net Position: | 96,464 | -115,178 | 18,714 |
| – Gross Longs: | 136,447 | 242,601 | 46,000 |
| – Gross Shorts: | 39,983 | 357,779 | 27,286 |
| – Long to Short Ratio: | 3.4 to 1 | 0.7 to 1 | 1.7 to 1 |
| NET POSITION TREND: | |||
| – COT Index Score (3 Year Range Pct): | 78.8 | 19.7 | 83.3 |
| – COT Index Reading (3 Year Range): | Bullish | Bearish-Extreme | Bullish-Extreme |
| NET POSITION MOVEMENT INDEX: | |||
| – 6-Week Change in Strength Index: | -11.0 | 10.7 | -3.6 |
SOYBEAN MEAL Futures:

The SOYBEAN MEAL large speculator standing this week resulted in a net position of 82,909 contracts in the data reported through Tuesday. This was a weekly boost of 7,248 contracts from the previous week which had a total of 75,661 net contracts.
This week’s current strength score (the trader positioning range over the past three years, measured from 0 to 100) shows the speculators are currently Bullish with a score of 61.0 percent. The commercials are Bearish with a score of 34.1 percent and the small traders (not shown in chart) are Bullish-Extreme with a score of 82.7 percent.
| SOYBEAN MEAL Futures Statistics | SPECULATORS | COMMERCIALS | SMALL TRADERS |
| – Percent of Open Interest Longs: | 24.2 | 47.9 | 13.2 |
| – Percent of Open Interest Shorts: | 4.2 | 74.7 | 6.4 |
| – Net Position: | 82,909 | -110,885 | 27,976 |
| – Gross Longs: | 100,186 | 198,766 | 54,628 |
| – Gross Shorts: | 17,277 | 309,651 | 26,652 |
| – Long to Short Ratio: | 5.8 to 1 | 0.6 to 1 | 2.0 to 1 |
| NET POSITION TREND: | |||
| – COT Index Score (3 Year Range Pct): | 61.0 | 34.1 | 82.7 |
| – COT Index Reading (3 Year Range): | Bullish | Bearish | Bullish-Extreme |
| NET POSITION MOVEMENT INDEX: | |||
| – 6-Week Change in Strength Index: | -5.2 | 5.1 | 0.2 |
LIVE CATTLE Futures:
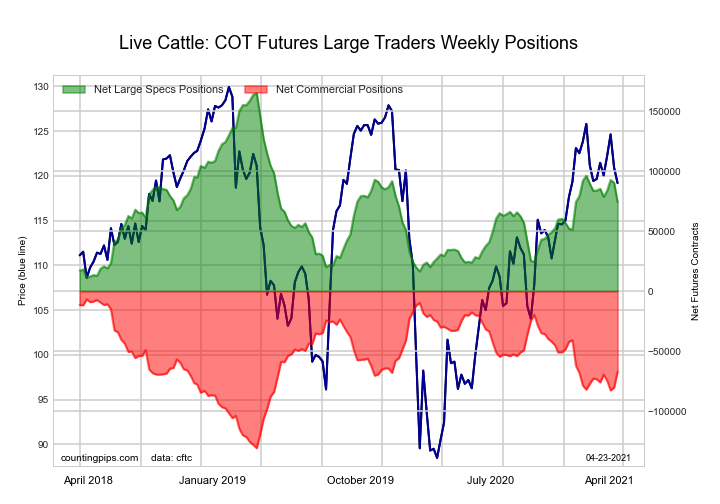
The LIVE CATTLE large speculator standing this week resulted in a net position of 74,205 contracts in the data reported through Tuesday. This was a weekly fall of -16,098 contracts from the previous week which had a total of 90,303 net contracts.
This week’s current strength score (the trader positioning range over the past three years, measured from 0 to 100) shows the speculators are currently Bearish with a score of 40.9 percent. The commercials are Bullish with a score of 51.4 percent and the small traders (not shown in chart) are Bullish with a score of 69.6 percent.
| LIVE CATTLE Futures Statistics | SPECULATORS | COMMERCIALS | SMALL TRADERS |
| – Percent of Open Interest Longs: | 37.8 | 36.2 | 9.5 |
| – Percent of Open Interest Shorts: | 15.3 | 56.5 | 11.6 |
| – Net Position: | 74,205 | -67,019 | -7,186 |
| – Gross Longs: | 124,458 | 119,166 | 31,169 |
| – Gross Shorts: | 50,253 | 186,185 | 38,355 |
| – Long to Short Ratio: | 2.5 to 1 | 0.6 to 1 | 0.8 to 1 |
| NET POSITION TREND: | |||
| – COT Index Score (3 Year Range Pct): | 40.9 | 51.4 | 69.6 |
| – COT Index Reading (3 Year Range): | Bearish | Bullish | Bullish |
| NET POSITION MOVEMENT INDEX: | |||
| – 6-Week Change in Strength Index: | -6.3 | 5.1 | 8.0 |
LEAN HOGS Futures:
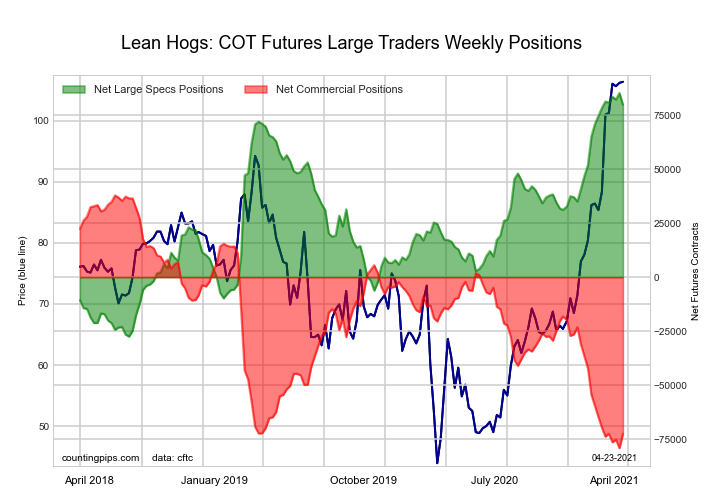
The LEAN HOGS large speculator standing this week resulted in a net position of 79,777 contracts in the data reported through Tuesday. This was a weekly decrease of -5,430 contracts from the previous week which had a total of 85,207 net contracts.
This week’s current strength score (the trader positioning range over the past three years, measured from 0 to 100) shows the speculators are currently Bullish-Extreme with a score of 95.2 percent. The commercials are Bearish-Extreme with a score of 5.7 percent and the small traders (not shown in chart) are Bearish with a score of 43.1 percent.
| LEAN HOGS Futures Statistics | SPECULATORS | COMMERCIALS | SMALL TRADERS |
| – Percent of Open Interest Longs: | 40.5 | 30.1 | 8.8 |
| – Percent of Open Interest Shorts: | 12.4 | 55.6 | 11.4 |
| – Net Position: | 79,777 | -72,487 | -7,290 |
| – Gross Longs: | 115,066 | 85,596 | 25,038 |
| – Gross Shorts: | 35,289 | 158,083 | 32,328 |
| – Long to Short Ratio: | 3.3 to 1 | 0.5 to 1 | 0.8 to 1 |
| NET POSITION TREND: | |||
| – COT Index Score (3 Year Range Pct): | 95.2 | 5.7 | 43.1 |
| – COT Index Reading (3 Year Range): | Bullish-Extreme | Bearish-Extreme | Bearish |
| NET POSITION MOVEMENT INDEX: | |||
| – 6-Week Change in Strength Index: | 1.3 | -2.5 | 6.8 |
COTTON Futures:
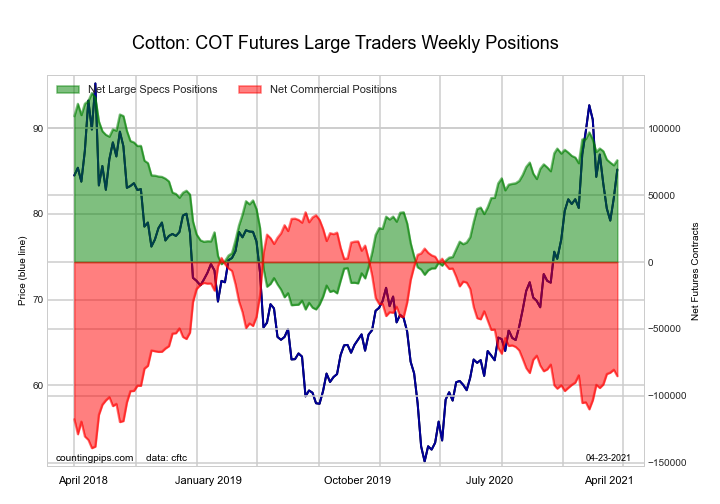
The COTTON large speculator standing this week resulted in a net position of 76,196 contracts in the data reported through Tuesday. This was a weekly gain of 3,816 contracts from the previous week which had a total of 72,380 net contracts.
This week’s current strength score (the trader positioning range over the past three years, measured from 0 to 100) shows the speculators are currently Bullish with a score of 69.0 percent. The commercials are Bearish with a score of 30.5 percent and the small traders (not shown in chart) are Bullish with a score of 65.5 percent.
| COTTON Futures Statistics | SPECULATORS | COMMERCIALS | SMALL TRADERS |
| – Percent of Open Interest Longs: | 40.1 | 40.7 | 7.9 |
| – Percent of Open Interest Shorts: | 4.4 | 80.6 | 3.7 |
| – Net Position: | 76,196 | -85,259 | 9,063 |
| – Gross Longs: | 85,605 | 86,878 | 16,975 |
| – Gross Shorts: | 9,409 | 172,137 | 7,912 |
| – Long to Short Ratio: | 9.1 to 1 | 0.5 to 1 | 2.1 to 1 |
| NET POSITION TREND: | |||
| – COT Index Score (3 Year Range Pct): | 69.0 | 30.5 | 65.5 |
| – COT Index Reading (3 Year Range): | Bullish | Bearish | Bullish |
| NET POSITION MOVEMENT INDEX: | |||
| – 6-Week Change in Strength Index: | -3.8 | 3.7 | -2.0 |
COCOA Futures:
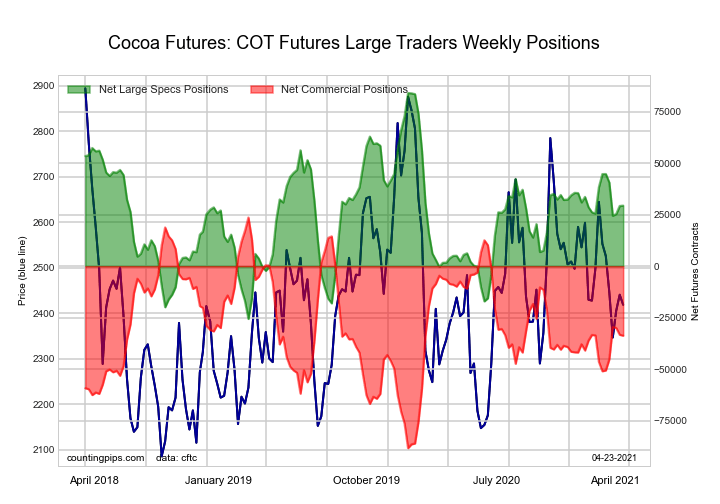
The COCOA large speculator standing this week resulted in a net position of 29,415 contracts in the data reported through Tuesday. This was a weekly lift of 163 contracts from the previous week which had a total of 29,252 net contracts.
This week’s current strength score (the trader positioning range over the past three years, measured from 0 to 100) shows the speculators are currently Bullish with a score of 50.2 percent. The commercials are Bearish with a score of 48.8 percent and the small traders (not shown in chart) are Bullish with a score of 57.2 percent.
| COCOA Futures Statistics | SPECULATORS | COMMERCIALS | SMALL TRADERS |
| – Percent of Open Interest Longs: | 30.1 | 43.1 | 5.7 |
| – Percent of Open Interest Shorts: | 15.2 | 60.2 | 3.5 |
| – Net Position: | 29,415 | -33,696 | 4,281 |
| – Gross Longs: | 59,138 | 84,463 | 11,088 |
| – Gross Shorts: | 29,723 | 118,159 | 6,807 |
| – Long to Short Ratio: | 2.0 to 1 | 0.7 to 1 | 1.6 to 1 |
| NET POSITION TREND: | |||
| – COT Index Score (3 Year Range Pct): | 50.2 | 48.8 | 57.2 |
| – COT Index Reading (3 Year Range): | Bullish | Bearish | Bullish |
| NET POSITION MOVEMENT INDEX: | |||
| – 6-Week Change in Strength Index: | -14.0 | 15.4 | -22.2 |
WHEAT Futures:
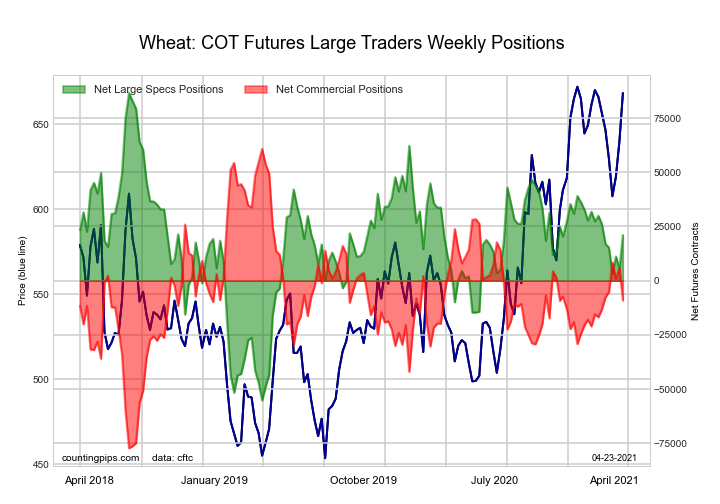
The WHEAT large speculator standing this week resulted in a net position of 21,025 contracts in the data reported through Tuesday. This was a weekly advance of 15,509 contracts from the previous week which had a total of 5,516 net contracts.
This week’s current strength score (the trader positioning range over the past three years, measured from 0 to 100) shows the speculators are currently Bullish with a score of 53.8 percent. The commercials are Bearish with a score of 49.4 percent and the small traders (not shown in chart) are Bearish with a score of 44.6 percent.
| WHEAT Futures Statistics | SPECULATORS | COMMERCIALS | SMALL TRADERS |
| – Percent of Open Interest Longs: | 29.7 | 35.6 | 6.8 |
| – Percent of Open Interest Shorts: | 24.9 | 37.7 | 9.5 |
| – Net Position: | 21,025 | -9,092 | -11,933 |
| – Gross Longs: | 130,922 | 157,098 | 30,163 |
| – Gross Shorts: | 109,897 | 166,190 | 42,096 |
| – Long to Short Ratio: | 1.2 to 1 | 0.9 to 1 | 0.7 to 1 |
| NET POSITION TREND: | |||
| – COT Index Score (3 Year Range Pct): | 53.8 | 49.4 | 44.6 |
| – COT Index Reading (3 Year Range): | Bullish | Bearish | Bearish |
| NET POSITION MOVEMENT INDEX: | |||
| – 6-Week Change in Strength Index: | -3.6 | 3.0 | 4.7 |
Article By CountingPips.com – Receive our weekly COT Reports by Email
*COT Report: The COT data, released weekly to the public each Friday, is updated through the most recent Tuesday (data is 3 days old) and shows a quick view of how large speculators or non-commercials (for-profit traders) were positioned in the futures markets.
The CFTC categorizes trader positions according to commercial hedgers (traders who use futures contracts for hedging as part of the business), non-commercials (large traders who speculate to realize trading profits) and nonreportable traders (usually small traders/speculators).
Find CFTC criteria here: (http://www.cftc.gov/MarketReports/CommitmentsofTraders/ExplanatoryNotes/index.htm).

- USD/JPY Continues Its Climb: Is There a Limit? Jun 11, 2026
- Investors launched broad profit‑taking in the technology sector. The Bank of Canada kept its rate at 2.25% Jun 11, 2026
- Gold (XAU/USD) Faces Persistent Selling Pressure Jun 10, 2026
- The US technology sector once again came under a wave of selling Jun 10, 2026
- China has shifted to using its own strategic oil reserves Jun 9, 2026
- GBP/USD Remains Under Pressure Despite Attempts to Recover Jun 9, 2026
- SpaceX IPO: Set for $75 billion liftoff Jun 8, 2026
- On Friday, the American stock market experienced one of the strongest crashes in recent times Jun 8, 2026
- EUR/USD at April Lows: What’s Next for the Pair? Jun 8, 2026
- The ceasefire between Israel and Lebanon has reduced the geopolitical premium Jun 5, 2026