
Article By RoboForex.com
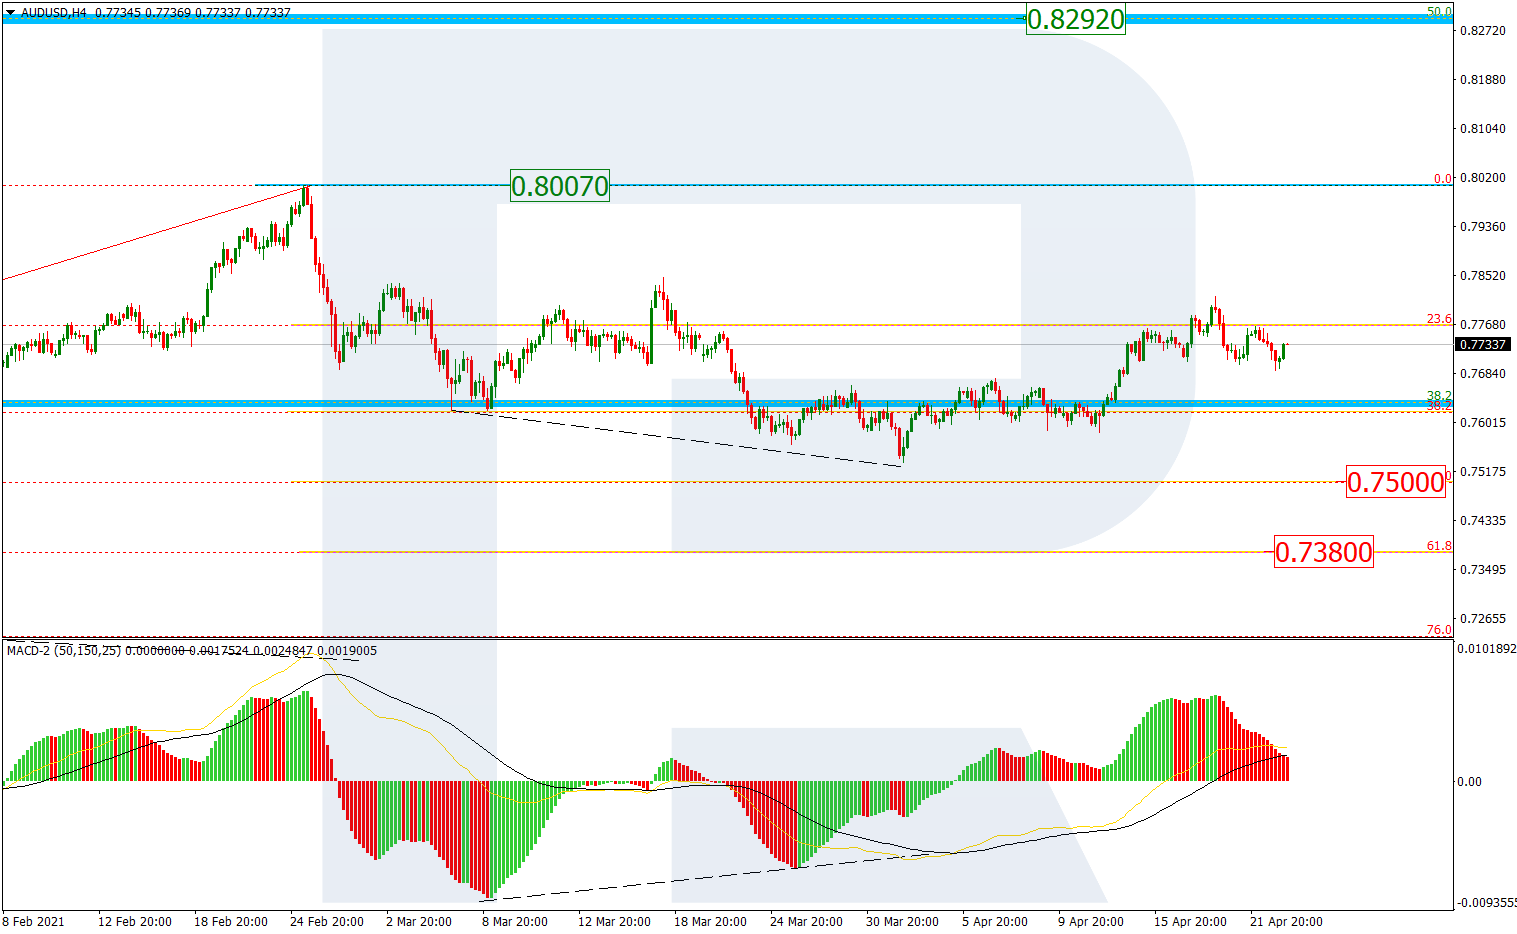
AUDUSD, “Australian Dollar vs US Dollar”
As we can see in the H4 chart, a convergence on MACD made AUDUSD return to 23.6% fibo and form another pullback there, which may be later followed by a further uptrend towards the high at 0.8007 and the long-term 50.0% fibo at 0.8292. On the other hand, the instrument may yet rebound from the high and resume its decline towards 50.0% and 61.8% fibo at 0.7500 and 0.7380 respectively.

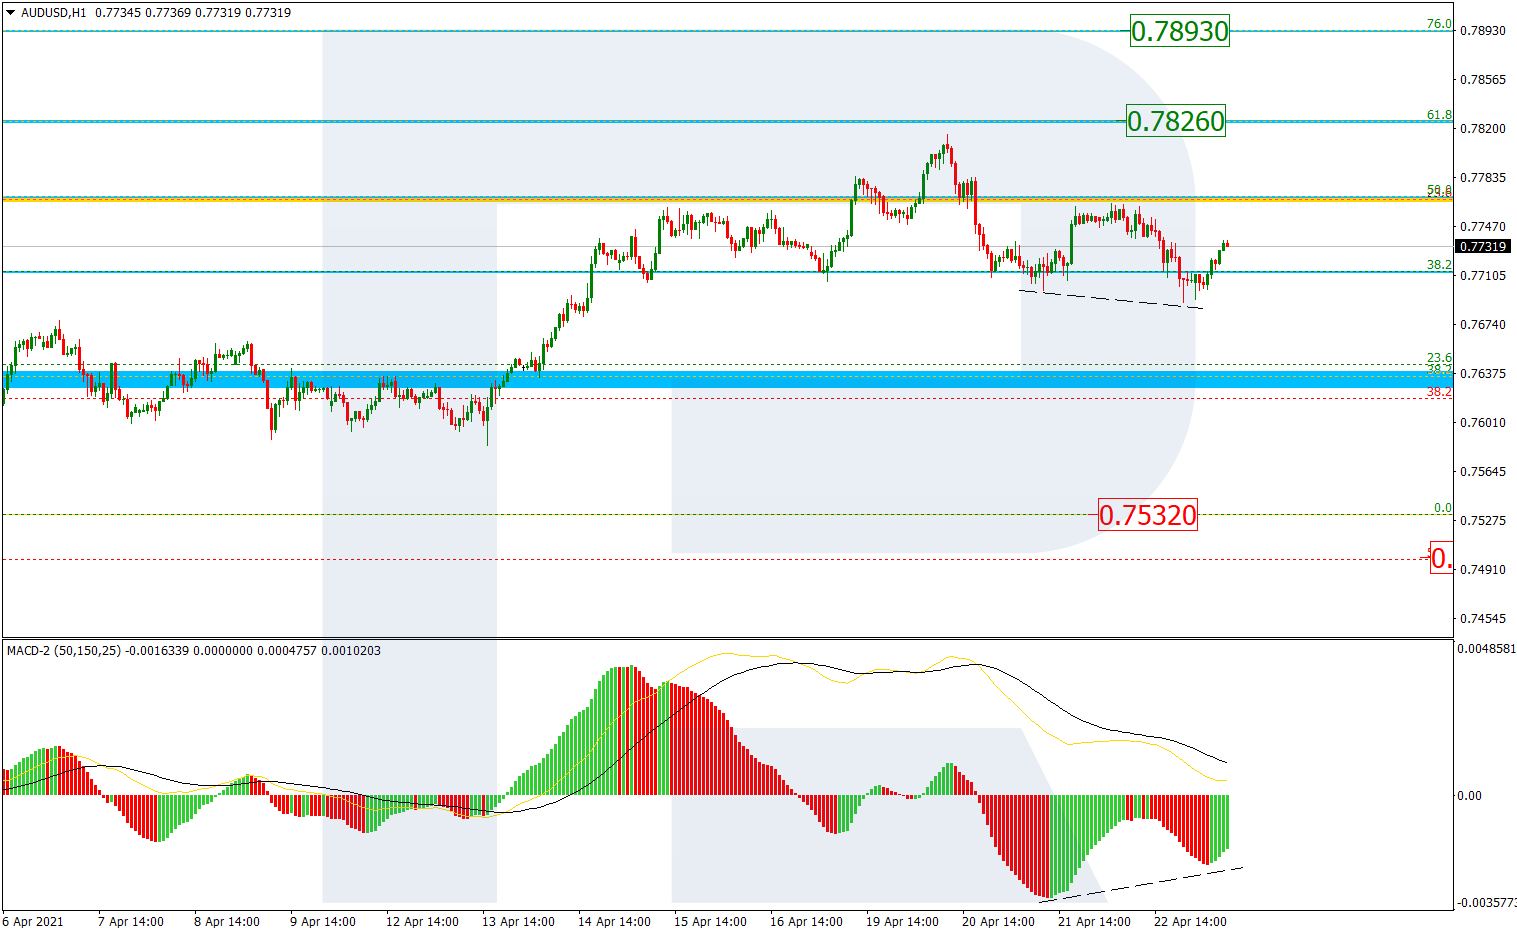
The H1 chart shows that convergence on MACD is signaling that the local correction may be over. Later, the price may continue growing towards 61.8% and 76.0% fibo at 0.7826 and 0.7893 respectively. The local support is the low at 0.7532.
Free Reports:
 Download Our Metatrader 4 Indicators – Put Our Free MetaTrader 4 Custom Indicators on your charts when you join our Weekly Newsletter
 Get our Weekly Commitment of Traders Reports - See where the biggest traders (Hedge Funds and Commercial Hedgers) are positioned in the futures markets on a weekly basis.
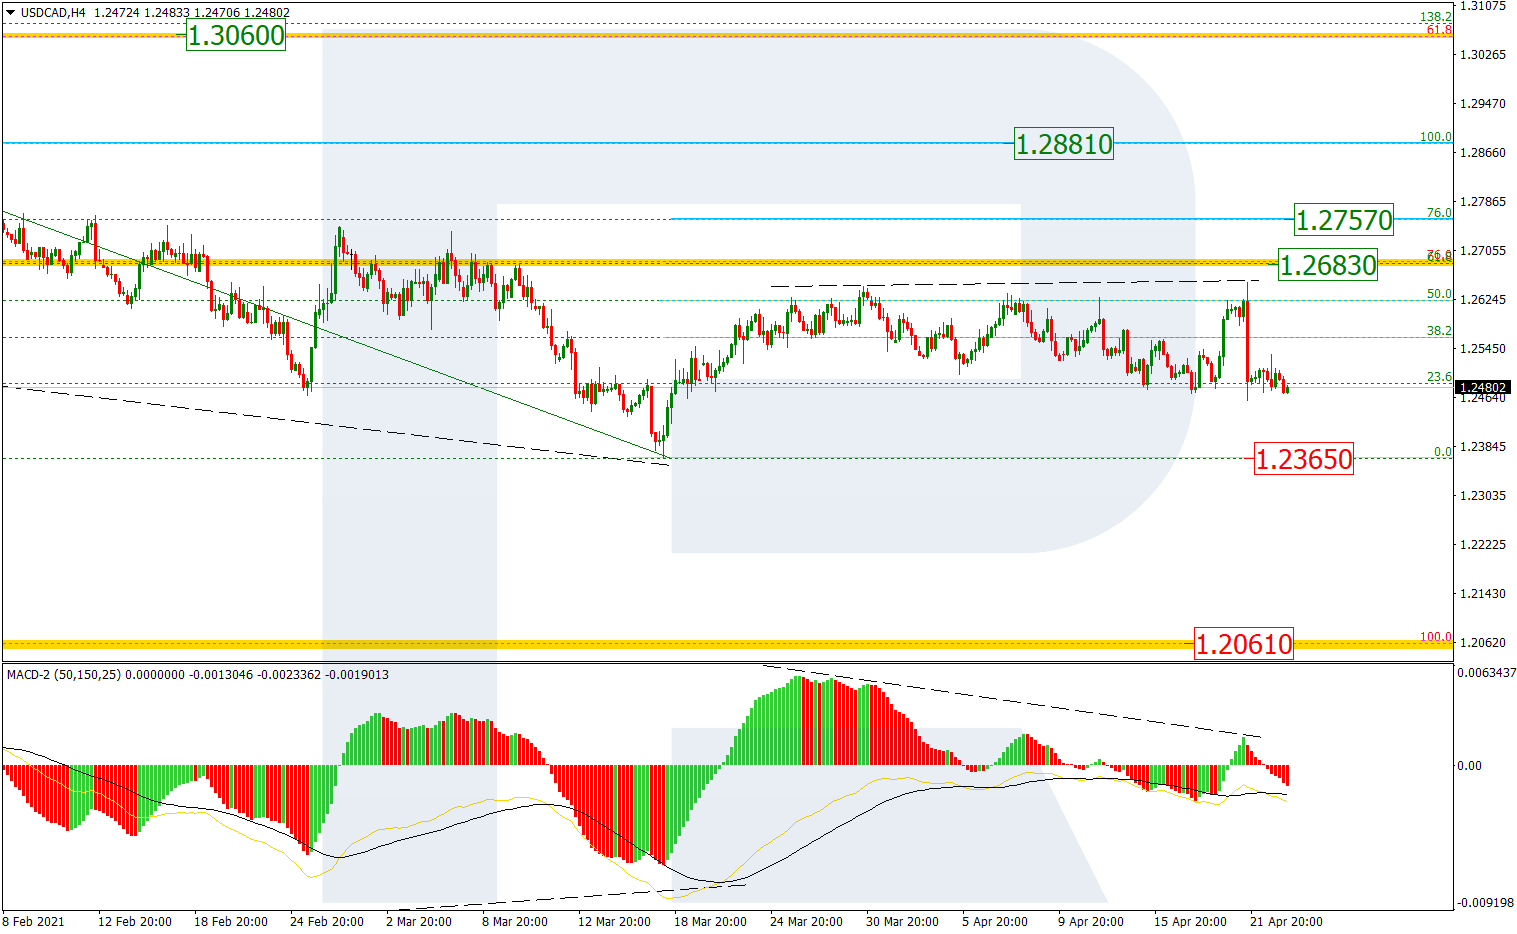
USDCAD, “US Dollar vs Canadian Dollar”
In the H4 chart, USDCAD is trading sideways and correcting after finishing the descending wave. The asset is stuck between 23.6% and 50.0% fibo. Also, there is a divergence on MACD, which may indicate a possible wave to the downside towards the local and fractal lows at 1.2365 and 1.2061 respectively. However, if the price rebounds from the low, the pair may resume growing to reach 61.8% and 76.0% fibo at 1.2683 and 1.2757 respectively but the key upside target is the local high at 1.2881.
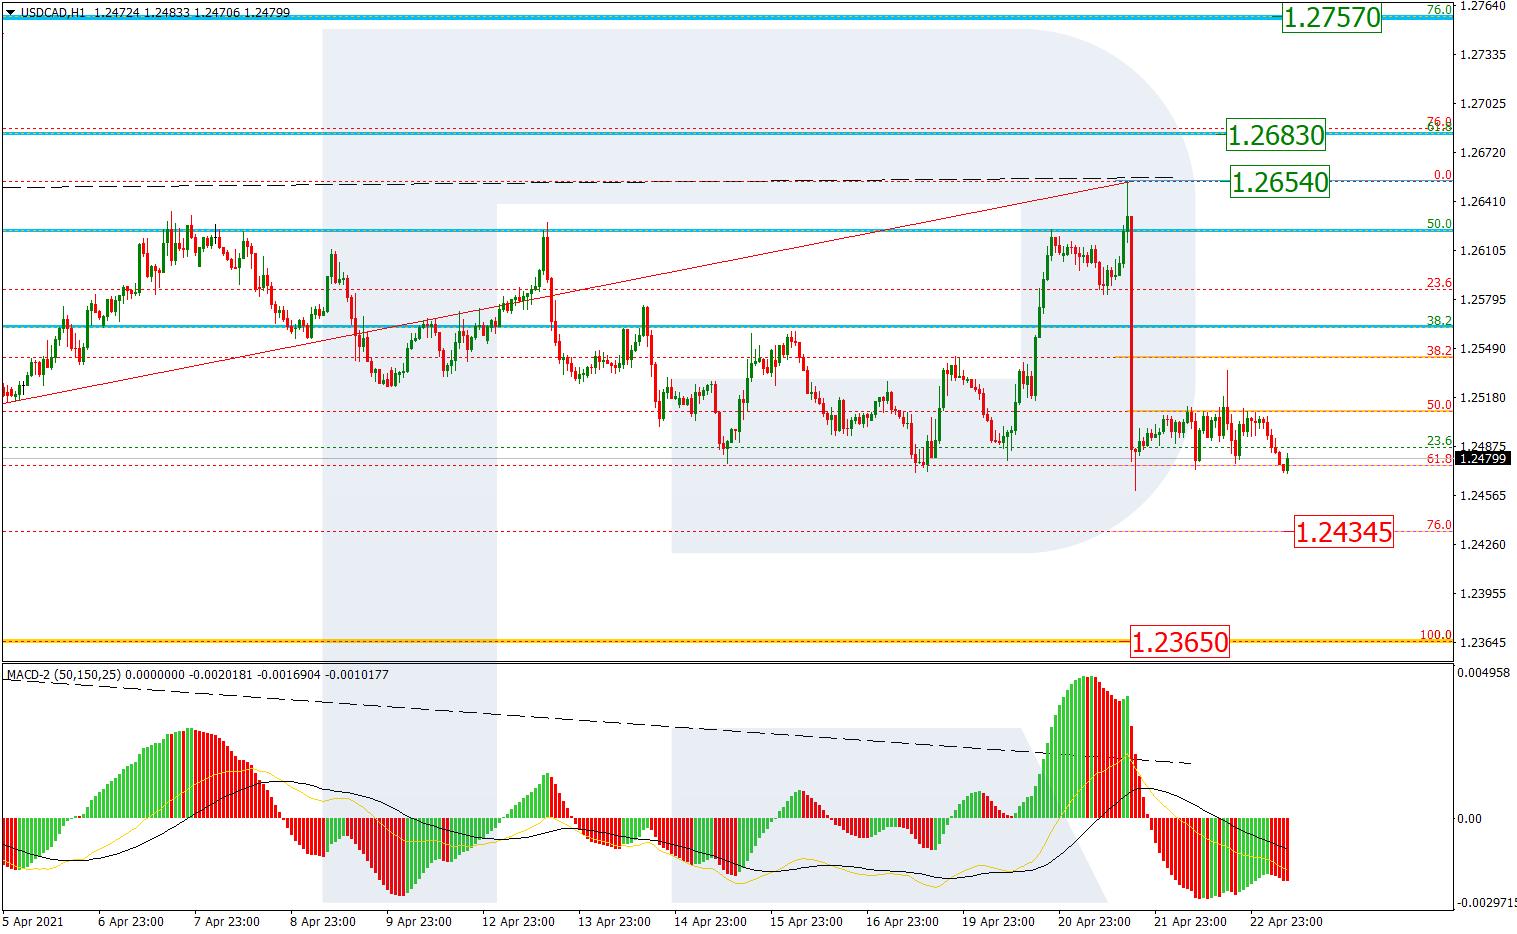
The H1 chart shows a more detailed structure of the current bearish impulse, which has already reached 61.8% fibo. Later, the asset may resume falling towards 76.0% fibo at 1.2434, a rebound from which may result in a new rising movement to reach the local high at 1.2654.
Article By RoboForex.com
Attention!
Forecasts presented in this section only reflect the author’s private opinion and should not be considered as guidance for trading. RoboForex LP bears no responsibility for trading results based on trading recommendations described in these analytical reviews.

- Gold (XAU/USD) Faces Persistent Selling Pressure Jun 10, 2026
- The US technology sector once again came under a wave of selling Jun 10, 2026
- China has shifted to using its own strategic oil reserves Jun 9, 2026
- GBP/USD Remains Under Pressure Despite Attempts to Recover Jun 9, 2026
- SpaceX IPO: Set for $75 billion liftoff Jun 8, 2026
- On Friday, the American stock market experienced one of the strongest crashes in recent times Jun 8, 2026
- EUR/USD at April Lows: What’s Next for the Pair? Jun 8, 2026
- The ceasefire between Israel and Lebanon has reduced the geopolitical premium Jun 5, 2026
- EUR/USD: All Eyes on Non-Farm Payrolls Jun 5, 2026
- The escalation of the conflict in the Middle East put pressure on US and European stock indices Jun 4, 2026