
By CountingPips.com – Receive our weekly COT Reports by Email
Here are the latest charts and statistics for the Commitment of Traders (COT) data published by the Commodities Futures Trading Commission (CFTC).
The latest COT data is updated through Tuesday March 30 2021 and shows a quick view of how large traders (for-profit speculators and commercial entities) were positioned in the futures markets.
30-Day Federal Funds:
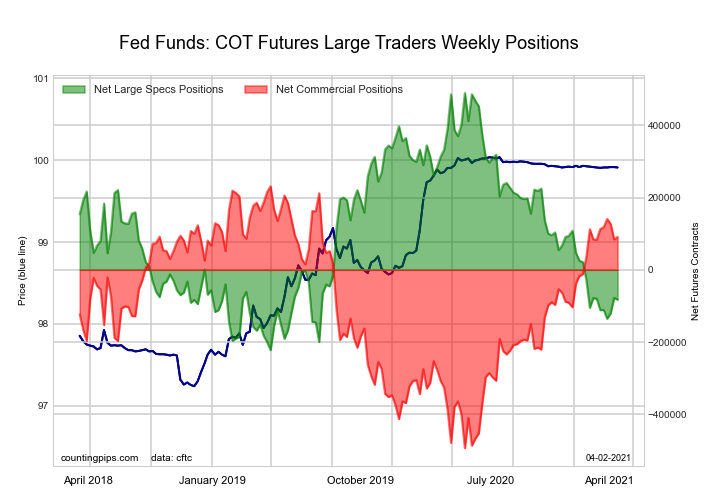
| 30-Day Federal Funds Statistics | SPECULATORS | COMMERCIALS | SMALL TRADERS |
| – Percent of Open Interest Longs: | 9.7 | 69.3 | 1.9 |
| – Percent of Open Interest Shorts: | 17.1 | 61.1 | 2.7 |
| – Net Position: | -82,631 | 91,253 | -8,622 |
| – Gross Longs: | 108,423 | 773,039 | 21,423 |
| – Gross Shorts: | 191,054 | 681,786 | 30,045 |
| – Long to Short Ratio: | 0.6 to 1 | 1.1 to 1 | 0.7 to 1 |
| NET POSITION TREND: | |||
| – COT Index Score (3 Year Range Pct): | 19.6 | 80.7 | 55.4 |
| – COT Index Reading (3 Year Range): | Bearish-Extreme | Bullish-Extreme | Bullish |
| NET POSITION MOVEMENT INDEX: | |||
| – 6-Week Change in Strength Index: | -0.3 | 1.0 | -9.5 |
2-Year Treasury Note:

Free Reports:
 Sign Up for Our Stock Market Newsletter – Get updated on News, Charts & Rankings of Public Companies when you join our Stocks Newsletter
 Get our Weekly Commitment of Traders Reports - See where the biggest traders (Hedge Funds and Commercial Hedgers) are positioned in the futures markets on a weekly basis.
| 2-Year Treasury Note Statistics | SPECULATORS | COMMERCIALS | SMALL TRADERS |
| – Percent of Open Interest Longs: | 17.5 | 75.1 | 6.2 |
| – Percent of Open Interest Shorts: | 32.4 | 61.3 | 5.1 |
| – Net Position: | -346,692 | 322,028 | 24,664 |
| – Gross Longs: | 407,888 | 1,748,022 | 143,590 |
| – Gross Shorts: | 754,580 | 1,425,994 | 118,926 |
| – Long to Short Ratio: | 0.5 to 1 | 1.2 to 1 | 1.2 to 1 |
| NET POSITION TREND: | |||
| – COT Index Score (3 Year Range Pct): | 14.7 | 79.4 | 47.9 |
| – COT Index Reading (3 Year Range): | Bearish-Extreme | Bullish | Bearish |
| NET POSITION MOVEMENT INDEX: | |||
| – 6-Week Change in Strength Index: | -42.5 | 45.4 | -16.9 |
5-Year Treasury Note:
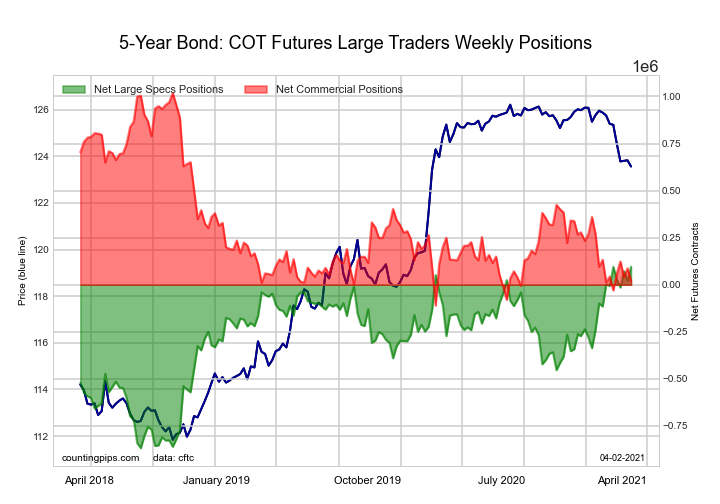
| 5-Year Treasury Note Statistics | SPECULATORS | COMMERCIALS | SMALL TRADERS |
| – Percent of Open Interest Longs: | 16.6 | 73.5 | 7.5 |
| – Percent of Open Interest Shorts: | 14.1 | 72.9 | 10.7 |
| – Net Position: | 95,335 | 20,726 | -116,061 |
| – Gross Longs: | 612,179 | 2,701,996 | 277,397 |
| – Gross Shorts: | 516,844 | 2,681,270 | 393,458 |
| – Long to Short Ratio: | 1.2 to 1 | 1.0 to 1 | 0.7 to 1 |
| NET POSITION TREND: | |||
| – COT Index Score (3 Year Range Pct): | 100.0 | 11.6 | 28.3 |
| – COT Index Reading (3 Year Range): | Bullish-Extreme | Bearish-Extreme | Bearish |
| NET POSITION MOVEMENT INDEX: | |||
| – 6-Week Change in Strength Index: | 10.5 | -2.0 | -30.5 |
10-Year Treasury Note:
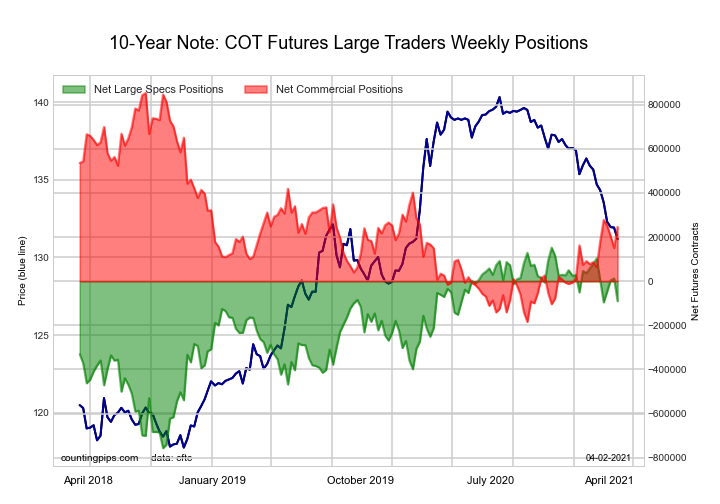
| 10-Year Treasury Note Statistics | SPECULATORS | COMMERCIALS | SMALL TRADERS |
| – Percent of Open Interest Longs: | 17.6 | 72.7 | 8.3 |
| – Percent of Open Interest Shorts: | 19.9 | 66.4 | 12.3 |
| – Net Position: | -89,802 | 246,189 | -156,387 |
| – Gross Longs: | 693,797 | 2,857,811 | 326,604 |
| – Gross Shorts: | 783,599 | 2,611,622 | 482,991 |
| – Long to Short Ratio: | 0.9 to 1 | 1.1 to 1 | 0.7 to 1 |
| NET POSITION TREND: | |||
| – COT Index Score (3 Year Range Pct): | 73.4 | 41.5 | 31.7 |
| – COT Index Reading (3 Year Range): | Bullish | Bearish | Bearish |
| NET POSITION MOVEMENT INDEX: | |||
| – 6-Week Change in Strength Index: | -21.3 | 17.6 | 3.0 |
Ultra 10-Year Notes:
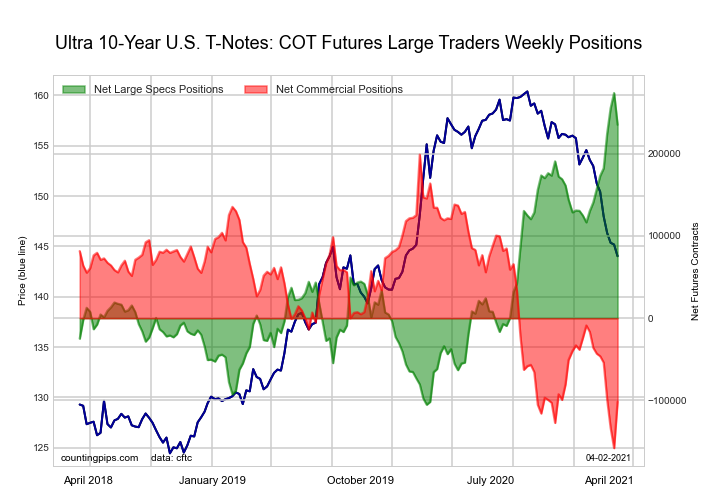
| Ultra 10-Year Notes Statistics | SPECULATORS | COMMERCIALS | SMALL TRADERS |
| – Percent of Open Interest Longs: | 23.1 | 68.9 | 7.7 |
| – Percent of Open Interest Shorts: | 5.7 | 76.4 | 17.6 |
| – Net Position: | 235,110 | -101,477 | -133,633 |
| – Gross Longs: | 312,051 | 928,708 | 103,248 |
| – Gross Shorts: | 76,941 | 1,030,185 | 236,881 |
| – Long to Short Ratio: | 4.1 to 1 | 0.9 to 1 | 0.4 to 1 |
| NET POSITION TREND: | |||
| – COT Index Score (3 Year Range Pct): | 89.8 | 15.8 | 0.0 |
| – COT Index Reading (3 Year Range): | Bullish-Extreme | Bearish-Extreme | Bearish-Extreme |
| NET POSITION MOVEMENT INDEX: | |||
| – 6-Week Change in Strength Index: | 20.6 | -16.4 | -18.0 |
US Treasury Bonds:
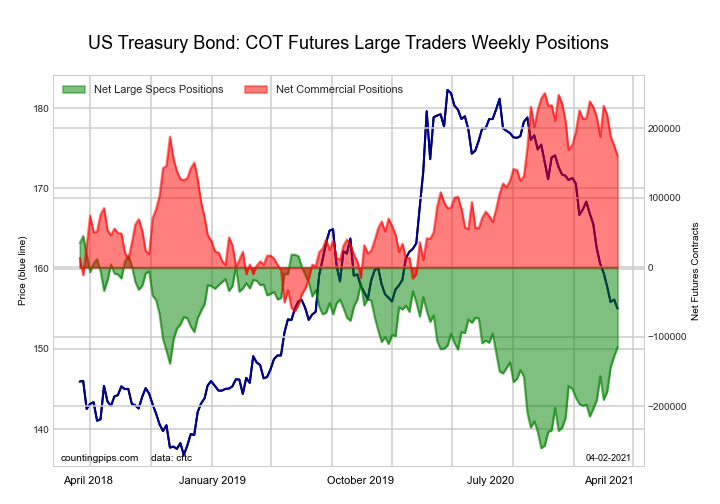
| US Treasury Bonds Statistics | SPECULATORS | COMMERCIALS | SMALL TRADERS |
| – Percent of Open Interest Longs: | 6.3 | 78.2 | 13.3 |
| – Percent of Open Interest Shorts: | 16.0 | 64.6 | 17.2 |
| – Net Position: | -114,439 | 160,173 | -45,734 |
| – Gross Longs: | 73,680 | 921,142 | 156,808 |
| – Gross Shorts: | 188,119 | 760,969 | 202,542 |
| – Long to Short Ratio: | 0.4 to 1 | 1.2 to 1 | 0.8 to 1 |
| NET POSITION TREND: | |||
| – COT Index Score (3 Year Range Pct): | 47.7 | 71.2 | 19.2 |
| – COT Index Reading (3 Year Range): | Bearish | Bullish | Bearish-Extreme |
| NET POSITION MOVEMENT INDEX: | |||
| – 6-Week Change in Strength Index: | 25.1 | -17.8 | -15.9 |
Ultra US Treasury Bonds:
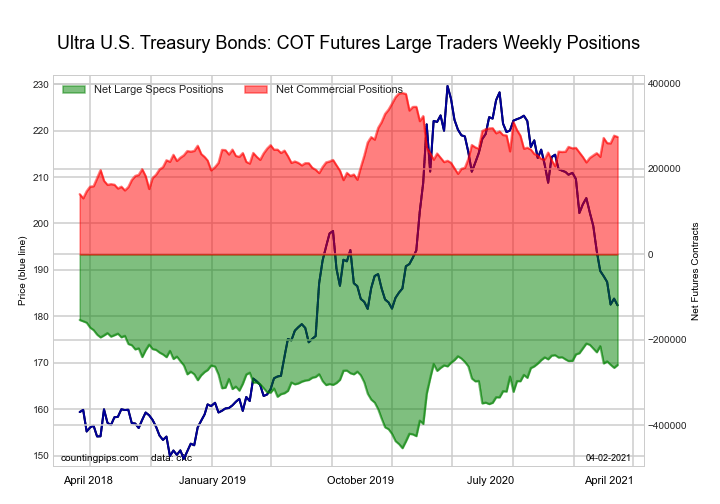
| Ultra US Treasury Bonds Statistics | SPECULATORS | COMMERCIALS | SMALL TRADERS |
| – Percent of Open Interest Longs: | 5.3 | 82.5 | 11.8 |
| – Percent of Open Interest Shorts: | 28.4 | 58.0 | 13.2 |
| – Net Position: | -259,124 | 275,130 | -16,006 |
| – Gross Longs: | 60,132 | 927,697 | 132,375 |
| – Gross Shorts: | 319,256 | 652,567 | 148,381 |
| – Long to Short Ratio: | 0.2 to 1 | 1.4 to 1 | 0.9 to 1 |
| NET POSITION TREND: | |||
| – COT Index Score (3 Year Range Pct): | 64.9 | 58.3 | 1.0 |
| – COT Index Reading (3 Year Range): | Bullish | Bullish | Bearish-Extreme |
| NET POSITION MOVEMENT INDEX: | |||
| – 6-Week Change in Strength Index: | -9.9 | 15.4 | -7.0 |
3-Month Eurodollars:
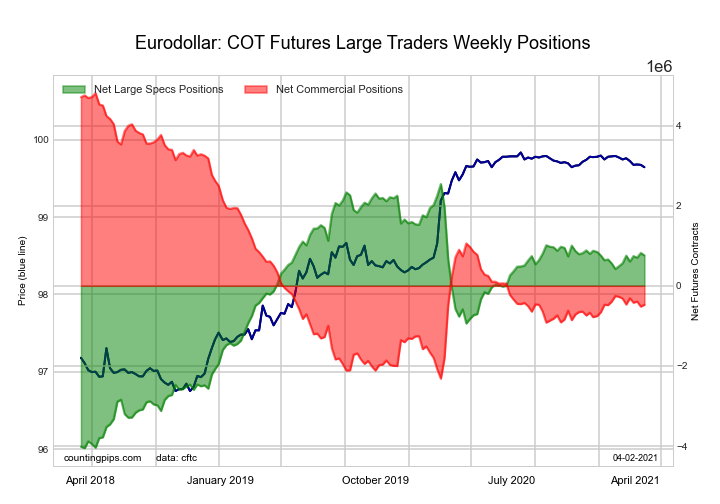
| 3-Month Eurodollars Statistics | SPECULATORS | COMMERCIALS | SMALL TRADERS |
| – Percent of Open Interest Longs: | 22.4 | 48.2 | 5.5 |
| – Percent of Open Interest Shorts: | 15.7 | 52.4 | 8.1 |
| – Net Position: | 758,106 | -472,022 | -286,084 |
| – Gross Longs: | 2,513,727 | 5,411,299 | 616,935 |
| – Gross Shorts: | 1,755,621 | 5,883,321 | 903,019 |
| – Long to Short Ratio: | 1.4 to 1 | 0.9 to 1 | 0.7 to 1 |
| NET POSITION TREND: | |||
| – COT Index Score (3 Year Range Pct): | 72.9 | 25.9 | 66.1 |
| – COT Index Reading (3 Year Range): | Bullish | Bearish | Bullish |
| NET POSITION MOVEMENT INDEX: | |||
| – 6-Week Change in Strength Index: | 3.0 | -2.2 | -5.2 |
Article By CountingPips.com – Receive our weekly COT Reports by Email
*COT Report: The COT data, released weekly to the public each Friday, is updated through the most recent Tuesday (data is 3 days old) and shows a quick view of how large speculators or non-commercials (for-profit traders) were positioned in the futures markets.
The CFTC categorizes trader positions according to commercial hedgers (traders who use futures contracts for hedging as part of the business), non-commercials (large traders who speculate to realize trading profits) and nonreportable traders (usually small traders/speculators).
Find CFTC criteria here: (http://www.cftc.gov/MarketReports/CommitmentsofTraders/ExplanatoryNotes/index.htm).

- USD/JPY Continues Its Climb: Is There a Limit? Jun 11, 2026
- Investors launched broad profit‑taking in the technology sector. The Bank of Canada kept its rate at 2.25% Jun 11, 2026
- Gold (XAU/USD) Faces Persistent Selling Pressure Jun 10, 2026
- The US technology sector once again came under a wave of selling Jun 10, 2026
- China has shifted to using its own strategic oil reserves Jun 9, 2026
- GBP/USD Remains Under Pressure Despite Attempts to Recover Jun 9, 2026
- SpaceX IPO: Set for $75 billion liftoff Jun 8, 2026
- On Friday, the American stock market experienced one of the strongest crashes in recent times Jun 8, 2026
- EUR/USD at April Lows: What’s Next for the Pair? Jun 8, 2026
- The ceasefire between Israel and Lebanon has reduced the geopolitical premium Jun 5, 2026