
Article By RoboForex.com
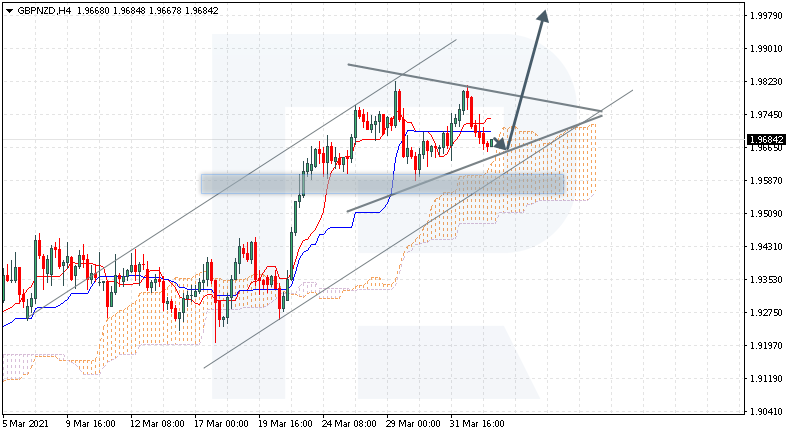
GBPNZD, “Great Britain Pound vs New Zealand Dollar”
GBPNZD is trading at 1.9684; the instrument is moving above Ichimoku Cloud, thus indicating an ascending tendency. The markets could indicate that the price may test the cloud’s upside border at 1.9665 and then resume moving upwards to reach 1.9975. Another signal in favor of a further uptrend will be a rebound from the downside border of the Triangle pattern. However, the bullish scenario may no longer be valid if the price breaks the cloud’s downside border and fixes below 1.9425. In this case, the pair may continue falling towards 1.9335. To confirm further growth, the asset must break the pattern’s upside border and fix above below 1.9830.

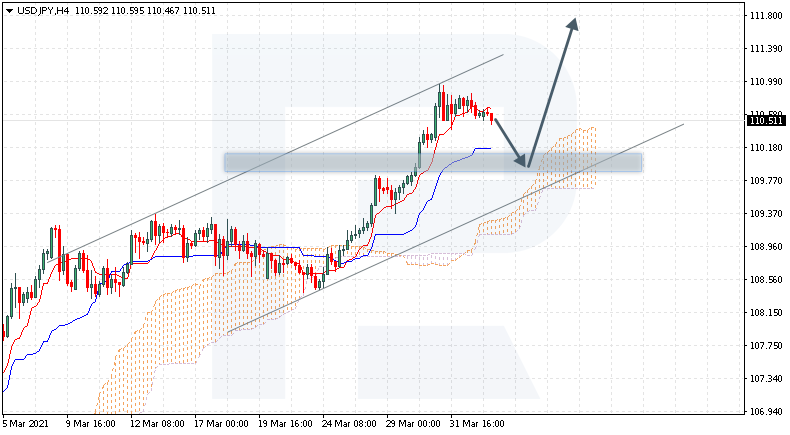
USDJPY, “US Dollar vs Japanese Yen”
USDJPY is trading at 110.51; the instrument is moving above Ichimoku Cloud, thus indicating an ascending tendency. The markets could indicate that the price may test the cloud’s upside border at 109.80 and then resume moving upwards to reach 111.80. Another signal in favor of a further uptrend will be a rebound from the support level. However, the bullish scenario may no longer be valid if the price breaks the cloud’s downside border and fixes below 108.75. In this case, the pair may continue falling towards 107.85.
Free Reports:
 Get our Weekly Commitment of Traders Reports - See where the biggest traders (Hedge Funds and Commercial Hedgers) are positioned in the futures markets on a weekly basis.
 Download Our Metatrader 4 Indicators – Put Our Free MetaTrader 4 Custom Indicators on your charts when you join our Weekly Newsletter
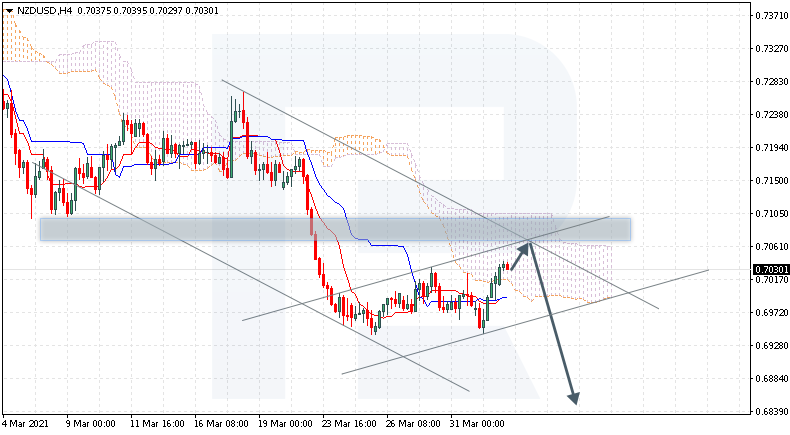
NZDUSD, “New Zealand Dollar vs US Dollar”
NZDUSD is trading at 0.7030; the instrument is moving inside Ichimoku Cloud, thus indicating a sideways tendency. The markets could indicate that the price may test the cloud’s upside border at 0.7060 and then resume moving downwards to reach 0.6845. Another signal in favor of a further downtrend will be a rebound from the descending channel’s upside border. However, the bearish scenario may be canceled if the price breaks the cloud’s upside border and fixes above 0.7135. In this case, the pair may continue growing towards 0.7225. To confirm further decline, the asset must break the rising channel’s downside border and fix below 0.6935.
Article By RoboForex.com
Attention!
Forecasts presented in this section only reflect the author’s private opinion and should not be considered as guidance for trading. RoboForex LP bears no responsibility for trading results based on trading recommendations described in these analytical reviews.

- USD/JPY Continues Its Climb: Is There a Limit? Jun 11, 2026
- Investors launched broad profit‑taking in the technology sector. The Bank of Canada kept its rate at 2.25% Jun 11, 2026
- Gold (XAU/USD) Faces Persistent Selling Pressure Jun 10, 2026
- The US technology sector once again came under a wave of selling Jun 10, 2026
- China has shifted to using its own strategic oil reserves Jun 9, 2026
- GBP/USD Remains Under Pressure Despite Attempts to Recover Jun 9, 2026
- SpaceX IPO: Set for $75 billion liftoff Jun 8, 2026
- On Friday, the American stock market experienced one of the strongest crashes in recent times Jun 8, 2026
- EUR/USD at April Lows: What’s Next for the Pair? Jun 8, 2026
- The ceasefire between Israel and Lebanon has reduced the geopolitical premium Jun 5, 2026