
Article By RoboForex.com
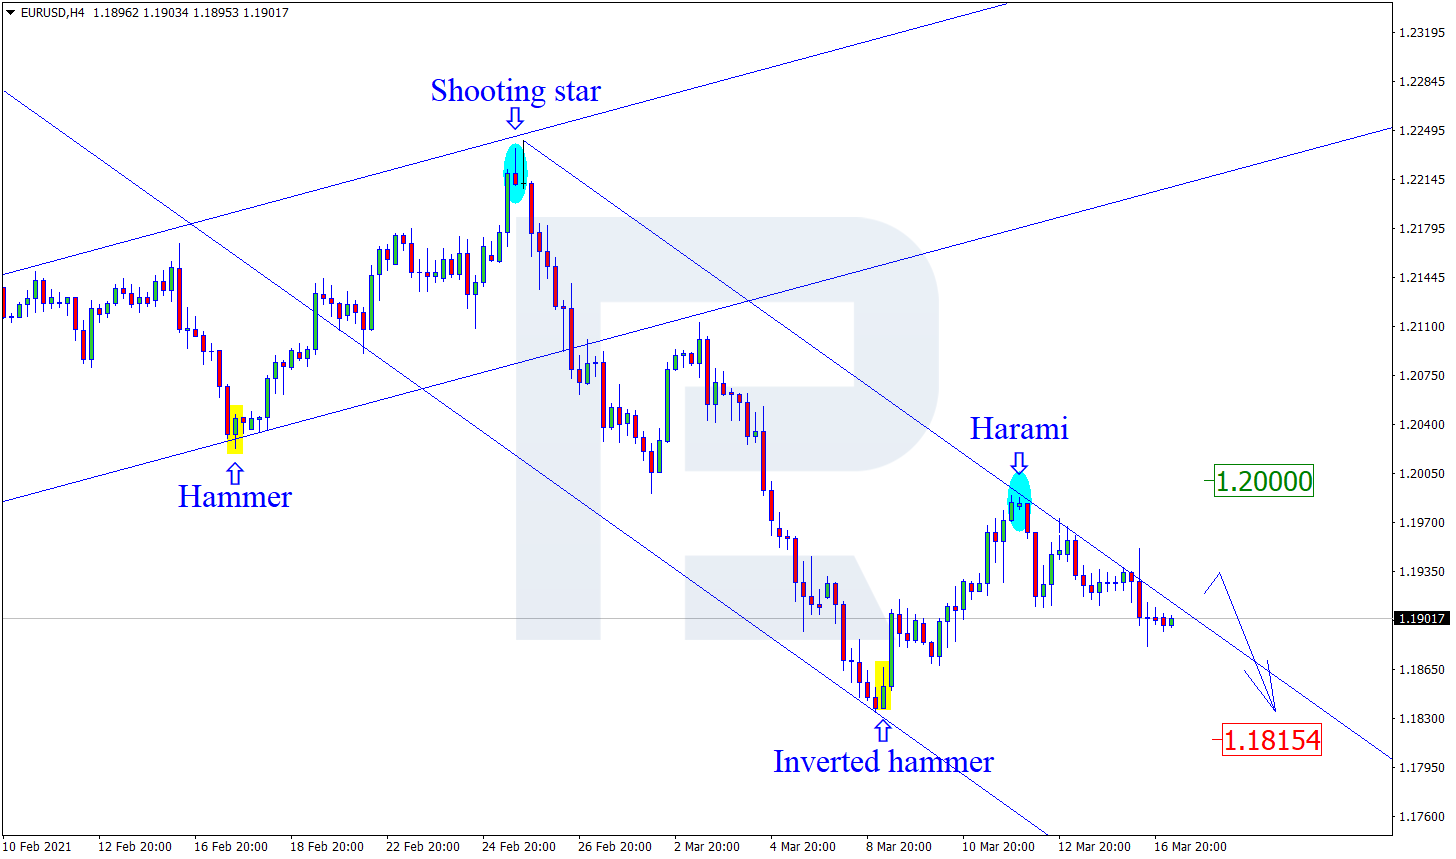
EURUSD, “Euro vs. US Dollar”
As we can see in the H4 chart, the asset continues moving not far from the descending channel’s upside border. While testing the resistance area, the pair has formed several reversal patterns, including Harami. At the moment, EURUSD may reverse and resume falling towards the support area. In this case, the downside target may be at 1.1815. However, an alternative scenario implies that the price may correct to reach 1.2000 before resuming its decline.

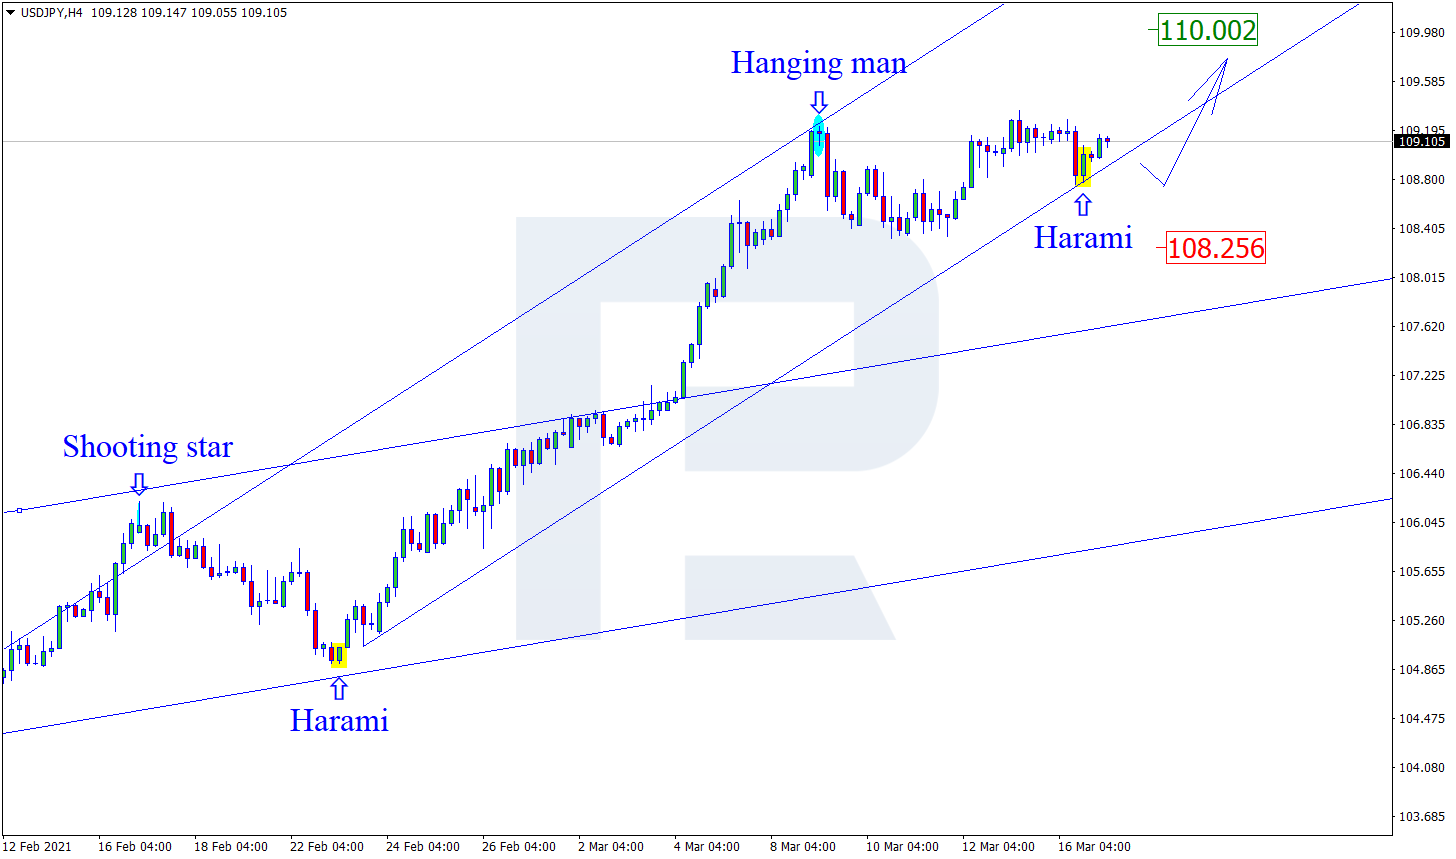
USDJPY, “US Dollar vs. Japanese Yen”
As we can see in the H4 chart, USDJPY has formed several reversal patterns, such as Harami, while testing the support level. Judging by the previous movements, one may assume that the asset may reverse and resume moving upwards. In this case, the upside target is the resistance area at 110.00. At the same time, an opposite scenario implies that the price may fall to return to 108.25 before resuming the ascending tendency.
Free Reports:
 Get our Weekly Commitment of Traders Reports - See where the biggest traders (Hedge Funds and Commercial Hedgers) are positioned in the futures markets on a weekly basis.
 Sign Up for Our Stock Market Newsletter – Get updated on News, Charts & Rankings of Public Companies when you join our Stocks Newsletter
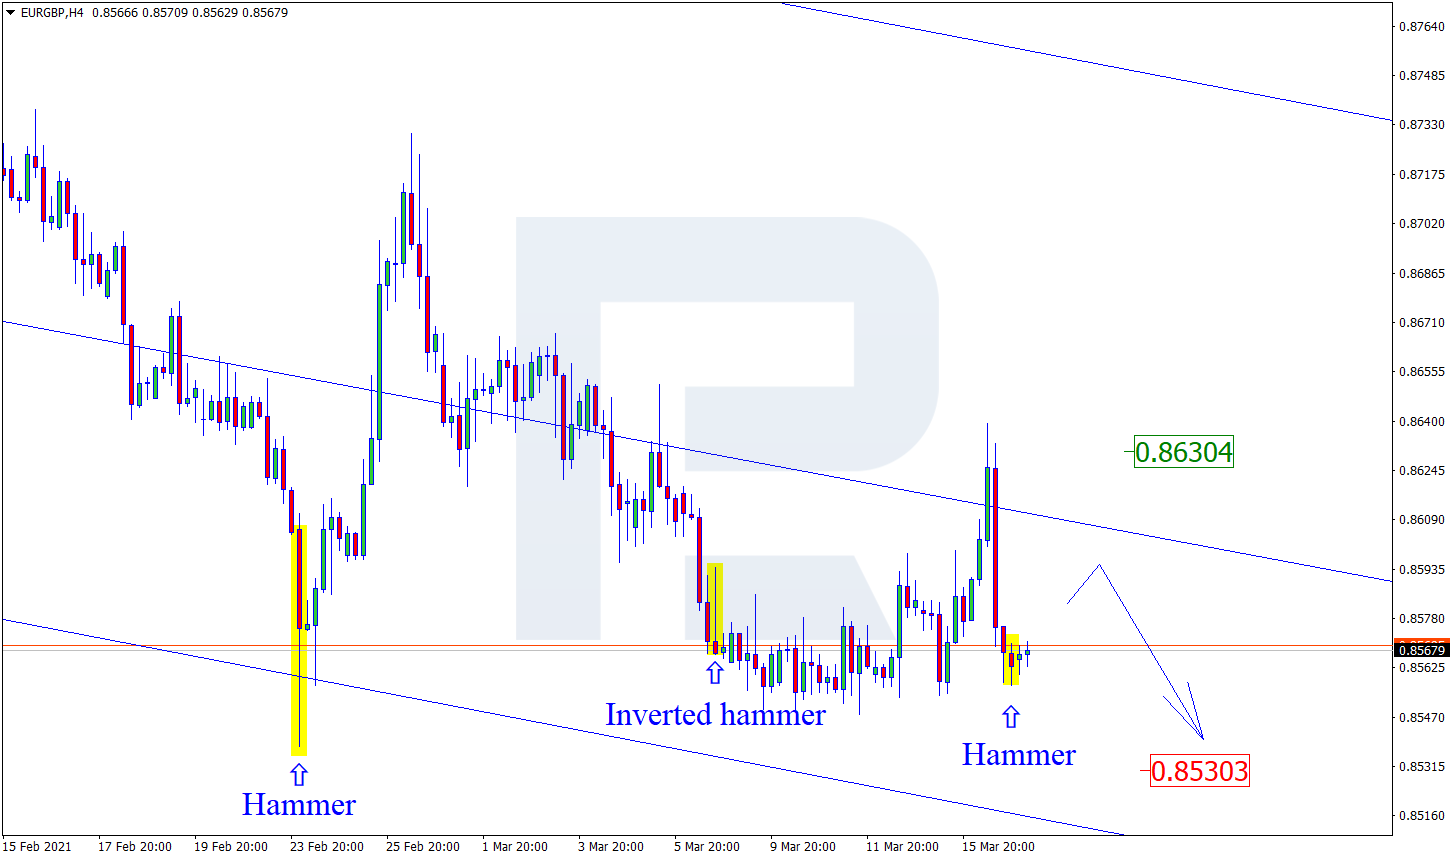
EURGBP, “Euro vs. Great Britain Pound”
As we can see in the H4 chart, the asset continues trading close to the support level. After forming several reversal patterns there, such as Harami, Hammer, and Inverted Hammer, EURGBP may reverse and form a slight pullback. In this case, the upside target may be the resistance area at 0.8630. Still, there might be an alternative scenario, according to which the asset may break the support level and continue falling without reversing and correcting. In this case, the downside target may be the next support level at 0.8530.
Article By RoboForex.com
Attention!
Forecasts presented in this section only reflect the author’s private opinion and should not be considered as guidance for trading. RoboForex LP bears no responsibility for trading results based on trading recommendations described in these analytical reviews.

- Natural gas prices are rising amid increasing electricity consumption Jul 1, 2026
- USD/JPY at 40-Year High: Multiple Factors Weigh on the Yen Jul 1, 2026
- Gold Declines: Fed Policy and Geopolitics Weigh Jun 30, 2026
- Oil prices have once again risen above 70 dollars per barrel. The Australian dollar has updated a three‑month low Jun 30, 2026
- EUR/USD: The Advantage Remains with the Dollar Jun 29, 2026
- Escalation of the US–Iran conflict is once again supporting the rise in oil prices Jun 29, 2026
- Oil prices fall back to pre‑war levels. Silver drops to a 7‑month low Jun 25, 2026
- Gold Falls to an Eight-Month Low: This May Not Be the Bottom Jun 25, 2026
- Stock indices came under heavy selling pressure amid growing skepticism about AI investments Jun 24, 2026
- The Pound Is Pressured Not by Politics, but by a Strong US Dollar Jun 24, 2026