
Article By RoboForex.com
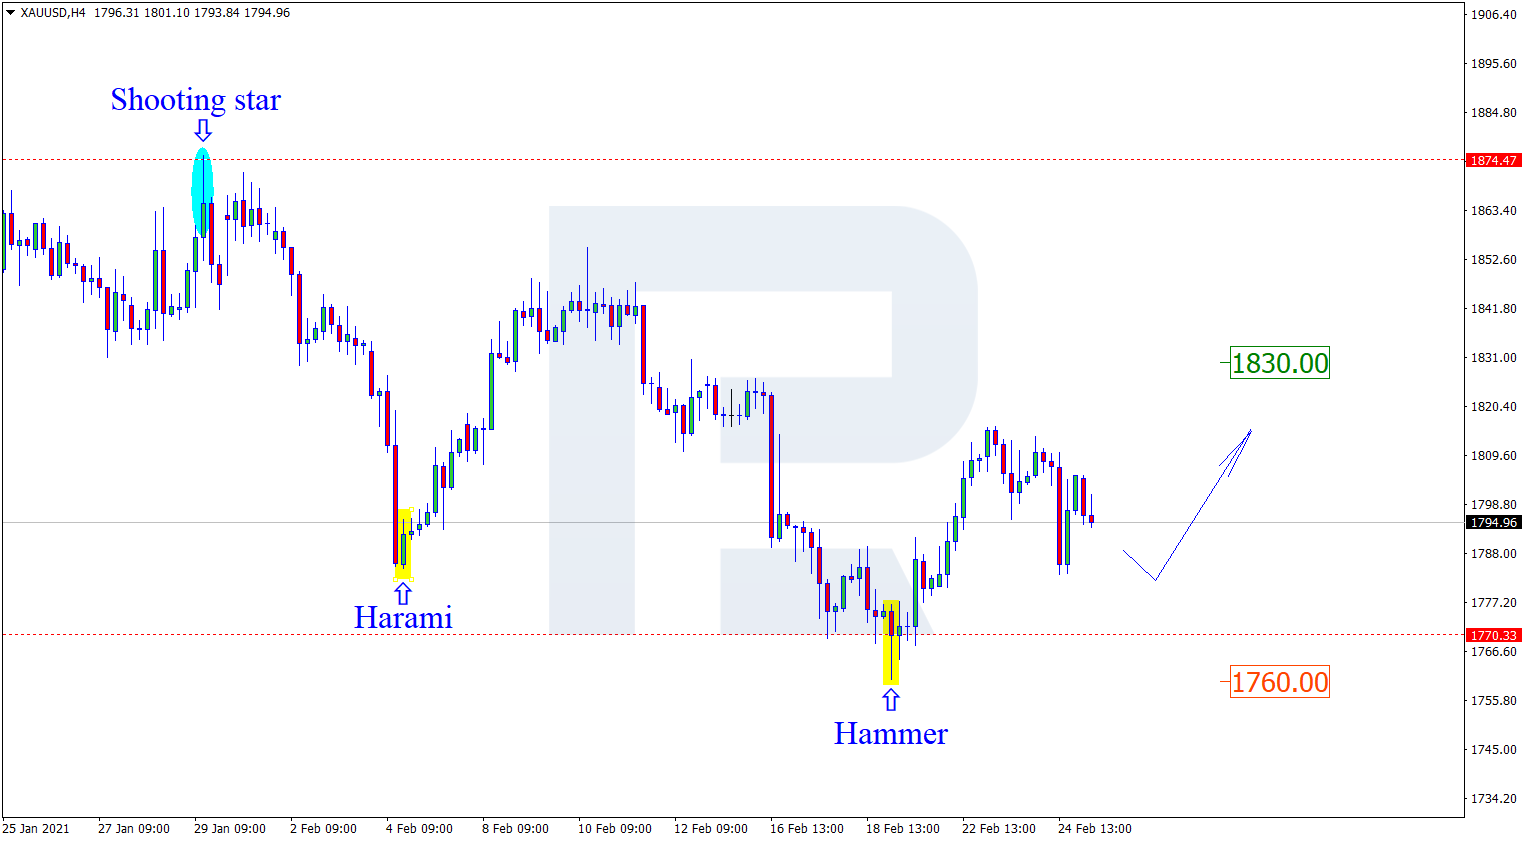
XAUUSD, “Gold vs US Dollar”
As we can see in the H4 chart, the rising impulse continues. After forming several reversal patterns, such as Hammer, close to the horizontal support level, XAUUSD is reversing and may later resume growing towards the resistance area. In this case, the upside target will be at 1830.00. At the same time, an opposite scenario implies that the price may continue its decline towards 1760.00 before further growth.

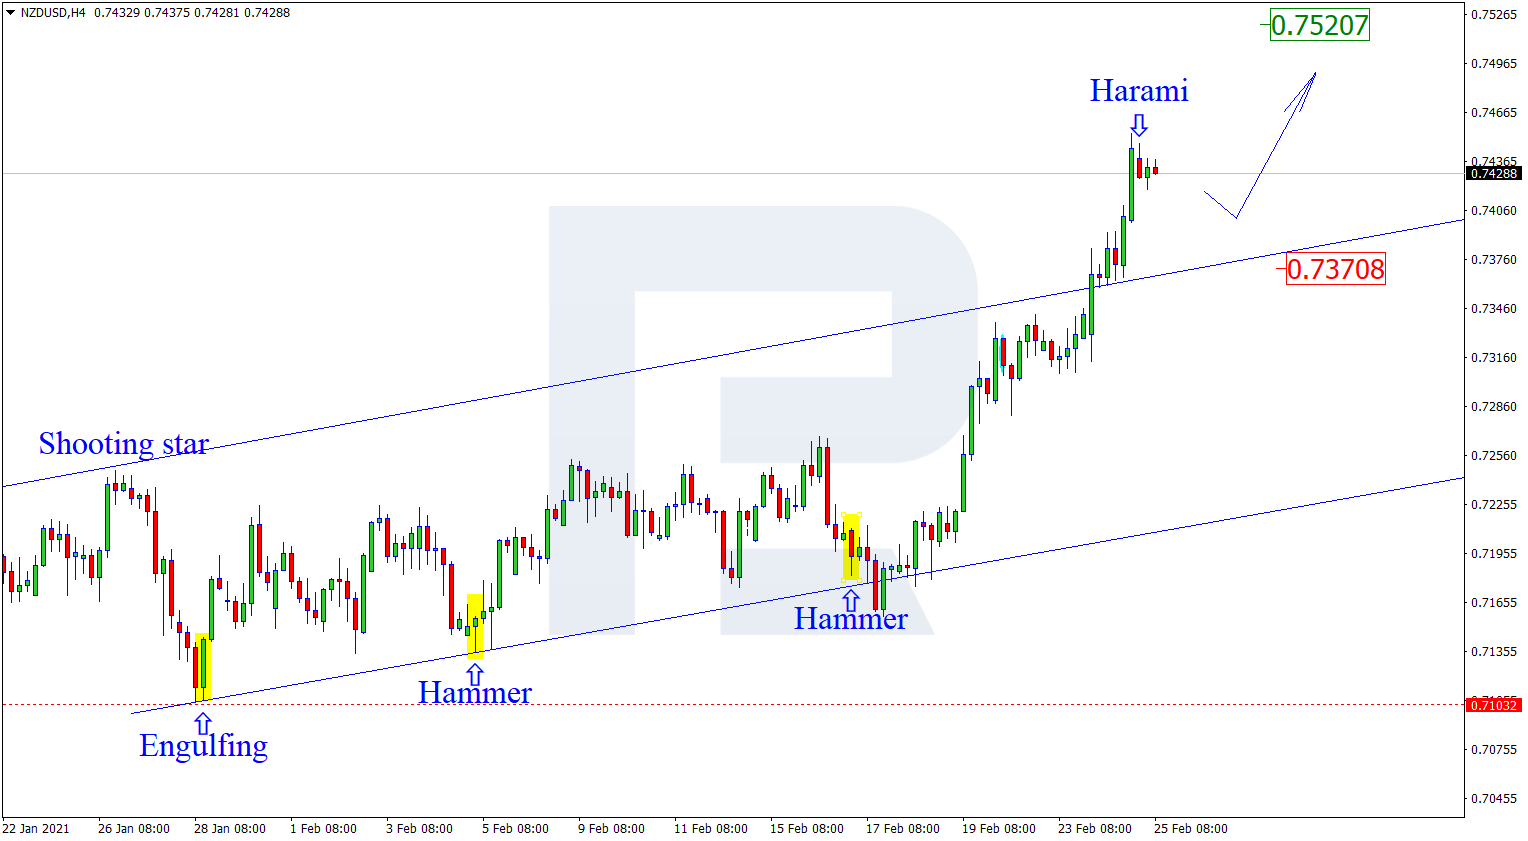
NZDUSD, “New Zealand vs. US Dollar”
As we can see in the H4 chart, the pair is correcting within the uptrend again. By now, NZDUSD has formed several reversal patterns, such as Harami, close to the resistance level. The correctional target may be the support area at 0.7370. However, an alternative scenario implies that the price may continue its growth towards 0.7520 without reversing and correcting.
Free Reports:
 Get our Weekly Commitment of Traders Reports - See where the biggest traders (Hedge Funds and Commercial Hedgers) are positioned in the futures markets on a weekly basis.
 Download Our Metatrader 4 Indicators – Put Our Free MetaTrader 4 Custom Indicators on your charts when you join our Weekly Newsletter
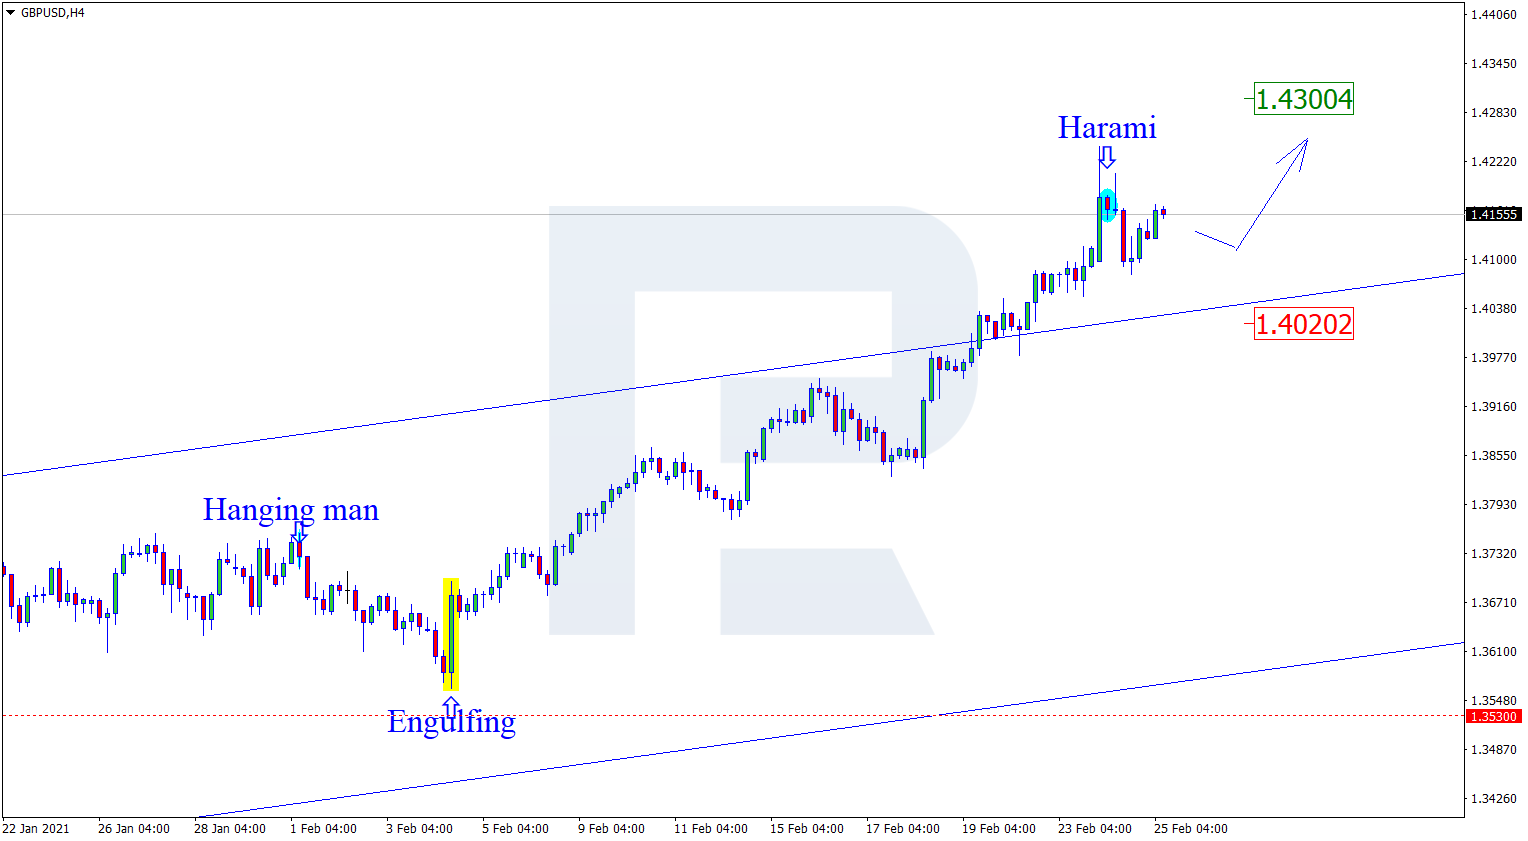
GBPUSD, “Great Britain Pound vs US Dollar”
As we can see in the H4 chart, the asset is forming another wave within the uptrend. Right now, after forming several reversal patterns, such as Harami, not far from the resistance area, GBPUSD may correct and reach the support area at 1.4020. After that, the instrument may rebound from this level and resume moving upwards to reach the upside target at 1.4300.
Article By RoboForex.com
Attention!
Forecasts presented in this section only reflect the author’s private opinion and should not be considered as guidance for trading. RoboForex LP bears no responsibility for trading results based on trading recommendations described in these analytical reviews.

- Gold Declines: Fed Policy and Geopolitics Weigh Jun 30, 2026
- Oil prices have once again risen above 70 dollars per barrel. The Australian dollar has updated a three‑month low Jun 30, 2026
- EUR/USD: The Advantage Remains with the Dollar Jun 29, 2026
- Escalation of the US–Iran conflict is once again supporting the rise in oil prices Jun 29, 2026
- Oil prices fall back to pre‑war levels. Silver drops to a 7‑month low Jun 25, 2026
- Gold Falls to an Eight-Month Low: This May Not Be the Bottom Jun 25, 2026
- Stock indices came under heavy selling pressure amid growing skepticism about AI investments Jun 24, 2026
- The Pound Is Pressured Not by Politics, but by a Strong US Dollar Jun 24, 2026
- Global crude oil prices continued to decline. The AUD/USD exchange rate hit an 11‑week low Jun 23, 2026
- EUR/USD Remains Under Sellers’ Control as the Dollar Stays Strong Jun 23, 2026