
By CountingPips.com – Receive our weekly COT Reports by Email
Here are the latest charts and statistics for the Commitment of Traders (COT) data published by the Commodities Futures Trading Commission (CFTC).
The latest COT data is updated through Tuesday February 16 2021 and shows a quick view of how large traders (for-profit speculators and commercial entities) were positioned in the futures markets. All currency positions are in direct relation to the US dollar where, for example, a bet for the euro is a bet that the euro will rise versus the dollar while a bet against the euro will be a bet that the euro will decline versus the dollar.
US DOLLAR INDEX:
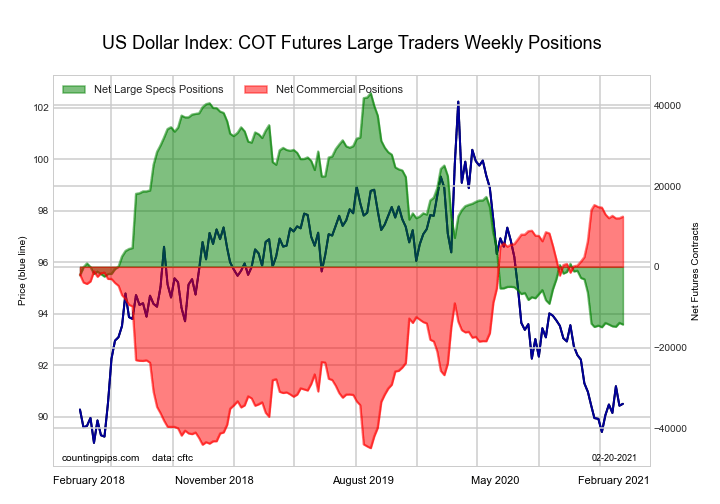
| US DOLLAR INDEX Statistics | SPECULATORS | COMMERCIALS | SMALL TRADERS |
| – Percent of Open Interest Longs: | 44.0 | 35.6 | 14.7 |
| – Percent of Open Interest Shorts: | 83.8 | 1.0 | 9.5 |
| – Net Position: | -14,287 | 12,433 | 1,854 |
| – Gross Longs: | 15,842 | 12,808 | 5,276 |
| – Gross Shorts: | 30,129 | 375 | 3,422 |
| – Long to Short Ratio: | 0.5 to 1 | 34.2 to 1 | 1.5 to 1 |
| NET POSITION TREND: | |||
| – COT Index Score (3 Year Range Pct): | 1.1 | 95.2 | 43.4 |
| – COT Index Reading (3 Year Range): | Bearish-Extreme | Bullish-Extreme | Bearish |
| NET POSITION MOVEMENT INDEX: | |||
| – 6-Week Change in Strength Index: | 1.1 | -3.7 | 20.3 |
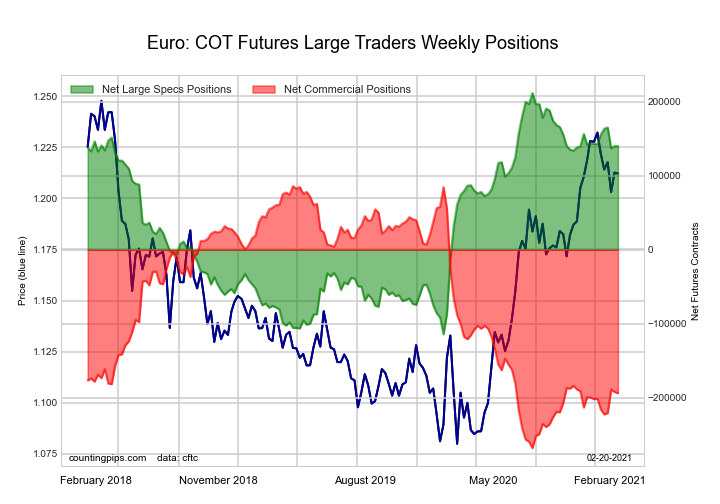
EURO Currency:
Free Reports:
 Get our Weekly Commitment of Traders Reports - See where the biggest traders (Hedge Funds and Commercial Hedgers) are positioned in the futures markets on a weekly basis.
 Sign Up for Our Stock Market Newsletter – Get updated on News, Charts & Rankings of Public Companies when you join our Stocks Newsletter
| EURO Currency Statistics | SPECULATORS | COMMERCIALS | SMALL TRADERS |
| – Percent of Open Interest Longs: | 33.0 | 52.2 | 13.7 |
| – Percent of Open Interest Shorts: | 12.3 | 80.9 | 5.8 |
| – Net Position: | 140,006 | -193,756 | 53,750 |
| – Gross Longs: | 222,895 | 352,756 | 92,886 |
| – Gross Shorts: | 82,889 | 546,512 | 39,136 |
| – Long to Short Ratio: | 2.7 to 1 | 0.6 to 1 | 2.4 to 1 |
| NET POSITION TREND: | |||
| – COT Index Score (3 Year Range Pct): | 78.0 | 21.0 | 84.8 |
| – COT Index Reading (3 Year Range): | Bullish | Bearish | Bullish-Extreme |
| NET POSITION MOVEMENT INDEX: | |||
| – 6-Week Change in Strength Index: | -0.9 | 2.1 | -7.9 |
BRITISH POUND STERLING:

| BRITISH POUND Statistics | SPECULATORS | COMMERCIALS | SMALL TRADERS |
| – Percent of Open Interest Longs: | 35.2 | 39.5 | 24.2 |
| – Percent of Open Interest Shorts: | 22.3 | 61.6 | 15.0 |
| – Net Position: | 22,167 | -37,858 | 15,691 |
| – Gross Longs: | 60,269 | 67,674 | 41,458 |
| – Gross Shorts: | 38,102 | 105,532 | 25,767 |
| – Long to Short Ratio: | 1.6 to 1 | 0.6 to 1 | 1.6 to 1 |
| NET POSITION TREND: | |||
| – COT Index Score (3 Year Range Pct): | 83.0 | 14.1 | 99.7 |
| – COT Index Reading (3 Year Range): | Bullish-Extreme | Bearish-Extreme | Bullish-Extreme |
| NET POSITION MOVEMENT INDEX: | |||
| – 6-Week Change in Strength Index: | 12.3 | -13.9 | 16.0 |
JAPANESE YEN:

| JAPANESE YEN Statistics | SPECULATORS | COMMERCIALS | SMALL TRADERS |
| – Percent of Open Interest Longs: | 35.5 | 49.3 | 13.8 |
| – Percent of Open Interest Shorts: | 15.7 | 68.2 | 14.7 |
| – Net Position: | 37,182 | -35,486 | -1,696 |
| – Gross Longs: | 66,732 | 92,764 | 26,010 |
| – Gross Shorts: | 29,550 | 128,250 | 27,706 |
| – Long to Short Ratio: | 2.3 to 1 | 0.7 to 1 | 0.9 to 1 |
| NET POSITION TREND: | |||
| – COT Index Score (3 Year Range Pct): | 92.0 | 17.8 | 53.0 |
| – COT Index Reading (3 Year Range): | Bullish-Extreme | Bearish-Extreme | Bullish |
| NET POSITION MOVEMENT INDEX: | |||
| – 6-Week Change in Strength Index: | -7.8 | 17.8 | -47.0 |
SWISS FRANC:

| SWISS FRANC Statistics | SPECULATORS | COMMERCIALS | SMALL TRADERS |
| – Percent of Open Interest Longs: | 32.7 | 28.6 | 37.6 |
| – Percent of Open Interest Shorts: | 15.3 | 57.9 | 25.7 |
| – Net Position: | 8,371 | -14,091 | 5,720 |
| – Gross Longs: | 15,745 | 13,748 | 18,061 |
| – Gross Shorts: | 7,374 | 27,839 | 12,341 |
| – Long to Short Ratio: | 2.1 to 1 | 0.5 to 1 | 1.5 to 1 |
| NET POSITION TREND: | |||
| – COT Index Score (3 Year Range Pct): | 86.3 | 14.0 | 81.4 |
| – COT Index Reading (3 Year Range): | Bullish-Extreme | Bearish-Extreme | Bullish-Extreme |
| NET POSITION MOVEMENT INDEX: | |||
| – 6-Week Change in Strength Index: | -1.6 | 6.4 | -13.8 |
CANADIAN DOLLAR:
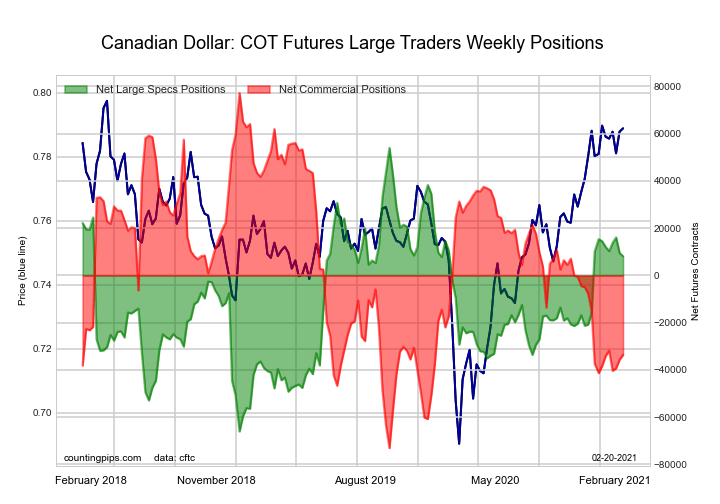
| CANADIAN DOLLAR Statistics | SPECULATORS | COMMERCIALS | SMALL TRADERS |
| – Percent of Open Interest Longs: | 28.3 | 43.0 | 27.8 |
| – Percent of Open Interest Shorts: | 23.1 | 64.1 | 11.8 |
| – Net Position: | 8,164 | -33,588 | 25,424 |
| – Gross Longs: | 45,021 | 68,547 | 44,228 |
| – Gross Shorts: | 36,857 | 102,135 | 18,804 |
| – Long to Short Ratio: | 1.2 to 1 | 0.7 to 1 | 2.4 to 1 |
| NET POSITION TREND: | |||
| – COT Index Score (3 Year Range Pct): | 61.8 | 26.3 | 85.1 |
| – COT Index Reading (3 Year Range): | Bullish | Bearish | Bullish-Extreme |
| NET POSITION MOVEMENT INDEX: | |||
| – 6-Week Change in Strength Index: | -5.3 | 3.1 | 2.5 |
AUSTRALIAN DOLLAR:
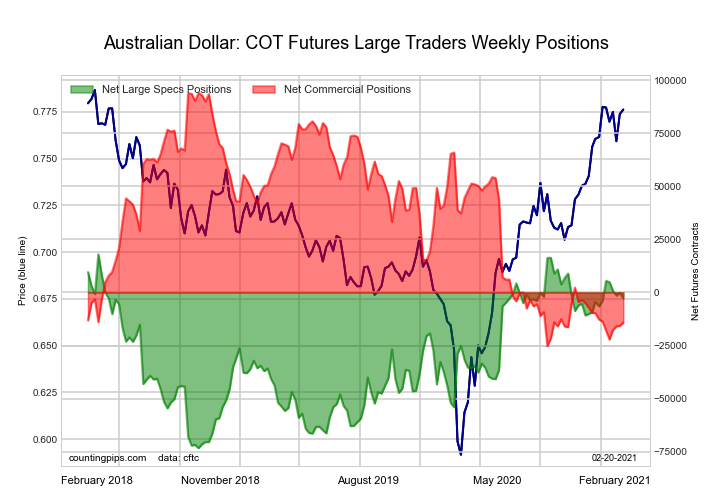
| AUSTRALIAN DOLLAR Statistics | SPECULATORS | COMMERCIALS | SMALL TRADERS |
| – Percent of Open Interest Longs: | 38.8 | 34.4 | 25.5 |
| – Percent of Open Interest Shorts: | 40.8 | 44.4 | 13.5 |
| – Net Position: | -2,821 | -14,170 | 16,991 |
| – Gross Longs: | 54,675 | 48,431 | 35,963 |
| – Gross Shorts: | 57,496 | 62,601 | 18,972 |
| – Long to Short Ratio: | 1.0 to 1 | 0.8 to 1 | 1.9 to 1 |
| NET POSITION TREND: | |||
| – COT Index Score (3 Year Range Pct): | 77.3 | 9.3 | 95.1 |
| – COT Index Reading (3 Year Range): | Bullish | Bearish-Extreme | Bullish-Extreme |
| NET POSITION MOVEMENT INDEX: | |||
| – 6-Week Change in Strength Index: | 1.2 | -0.4 | -1.4 |
NEW ZEALAND DOLLAR:
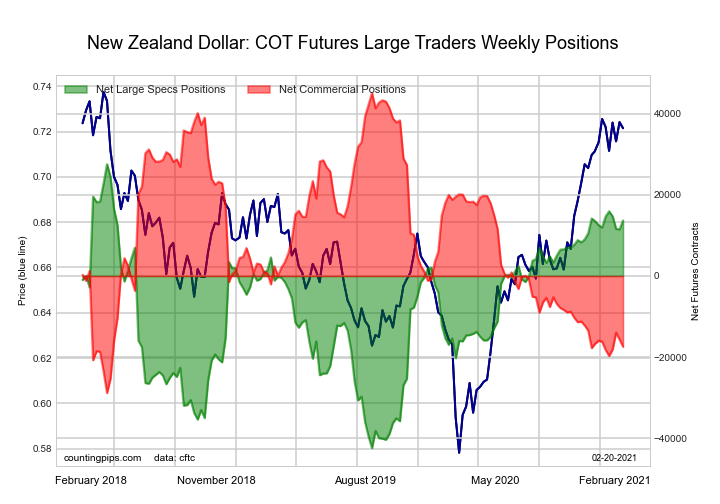
| NEW ZEALAND DOLLAR Statistics | SPECULATORS | COMMERCIALS | SMALL TRADERS |
| – Percent of Open Interest Longs: | 62.9 | 22.2 | 13.1 |
| – Percent of Open Interest Shorts: | 34.4 | 58.5 | 5.3 |
| – Net Position: | 13,711 | -17,451 | 3,740 |
| – Gross Longs: | 30,243 | 10,690 | 6,293 |
| – Gross Shorts: | 16,532 | 28,141 | 2,553 |
| – Long to Short Ratio: | 1.8 to 1 | 0.4 to 1 | 2.5 to 1 |
| NET POSITION TREND: | |||
| – COT Index Score (3 Year Range Pct): | 80.2 | 15.4 | 94.8 |
| – COT Index Reading (3 Year Range): | Bullish-Extreme | Bearish-Extreme | Bullish-Extreme |
| NET POSITION MOVEMENT INDEX: | |||
| – 6-Week Change in Strength Index: | 2.4 | -1.7 | -5.2 |
MEXICAN PESO:
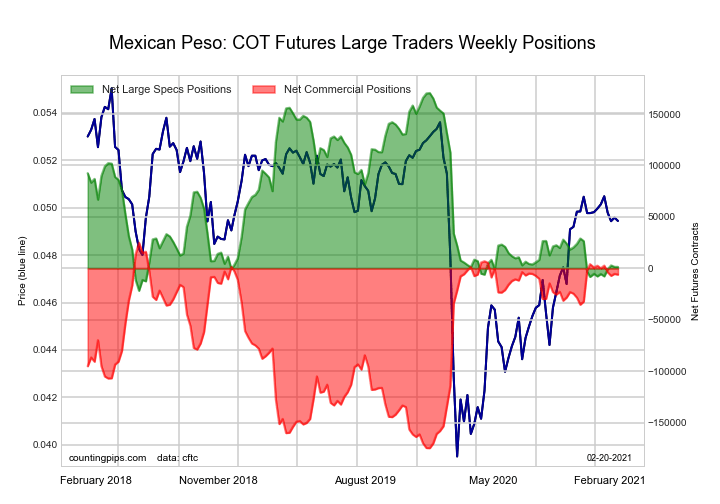
| MEXICAN PESO Statistics | SPECULATORS | COMMERCIALS | SMALL TRADERS |
| – Percent of Open Interest Longs: | 35.3 | 58.3 | 4.8 |
| – Percent of Open Interest Shorts: | 34.4 | 62.0 | 2.0 |
| – Net Position: | 1,412 | -6,033 | 4,621 |
| – Gross Longs: | 57,670 | 95,153 | 7,920 |
| – Gross Shorts: | 56,258 | 101,186 | 3,299 |
| – Long to Short Ratio: | 1.0 to 1 | 0.9 to 1 | 2.4 to 1 |
| NET POSITION TREND: | |||
| – COT Index Score (3 Year Range Pct): | 12.0 | 84.4 | 62.6 |
| – COT Index Reading (3 Year Range): | Bearish-Extreme | Bullish-Extreme | Bullish |
| NET POSITION MOVEMENT INDEX: | |||
| – 6-Week Change in Strength Index: | 4.8 | -4.3 | -2.1 |
BRAZIL REAL:
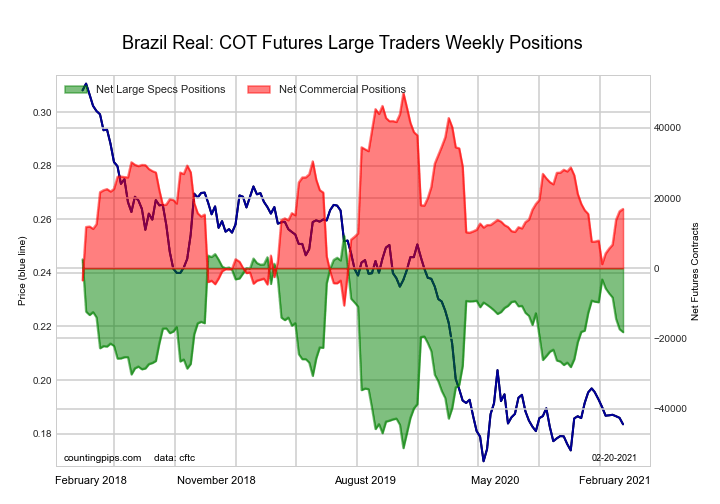
| BRAZIL REAL Statistics | SPECULATORS | COMMERCIALS | SMALL TRADERS |
| – Percent of Open Interest Longs: | 26.9 | 63.2 | 9.8 |
| – Percent of Open Interest Shorts: | 78.5 | 15.3 | 6.2 |
| – Net Position: | -18,206 | 16,908 | 1,298 |
| – Gross Longs: | 9,506 | 22,305 | 3,473 |
| – Gross Shorts: | 27,712 | 5,397 | 2,175 |
| – Long to Short Ratio: | 0.3 to 1 | 4.1 to 1 | 1.6 to 1 |
| NET POSITION TREND: | |||
| – COT Index Score (3 Year Range Pct): | 54.6 | 45.4 | 87.9 |
| – COT Index Reading (3 Year Range): | Bullish | Bearish | Bullish-Extreme |
| NET POSITION MOVEMENT INDEX: | |||
| – 6-Week Change in Strength Index: | -24.8 | 26.0 | -9.1 |
RUSSIAN RUBLE:
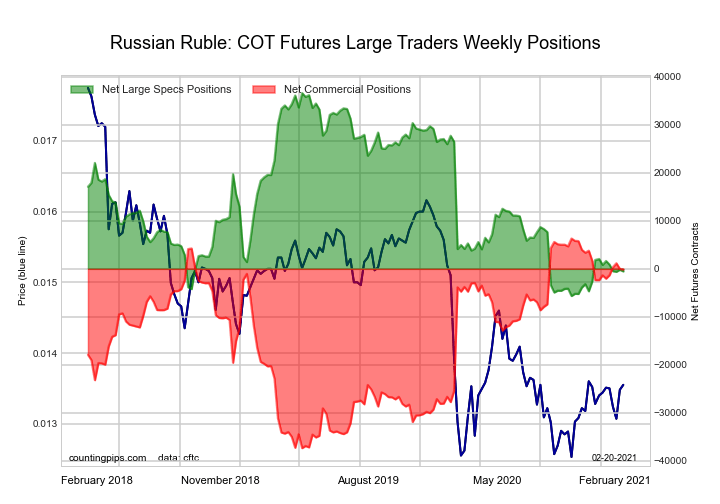
| RUSSIAN RUBLE Statistics | SPECULATORS | COMMERCIALS | SMALL TRADERS |
| – Percent of Open Interest Longs: | 32.0 | 61.2 | 6.8 |
| – Percent of Open Interest Shorts: | 33.7 | 61.7 | 4.6 |
| – Net Position: | -531 | -129 | 660 |
| – Gross Longs: | 9,732 | 18,644 | 2,072 |
| – Gross Shorts: | 10,263 | 18,773 | 1,412 |
| – Long to Short Ratio: | 0.9 to 1 | 1.0 to 1 | 1.5 to 1 |
| NET POSITION TREND: | |||
| – COT Index Score (3 Year Range Pct): | 12.1 | 85.2 | 64.7 |
| – COT Index Reading (3 Year Range): | Bearish-Extreme | Bullish-Extreme | Bullish |
| NET POSITION MOVEMENT INDEX: | |||
| – 6-Week Change in Strength Index: | -3.2 | 2.8 | 4.5 |
BITCOIN FUTURES:
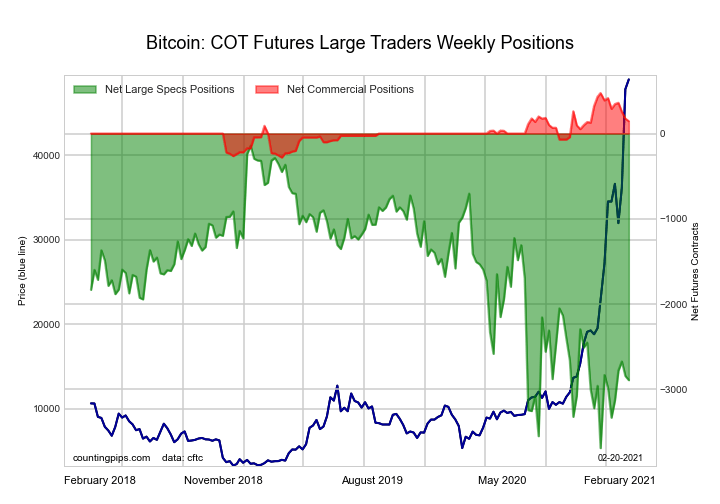
| BITCOIN Statistics | SPECULATORS | COMMERCIALS | SMALL TRADERS |
| – Percent of Open Interest Longs: | 58.4 | 3.2 | 30.7 |
| – Percent of Open Interest Shorts: | 83.7 | 1.9 | 6.7 |
| – Net Position: | -2,893 | 145 | 2,748 |
| – Gross Longs: | 6,672 | 365 | 3,508 |
| – Gross Shorts: | 9,565 | 220 | 760 |
| – Long to Short Ratio: | 0.7 to 1 | 1.7 to 1 | 4.6 to 1 |
| NET POSITION TREND: | |||
| – COT Index Score (3 Year Range Pct): | 22.5 | 56.3 | 80.2 |
| – COT Index Reading (3 Year Range): | Bearish | Bullish | Bullish-Extreme |
| NET POSITION MOVEMENT INDEX: | |||
| – 6-Week Change in Strength Index: | 2.6 | -35.8 | 5.9 |
Article By CountingPips.com – Receive our weekly COT Reports by Email
*COT Report: The COT data, released weekly to the public each Friday, is updated through the most recent Tuesday (data is 3 days old) and shows a quick view of how large speculators or non-commercials (for-profit traders) were positioned in the futures markets.
The CFTC categorizes trader positions according to commercial hedgers (traders who use futures contracts for hedging as part of the business), non-commercials (large traders who speculate to realize trading profits) and nonreportable traders (usually small traders/speculators).
Find CFTC criteria here: (http://www.cftc.gov/MarketReports/CommitmentsofTraders/ExplanatoryNotes/index.htm).

- Oil prices fall back to pre‑war levels. Silver drops to a 7‑month low Jun 25, 2026
- Gold Falls to an Eight-Month Low: This May Not Be the Bottom Jun 25, 2026
- Stock indices came under heavy selling pressure amid growing skepticism about AI investments Jun 24, 2026
- The Pound Is Pressured Not by Politics, but by a Strong US Dollar Jun 24, 2026
- Global crude oil prices continued to decline. The AUD/USD exchange rate hit an 11‑week low Jun 23, 2026
- EUR/USD Remains Under Sellers’ Control as the Dollar Stays Strong Jun 23, 2026
- Gold Falls for the Third Consecutive Week: Is There Still Upside Potential? Jun 22, 2026
- Bank Indonesia raised its interest rate. Norges Bank and the SNB left rates unchanged Jun 19, 2026
- EUR/USD Loses Ground as Market Sentiment Favours the US Dollar Jun 19, 2026
- GBPUSD Awaits Bank of England Meeting Near April Lows Jun 18, 2026