
Article By RoboForex.com
BTCUSD, “Bitcoin vs US Dollar”
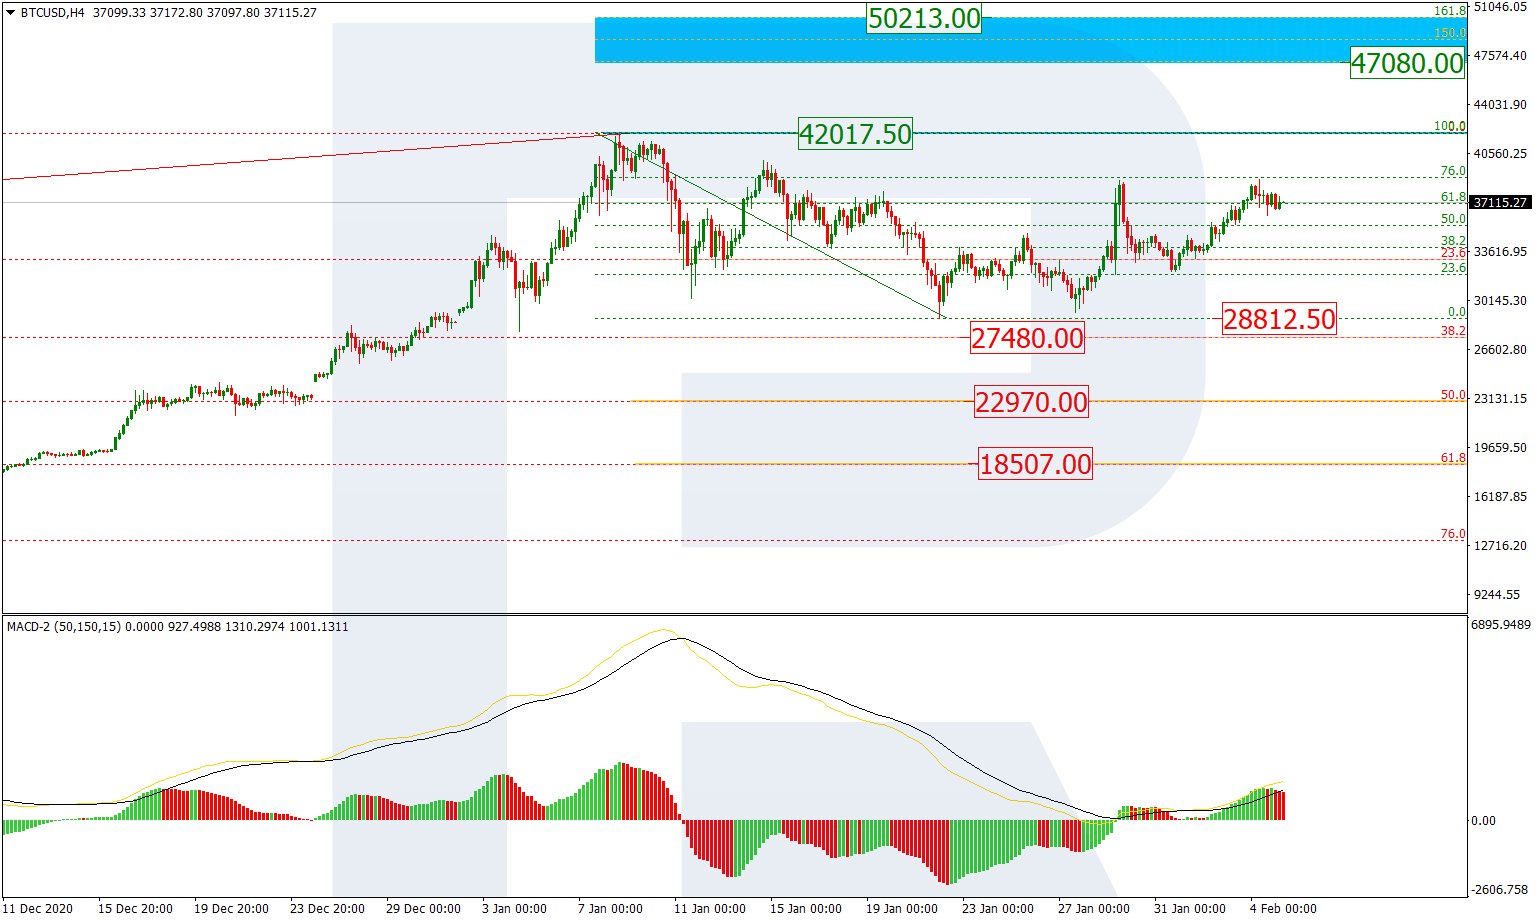
As we can see in the H4 chart, the asset is about to complete its correctional downtrend and start a new rising wave towards the high. A breakout of the current high at 42017.50 will result in a further uptrend towards the post-correctional extension area between 138.2% and 161.8% fibo at 47080.00 and 50213.00 respectively. However, an alternative scenario suggests that BTCUSD may break the local low at 28812.50 and continue falling to reach 38.2%, 50.0%, and 61.8% fibo at 27480.00, 22970.00, and 18507.00 respectively again

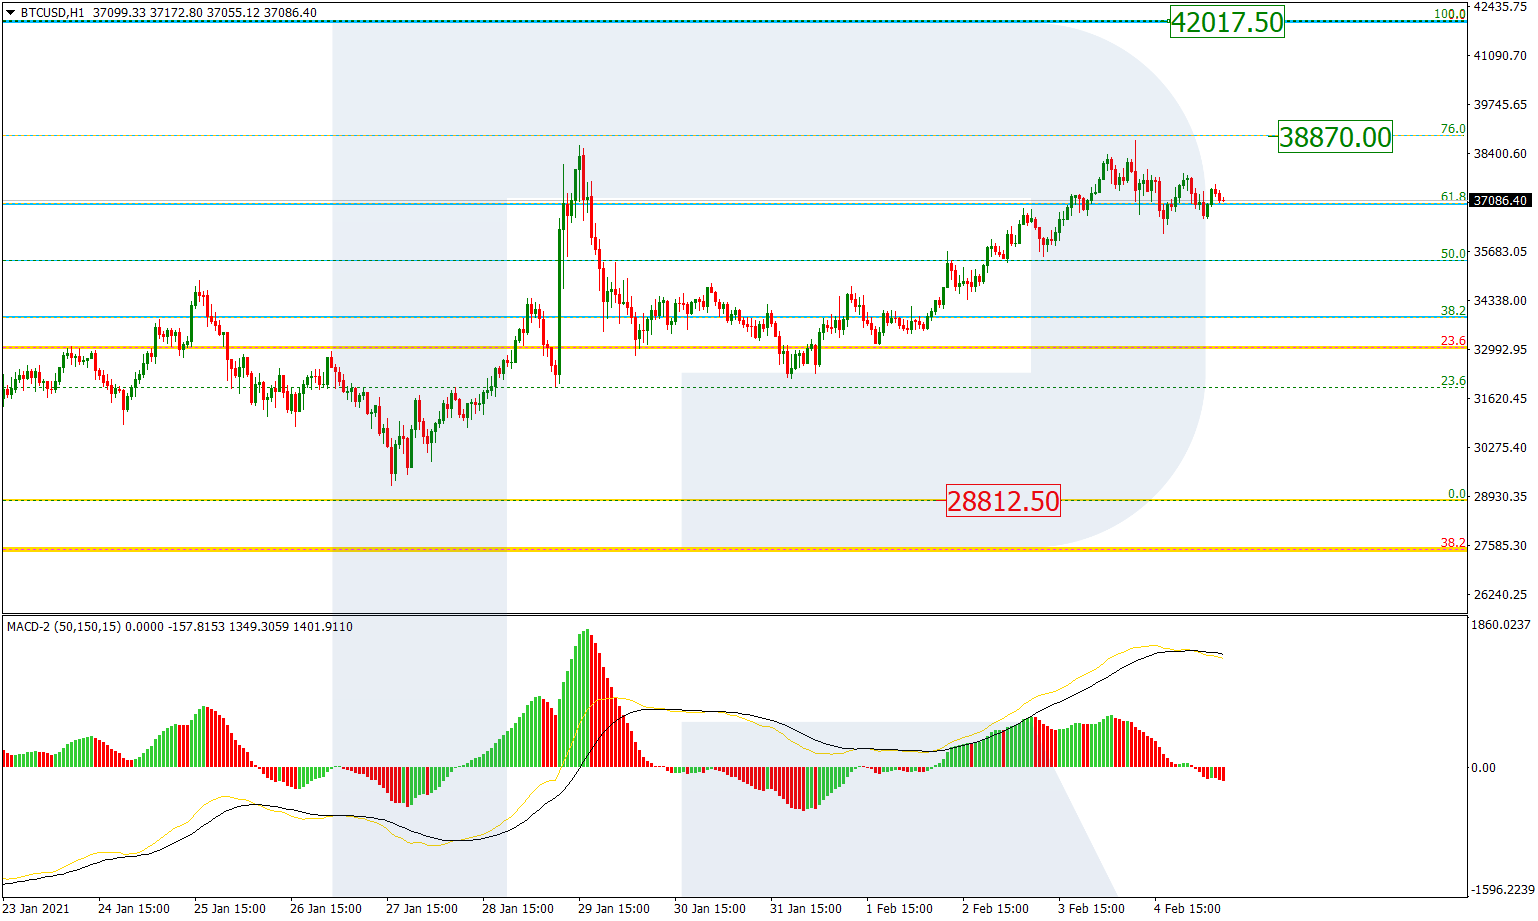
The H1 chart shows a new rising wave, which is approaching 76.0% fibo at 38870.00. It’s been the second time the asset is trying to reach this level and may result in a further uptrend towards the high at 42017.50. In the short-term, the pair may correct – a divergence on MACD is a good signal in favor of this scenario.
Free Reports:
 Get our Weekly Commitment of Traders Reports - See where the biggest traders (Hedge Funds and Commercial Hedgers) are positioned in the futures markets on a weekly basis.
 Sign Up for Our Stock Market Newsletter – Get updated on News, Charts & Rankings of Public Companies when you join our Stocks Newsletter
ETHUSD, “Ethereum vs. US Dollar”
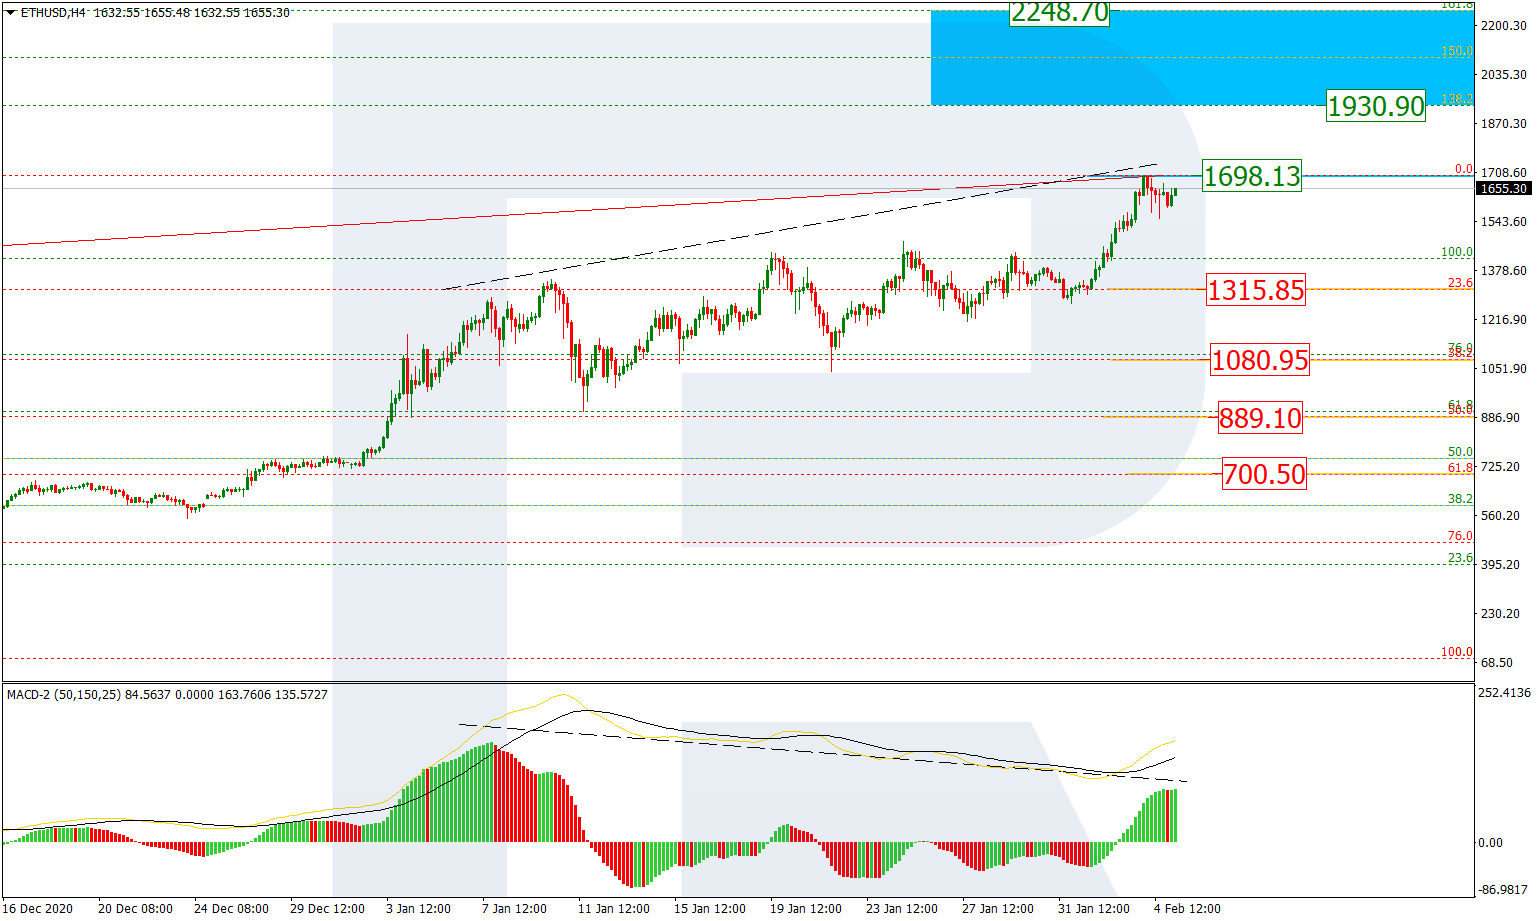
The H4 chart shows a new wave within the uptrend, which is probably the most stable uptrend in the currency market. Possibly, the asset may break the high at 1698.13 and then reach the post-correctional extension area between 138.2% and 161.8% fibo at 1930.90 and 2248.70 respectively. However, there is a divergence on MACD, which may hint at a new short-term correction to reach 23.6%, 38.2%, 50.0%, and 61.8% fibo at 1315.85, 1080.95, 889.10, and 700.50 respectively.
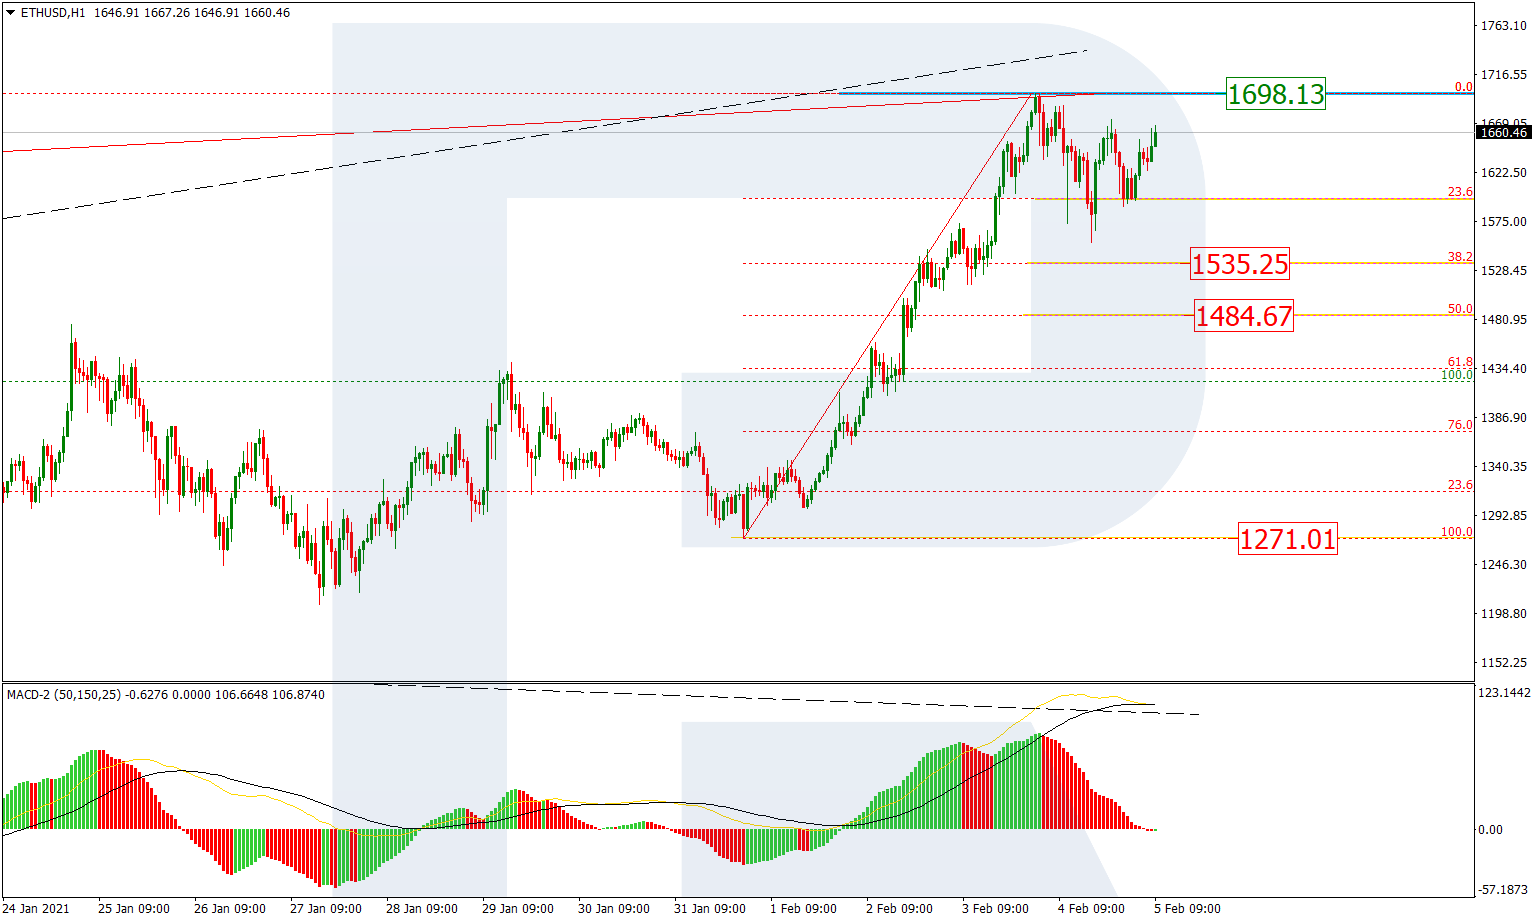
As we can see in the H1 chart, the pair is correcting after completing the ascending wave and has already reached 23.6% fibo. Later, the price may continue falling towards 38.2% and 50.0% fibo at 1535.25 and 1484.67 respectively. At the same time, a breakout of the local low at 1207.60 may hint at a further mid-term downtrend.
Article By RoboForex.com
Attention!
Forecasts presented in this section only reflect the author’s private opinion and should not be considered as guidance for trading. RoboForex LP bears no responsibility for trading results based on trading recommendations described in these analytical reviews.

- EUR/USD: The Advantage Remains with the Dollar Jun 29, 2026
- Escalation of the US–Iran conflict is once again supporting the rise in oil prices Jun 29, 2026
- Oil prices fall back to pre‑war levels. Silver drops to a 7‑month low Jun 25, 2026
- Gold Falls to an Eight-Month Low: This May Not Be the Bottom Jun 25, 2026
- Stock indices came under heavy selling pressure amid growing skepticism about AI investments Jun 24, 2026
- The Pound Is Pressured Not by Politics, but by a Strong US Dollar Jun 24, 2026
- Global crude oil prices continued to decline. The AUD/USD exchange rate hit an 11‑week low Jun 23, 2026
- EUR/USD Remains Under Sellers’ Control as the Dollar Stays Strong Jun 23, 2026
- Gold Falls for the Third Consecutive Week: Is There Still Upside Potential? Jun 22, 2026
- Bank Indonesia raised its interest rate. Norges Bank and the SNB left rates unchanged Jun 19, 2026