
Article By RoboForex.com
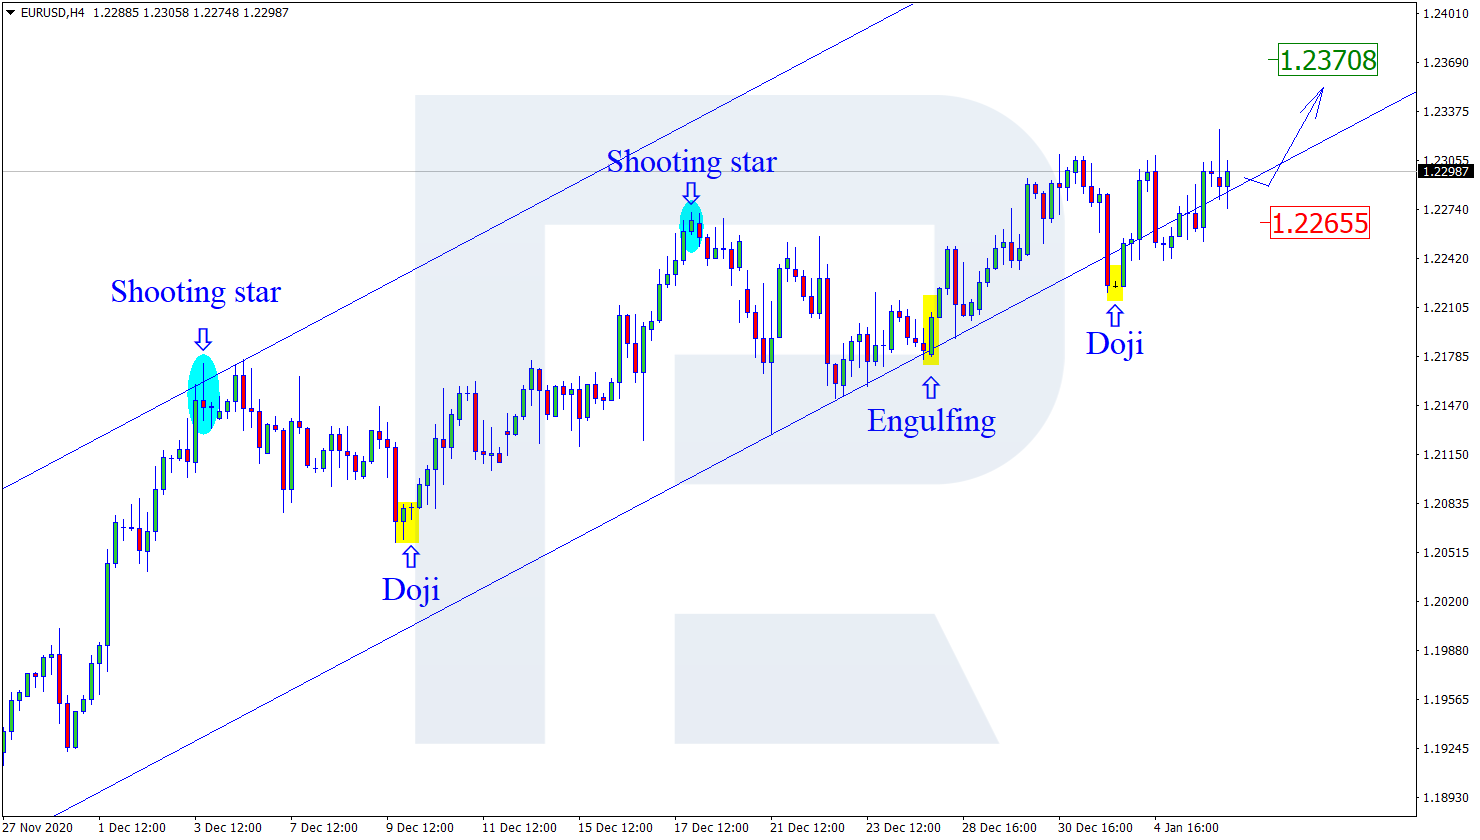
EURUSD, “Euro vs. US Dollar”
As we can see in the H4 chart, the ascending tendency continues. Right now, after forming several reversal patterns, such as Doji, close to the support level, EURUSD may reverse in the form of another rising impulse. The upside target may be at 1.2370. After that, the pair may continue trading upwards. However, an alternative scenario implies that the price may start a new decline towards 1.2265 before resuming the uptrend.

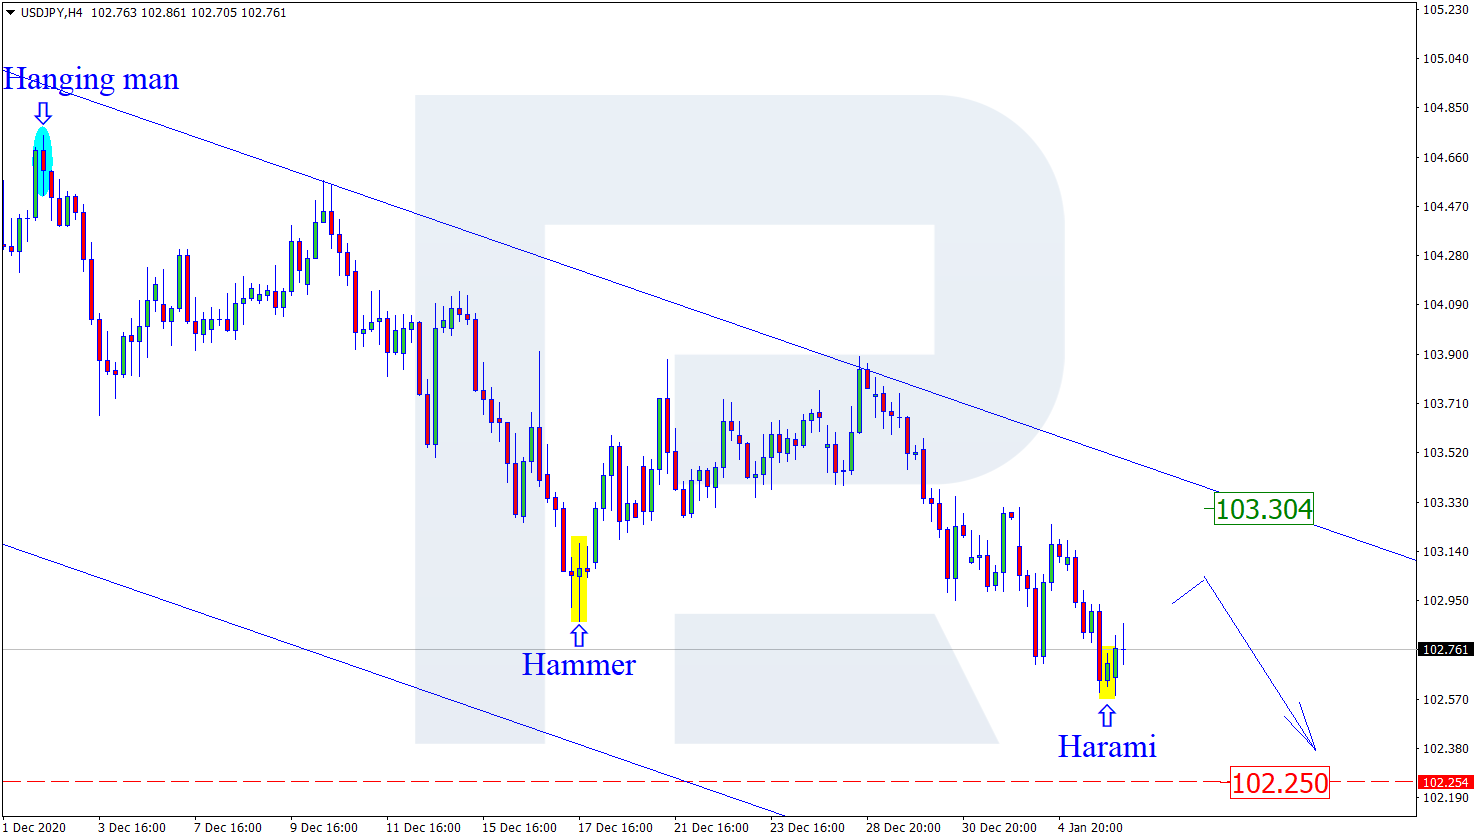
USDJPY, “US Dollar vs. Japanese Yen”
As we can see in the H4 chart, after testing the horizontal support level and forming a Harami pattern, USDJPY is reversing. The correctional target remains close to the descending channel’s upside border at 103.30. After finishing the correction, the asset may continue trading downwards to reach the support area at 102.25.
Free Reports:
 Get our Weekly Commitment of Traders Reports - See where the biggest traders (Hedge Funds and Commercial Hedgers) are positioned in the futures markets on a weekly basis.
 Download Our Metatrader 4 Indicators – Put Our Free MetaTrader 4 Custom Indicators on your charts when you join our Weekly Newsletter
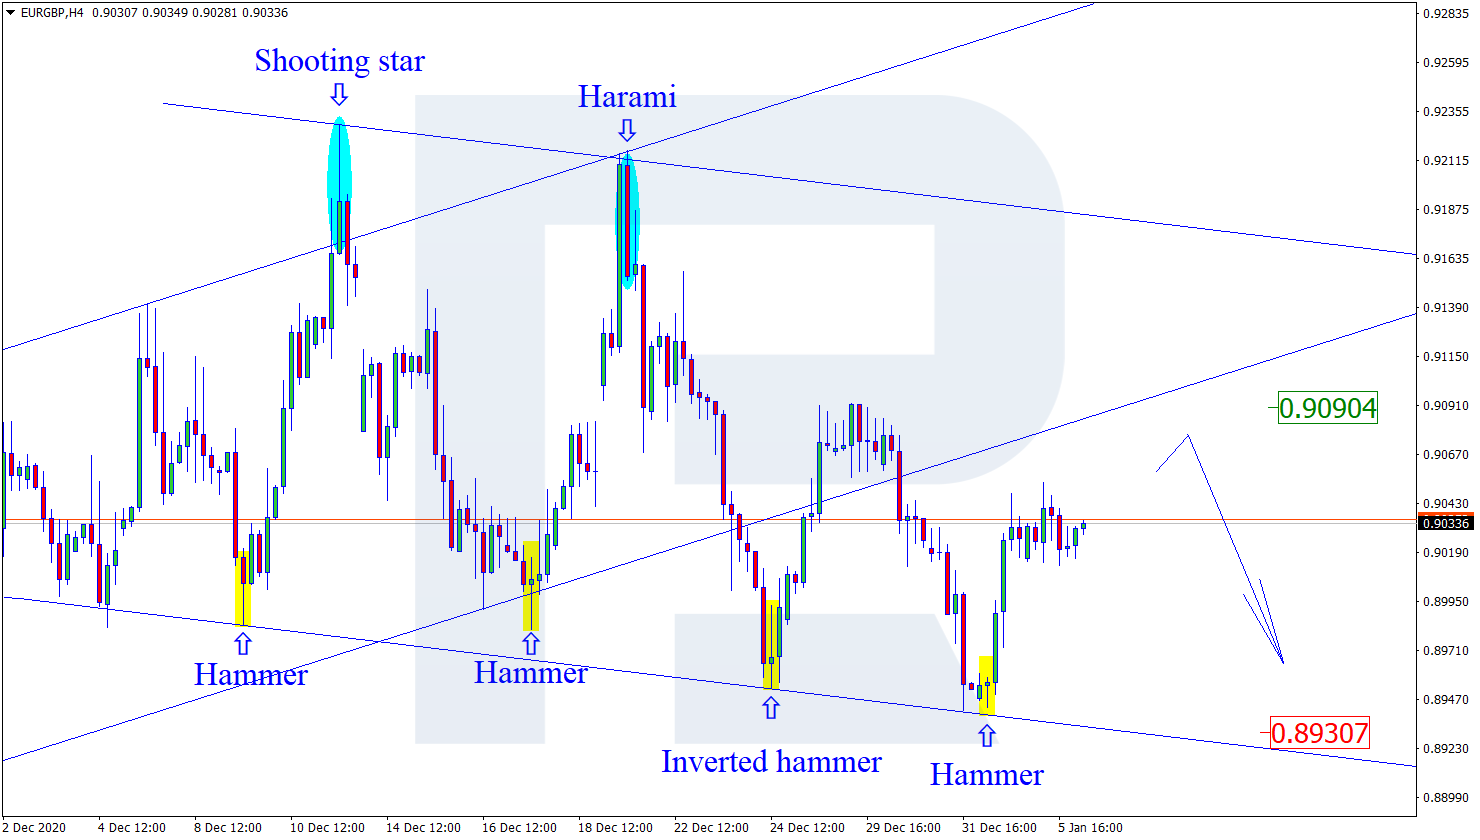
EURGBP, “Euro vs. Great Britain Pound”
As we can see in the H4 chart, after forming several reversal patterns, such as Hammer, not far from the support level, EURGBP is reversing and correcting. In this case, the upside target may be at 0.9090. However, judging by previous movements, the pair may yet start another decline to reach 0.8930 without testing the resistance level.
Article By RoboForex.com
Attention!
Forecasts presented in this section only reflect the author’s private opinion and should not be considered as guidance for trading. RoboForex LP bears no responsibility for trading results based on trading recommendations described in these analytical reviews.

- The US and European stock indices are rising again amid renewed investor interest in the AI industry. Jul 10, 2026
- USD/JPY Falls as Yen Recovers Weekly Losses Jul 10, 2026
- Crude oil prices surged sharply by 7% in reaction to the rapid escalation of the conflict in the Middle East Jul 9, 2026
- Middle East Tensions Weigh on Gold Jul 9, 2026
- Pound Awaits Tighter Policy from Bank of England Jul 8, 2026
- The United States carried out airstrikes on Iran after Iran’s attacked tankers in the Strait of Hormuz. The RBNZ raised the interest rate to 2.5% Jul 8, 2026
- RoboForex Brings Full-Scale Trading to Telegram Jul 7, 2026
- Your Bourse Integrates TradingView Charts and Trading Platform Library with Trade Server Jul 7, 2026
- Yen Still Under Pressure: Markets Await Action from Authorities Jul 7, 2026
- Germany’s DAX Index has updated its all‑time high. OPEC+ countries have agreed to increase production Jul 7, 2026