
Article By RoboForex.com
XAUUSD, “Gold vs US Dollar”
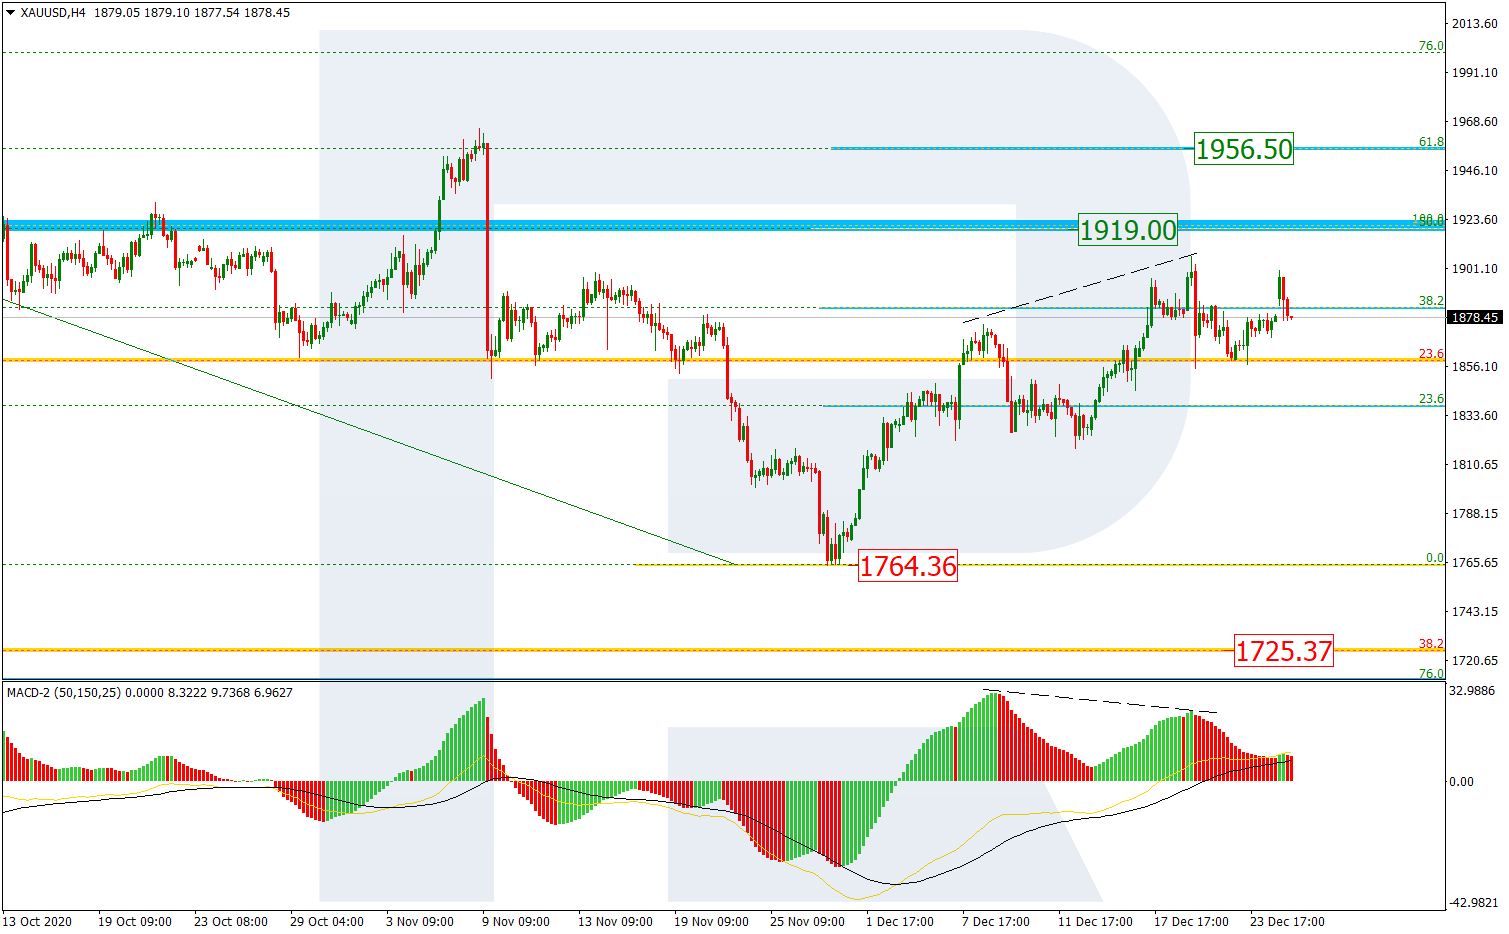
As we can see in the H4 chart, after completing the descending impulse, the asset started growing and has already tested the previous local high. If XAUUSD isn’t strong enough to start a new decline, then the price may continue growing to reach 50.0% and 61.8% fibo at 1919.00 and 1956.50 respectively. However, one shouldn’t disregard a divergence on MACD, which may hint at further mid-term decline towards the low at 1764.36. If the pair breaks this level, it will continue falling to reach the target at 38.2% fibo (1725.37).

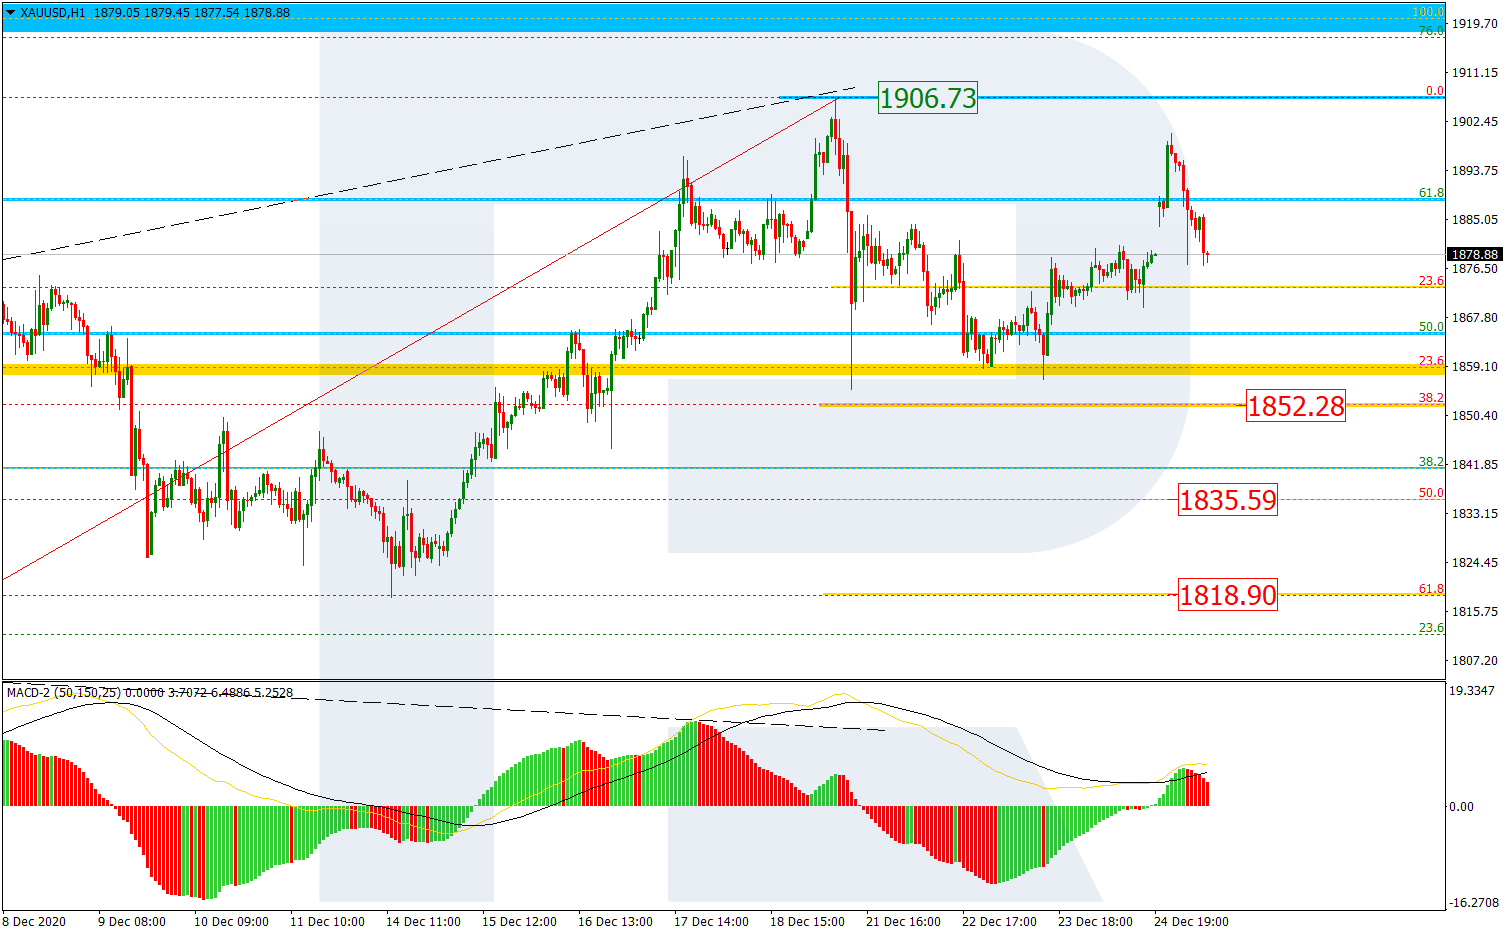
The H1 chart shows a more detailed structure of the current correction after a divergence on MACD. After breaking 23.6% fibo, it has yet failed to reach 38.2% fibo at 1852.28. The next downside targets may be 50.0% and 61.8% fibo at 1835.59 and 1818.90 respectively. However, a breakout of the local high at 1906.73 will result in further trend to the upside.
Free Reports:
 Get our Weekly Commitment of Traders Reports - See where the biggest traders (Hedge Funds and Commercial Hedgers) are positioned in the futures markets on a weekly basis.
 Download Our Metatrader 4 Indicators – Put Our Free MetaTrader 4 Custom Indicators on your charts when you join our Weekly Newsletter
USDCHF, “US Dollar vs Swiss Franc”
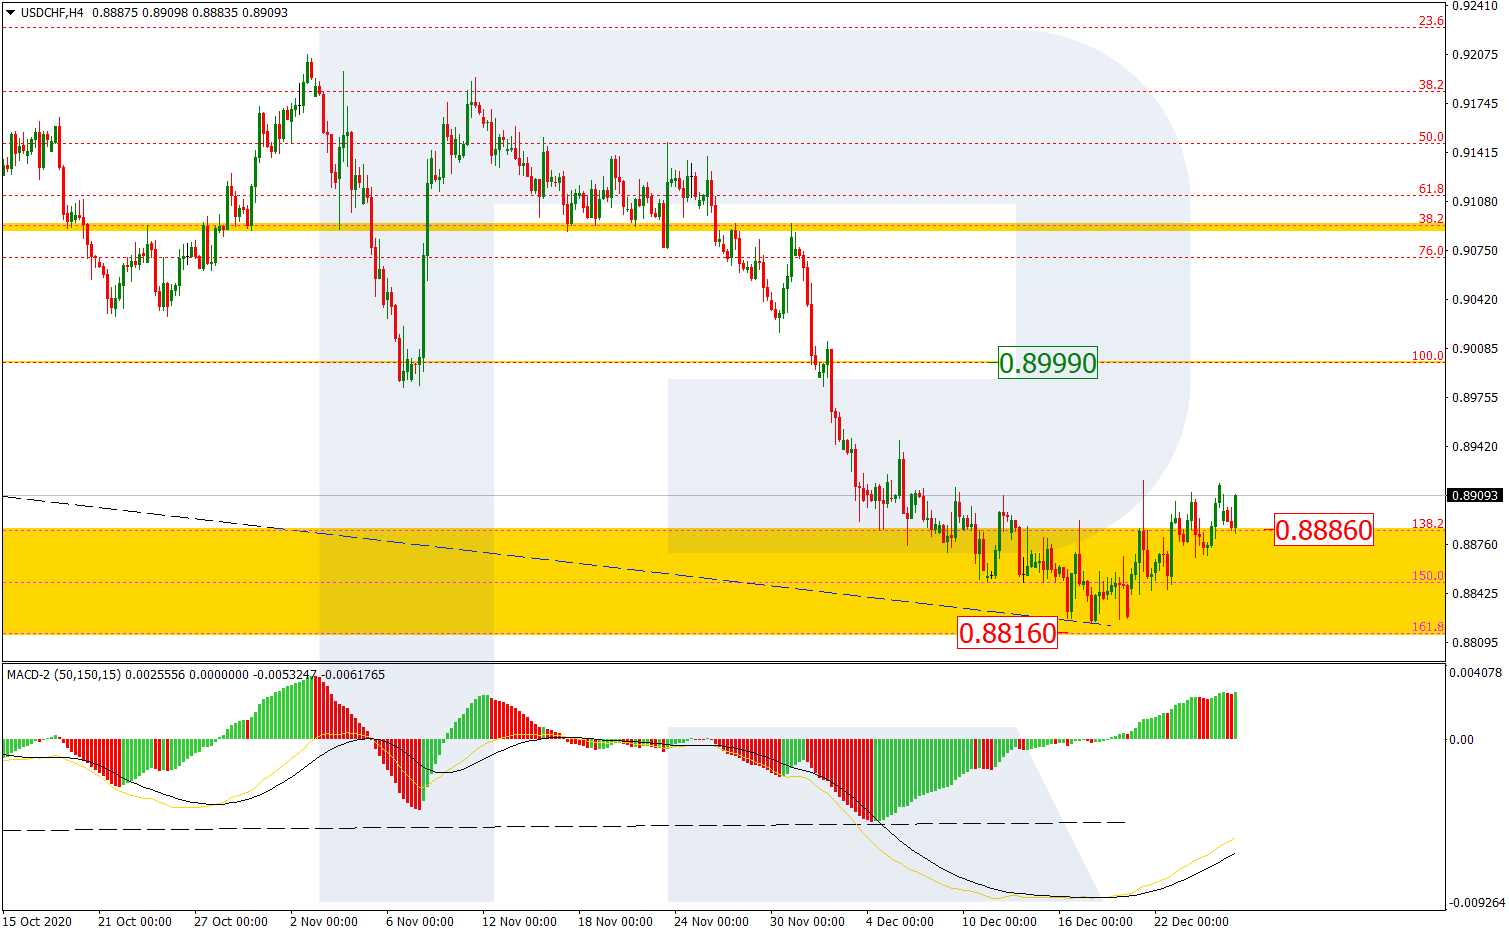
As we can see in the H4 chart, the situation hasn’t changed much. After leaving the post-correctional extension area between 138.2% and 161.8% fibo at 0.8886 and 0.8816 respectively to the upside, USDCHF is moving upwards and this growth can be considered as a correction after a long-term convergence on MACD. The correctional target remains at the resistance at 0.8999.
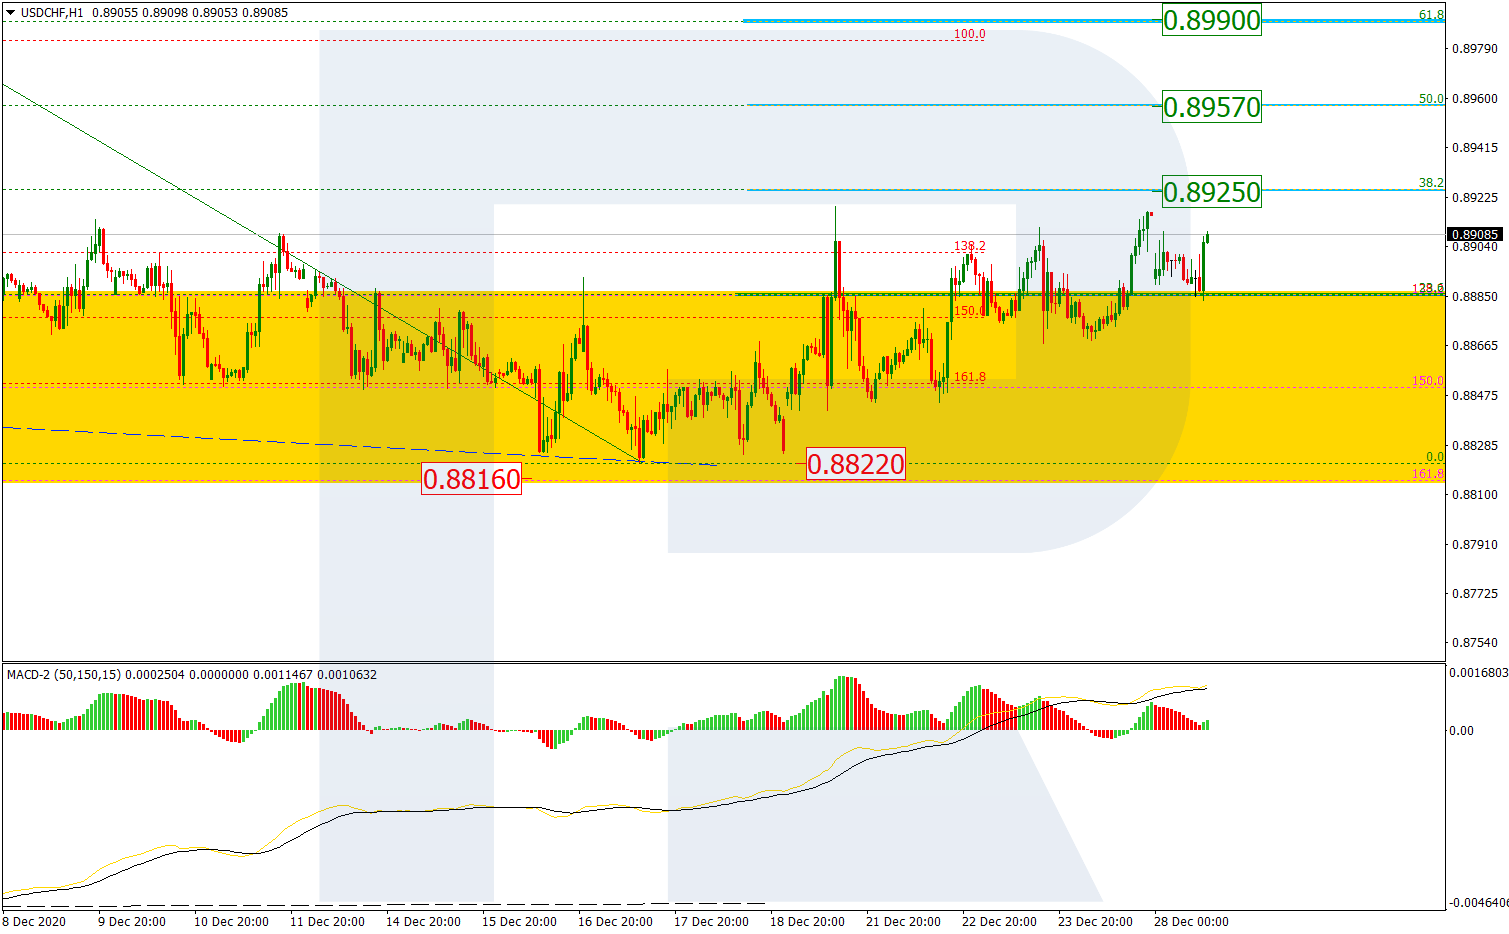
In the H1 chart, the pair is correcting upwards after a convergence on MACD. Judging by the price movement in this area, it is trying to fix above 23.6% fibo before further growth towards 38.2% fibo at 0.8926. Later, the market may continue growing towards 50.0% and 61.8% fibo at 0.8957 and 0.8990 respectively. A breakout of the support at 0.8822 will complete this correction.
Article By RoboForex.com
Attention!
Forecasts presented in this section only reflect the author’s private opinion and should not be considered as guidance for trading. RoboForex LP bears no responsibility for trading results based on trading recommendations described in these analytical reviews.

- GBPUSD Awaits Bank of England Meeting Near April Lows Jun 18, 2026
- Markets disliked the results of the FOMC meeting. HKMA followed the Fed and kept its rate unchanged. Jun 18, 2026
- Gold Surges 2% Since Week Opening Amid Geopolitical Shifts and Fed Expectations Jun 17, 2026
- Your Bourse and FXPRIMUS Bring 24/7 Synthetic Indices to the Global Broker Market Jun 16, 2026
- Institutional investors continue to reduce their presence in metals Jun 16, 2026
- USDJPY Driven by Emotions: Bank of Japan Raises Rate to Highest Level Since 1995 Jun 16, 2026
- The United States and Iran have signed a peace agreement – oil has fallen to 80 dollars per barrel. Jun 15, 2026
- EURUSD Ahead of the New Week: Expecting High Volatility Jun 15, 2026
- COT Metals Charts: Speculator Bets led by Steel Jun 14, 2026
- COT Bonds Charts: Speculator Bets led by 2-Year Bonds & Ultra 10-Year Bonds Jun 14, 2026