
Article By RoboForex.com
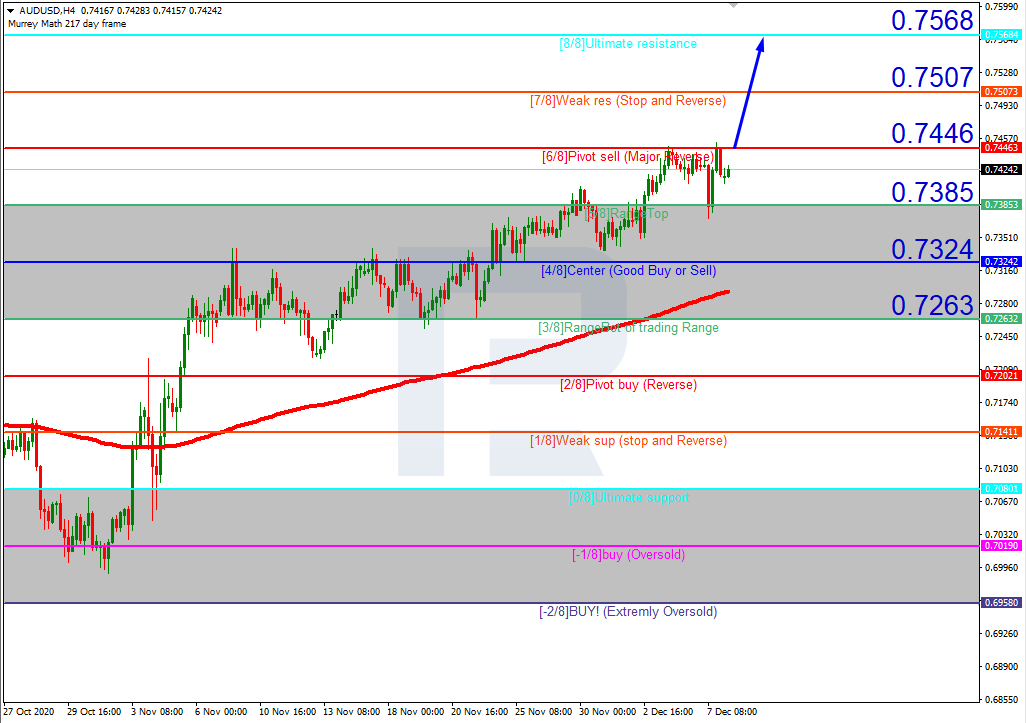
AUDUSD, “Australian Dollar vs US Dollar”
On H4, the quotations are trading above the 200-days Moving Average, indicating an uptrend. We expect a breakaway of 6/8 and further growth of the quotations to the resistance level of 8/8. The scenario might be canceled by a breakaway of 5/8 top-down, which will drive the price down to the support at 4/8.

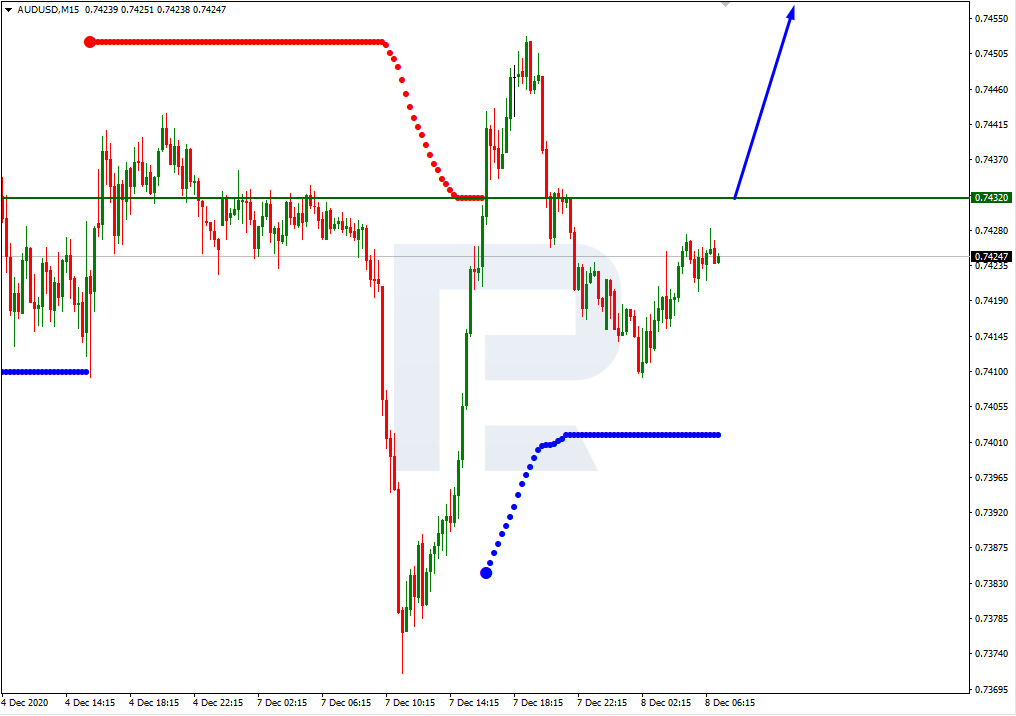
On M15, a breakaway of the upper border of the VoltyChannel indicator will additionally support the growth.
Free Reports:
 Sign Up for Our Stock Market Newsletter – Get updated on News, Charts & Rankings of Public Companies when you join our Stocks Newsletter
 Get our Weekly Commitment of Traders Reports - See where the biggest traders (Hedge Funds and Commercial Hedgers) are positioned in the futures markets on a weekly basis.
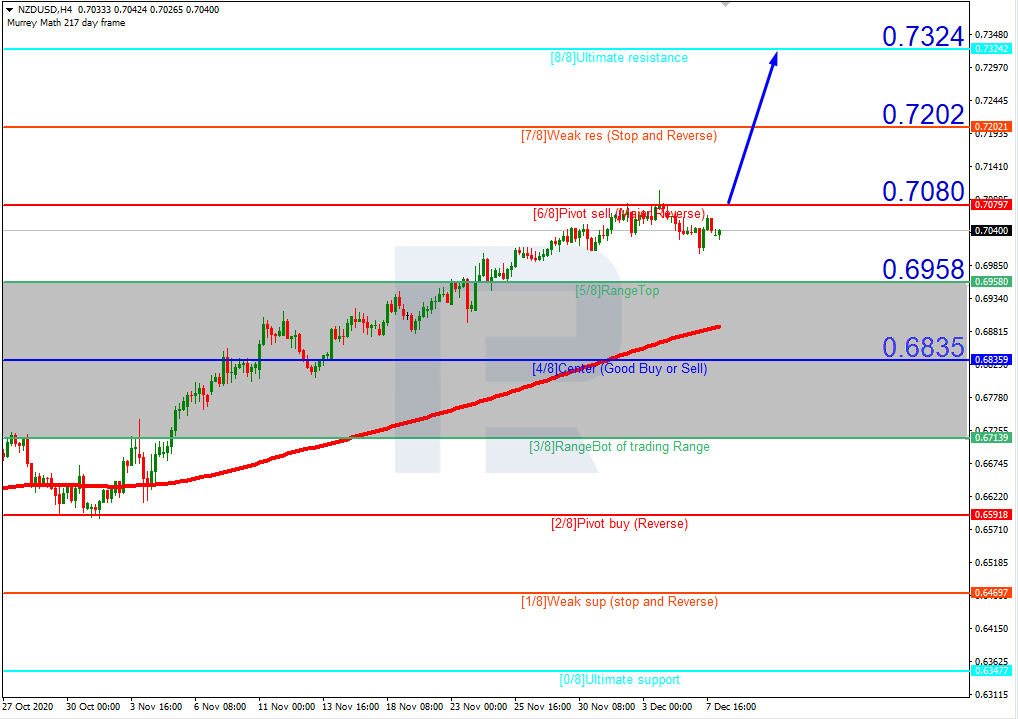
NZDUSD, “New Zealand Dollar vs US Dollar”
On H4, the quotations are trading above the 200-days Moving Average and near 6/8. A breakaway of this level might catalyze further growth to the resistance level at 8/8. This scenario might be canceled by a breakaway of the support at 5/8. In this case, the quotations might decline to 4/8.
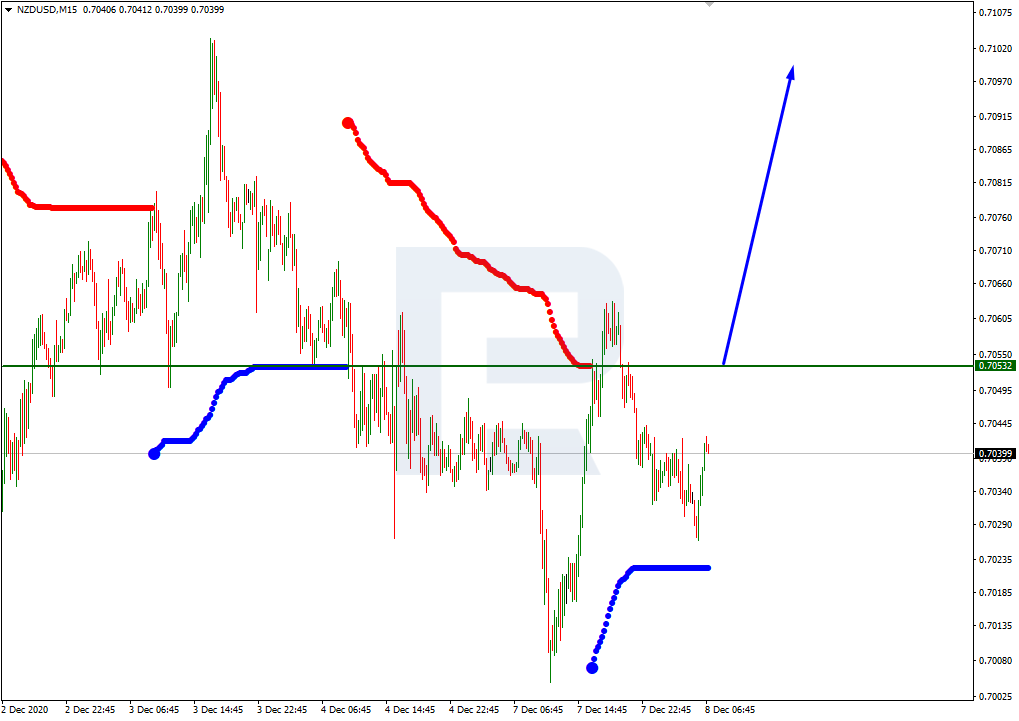
On M15, a breakaway of the upper border of VoltyChannel will increase the probability of the growth of the price.
Article By RoboForex.com
Attention!
Forecasts presented in this section only reflect the author’s private opinion and should not be considered as guidance for trading. RoboForex LP bears no responsibility for trading results based on trading recommendations described in these analytical reviews.

- Gold Surges 2% Since Week Opening Amid Geopolitical Shifts and Fed Expectations Jun 17, 2026
- Your Bourse and FXPRIMUS Bring 24/7 Synthetic Indices to the Global Broker Market Jun 16, 2026
- Institutional investors continue to reduce their presence in metals Jun 16, 2026
- USDJPY Driven by Emotions: Bank of Japan Raises Rate to Highest Level Since 1995 Jun 16, 2026
- The United States and Iran have signed a peace agreement – oil has fallen to 80 dollars per barrel. Jun 15, 2026
- EURUSD Ahead of the New Week: Expecting High Volatility Jun 15, 2026
- COT Metals Charts: Speculator Bets led by Steel Jun 14, 2026
- COT Bonds Charts: Speculator Bets led by 2-Year Bonds & Ultra 10-Year Bonds Jun 14, 2026
- COT Energy Charts: Speculator Bets led by Brent Oil Jun 14, 2026
- COT Soft Commodities Charts: Weekly Speculator Bets led lower by Corn and Soybean Meal Jun 14, 2026