
Article By RoboForex.com
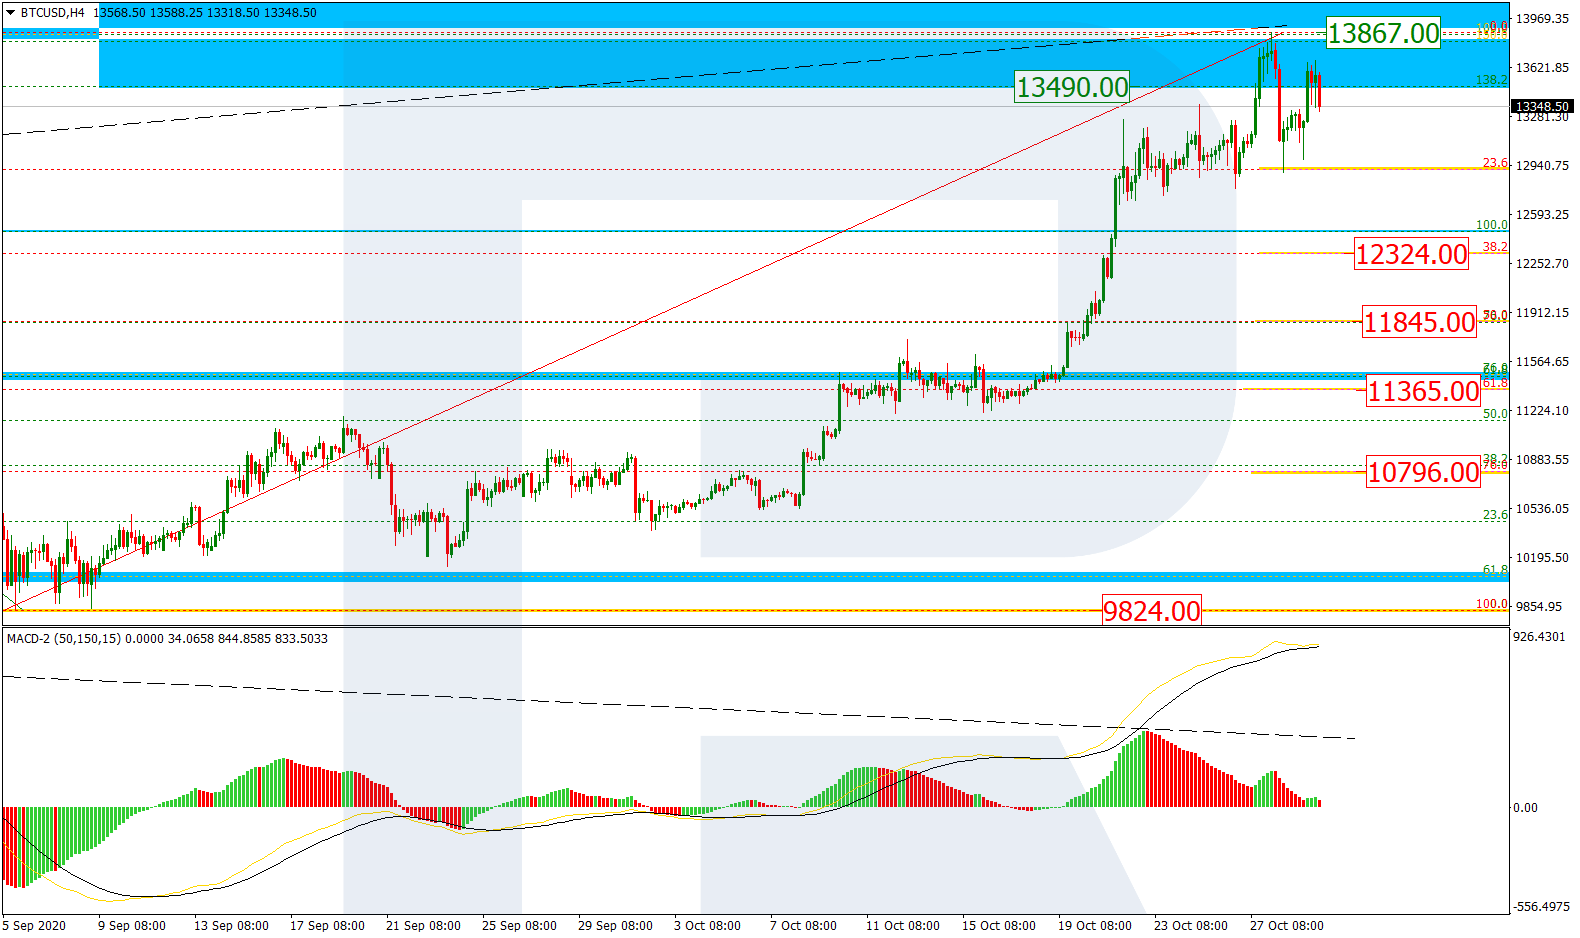
BTCUSD, “Bitcoin vs US Dollar”
In the H4 chart, after updating its two-year high, BTCUSD has tested the post-correctional extension area between 138.2% and 161.8% fibo at 13490.00 and 14115.00 respectively. At the same time, there is a divergence within the uptrend, which may indicate a possible pullback or reversal. The key downside target will be the fractal support at 9824.00.

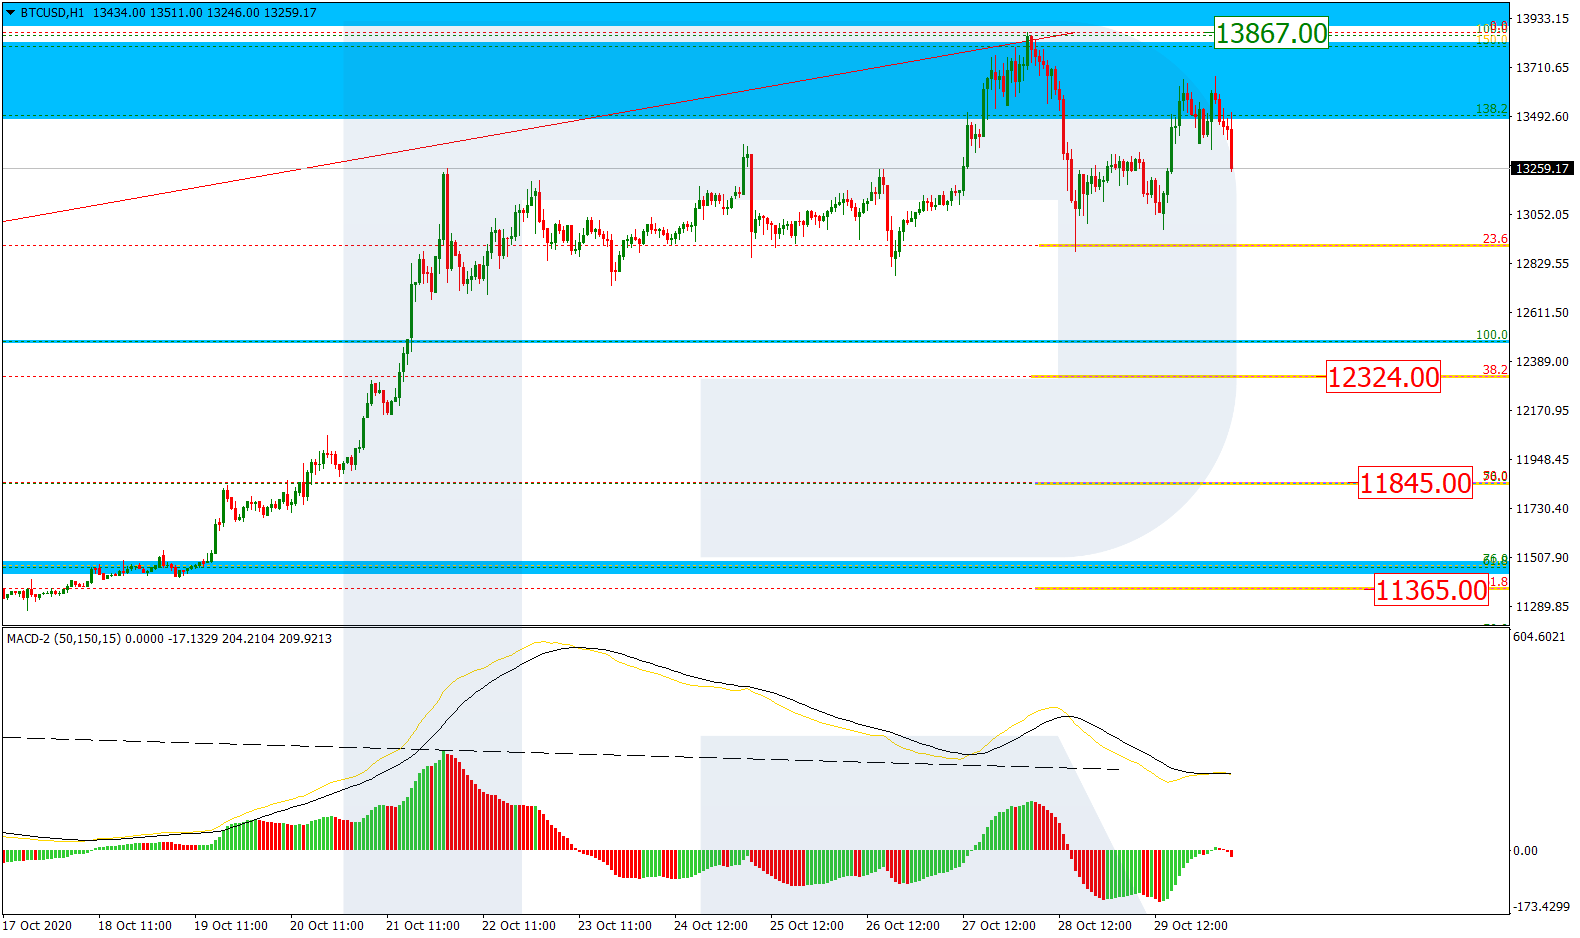
The H1 chart shows the start of a new decline after the divergence on MACD. After reaching and testing 23.6% fibo, this descending movement may continue towards 38.2%, 50.0%, and 61.8% fibo at 12324.00, 11845.00, and 11365.00 respectively. The resistance is the high at 13867.00.
Free Reports:
 Get our Weekly Commitment of Traders Reports - See where the biggest traders (Hedge Funds and Commercial Hedgers) are positioned in the futures markets on a weekly basis.
 Download Our Metatrader 4 Indicators – Put Our Free MetaTrader 4 Custom Indicators on your charts when you join our Weekly Newsletter
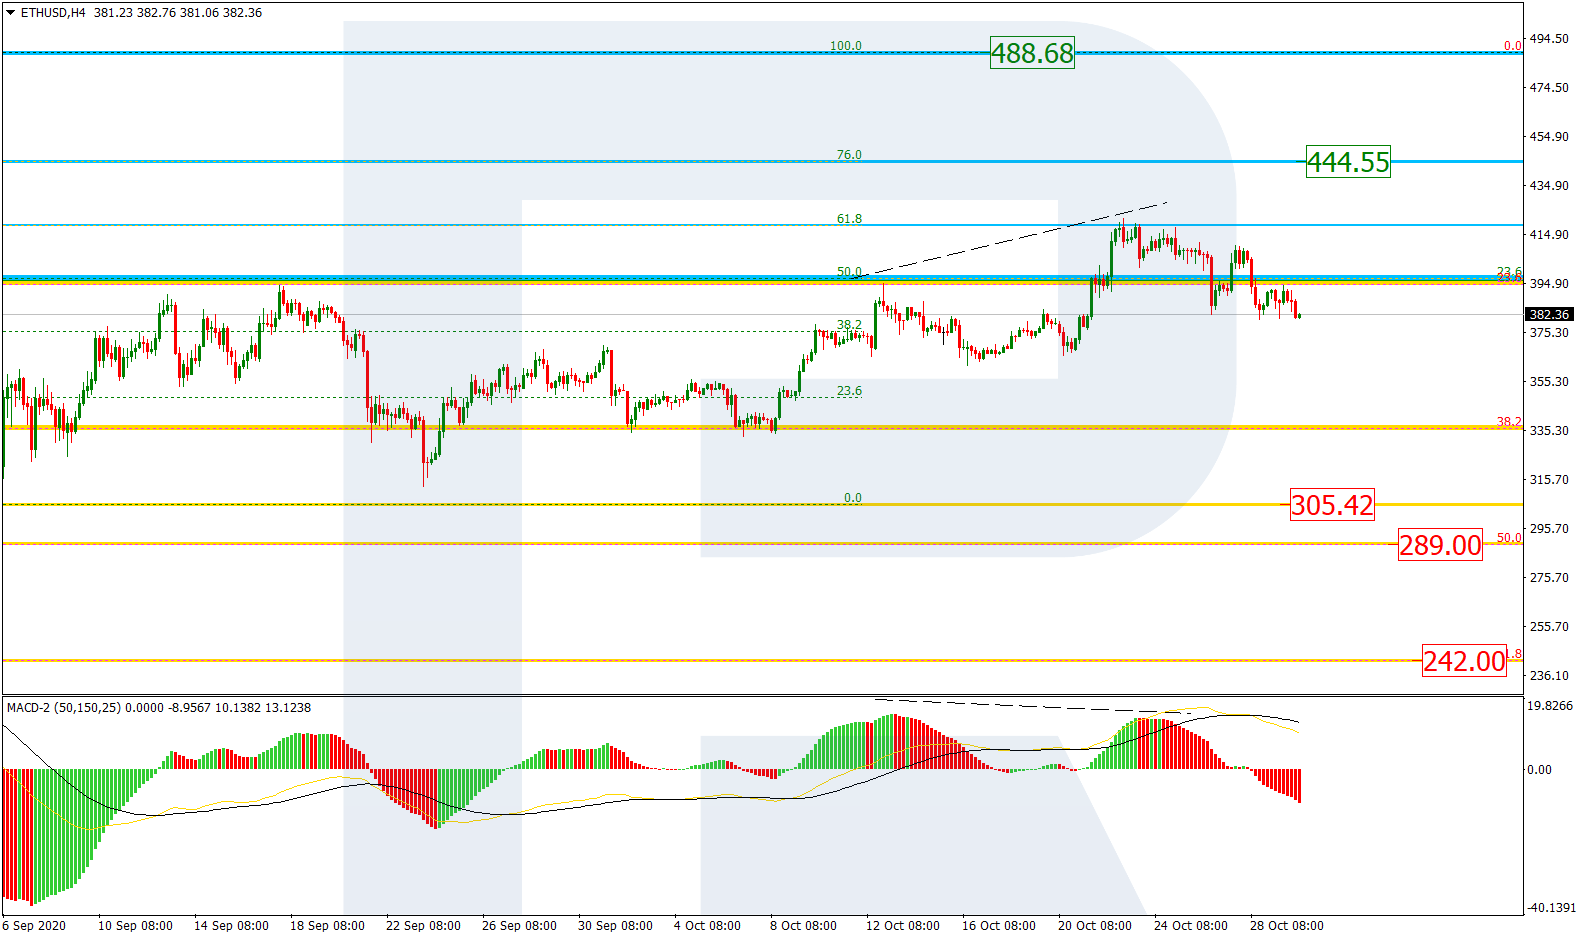
ETHUSD, “Ethereum vs. US Dollar”
As we can see in the H4 chart, after completing the descending structure, ETHUSD has reached 61.8% fibo and may yet continue growing to reach 76.0% fibo at 444.55. However, there is a divergence on MACD, which may hint at a new descending structure with the key target at the low at 305.42. The mid-term bearish scenario implies further decline towards 50.0% and 61.8% fibo at 289.00 and 242.00 respectively.
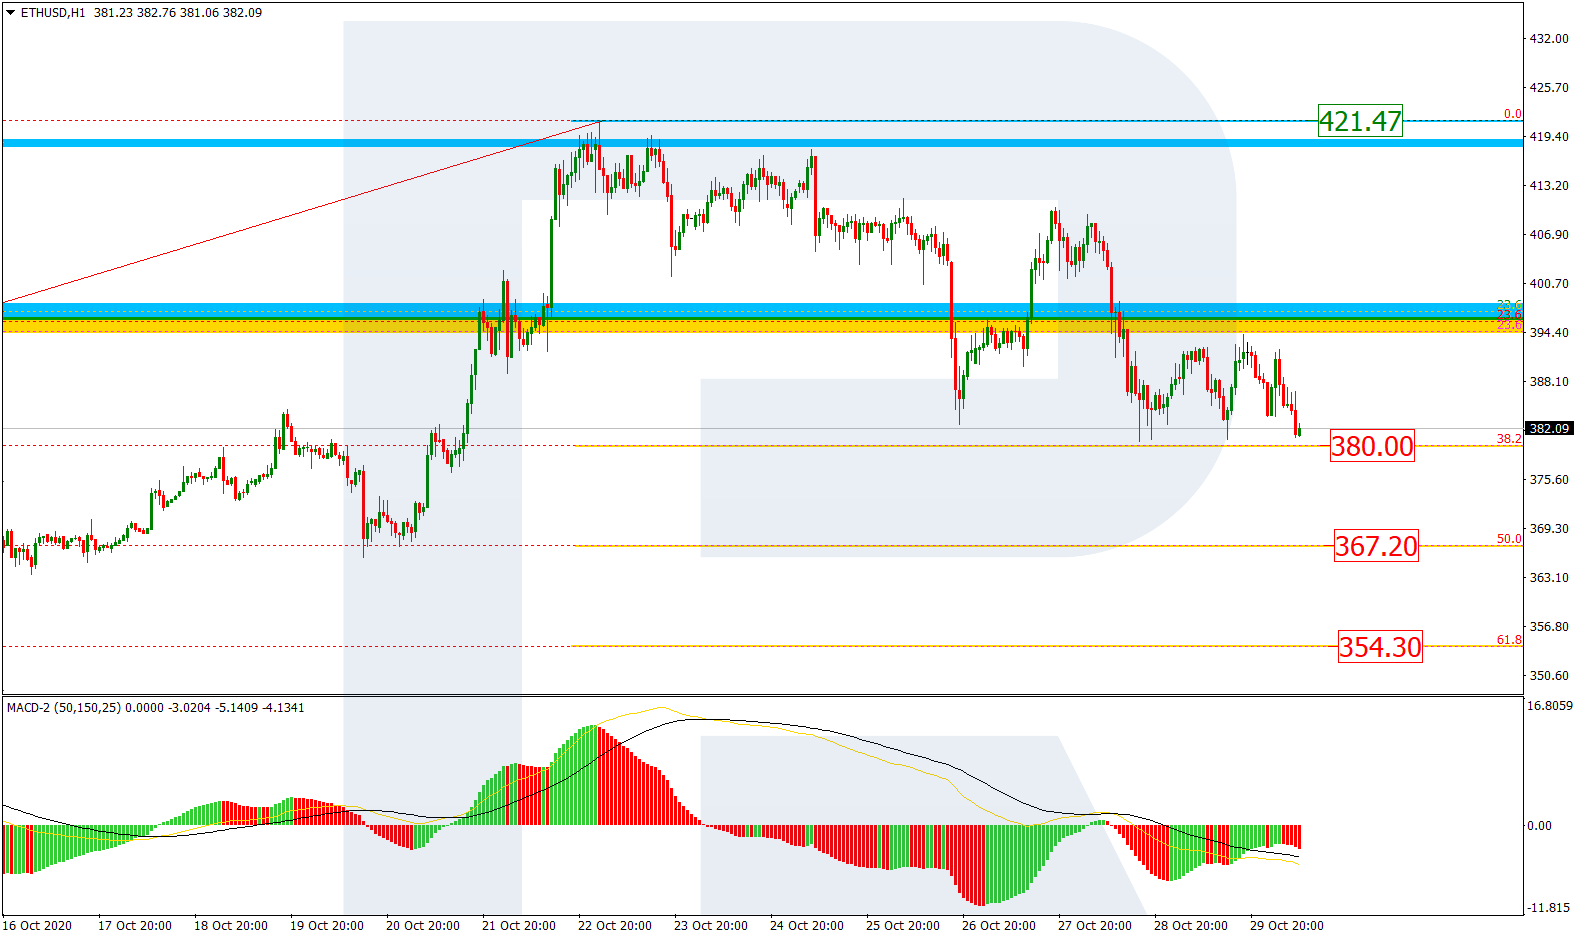
In the H1 chart, the descending correction is approaching 38.2% fibo at 380.00. The next downside targets are 50.0% and 61.8% fibo at 367.20 and 354.30 respectively. The local resistance is the high at 421.47.
Article By RoboForex.com
Attention!
Forecasts presented in this section only reflect the author’s private opinion and should not be considered as guidance for trading. RoboForex LP bears no responsibility for trading results based on trading recommendations described in these analytical reviews.

- Oil prices fall back to pre‑war levels. Silver drops to a 7‑month low Jun 25, 2026
- Gold Falls to an Eight-Month Low: This May Not Be the Bottom Jun 25, 2026
- Stock indices came under heavy selling pressure amid growing skepticism about AI investments Jun 24, 2026
- The Pound Is Pressured Not by Politics, but by a Strong US Dollar Jun 24, 2026
- Global crude oil prices continued to decline. The AUD/USD exchange rate hit an 11‑week low Jun 23, 2026
- EUR/USD Remains Under Sellers’ Control as the Dollar Stays Strong Jun 23, 2026
- Gold Falls for the Third Consecutive Week: Is There Still Upside Potential? Jun 22, 2026
- Bank Indonesia raised its interest rate. Norges Bank and the SNB left rates unchanged Jun 19, 2026
- EUR/USD Loses Ground as Market Sentiment Favours the US Dollar Jun 19, 2026
- GBPUSD Awaits Bank of England Meeting Near April Lows Jun 18, 2026