
Article By RoboForex.com
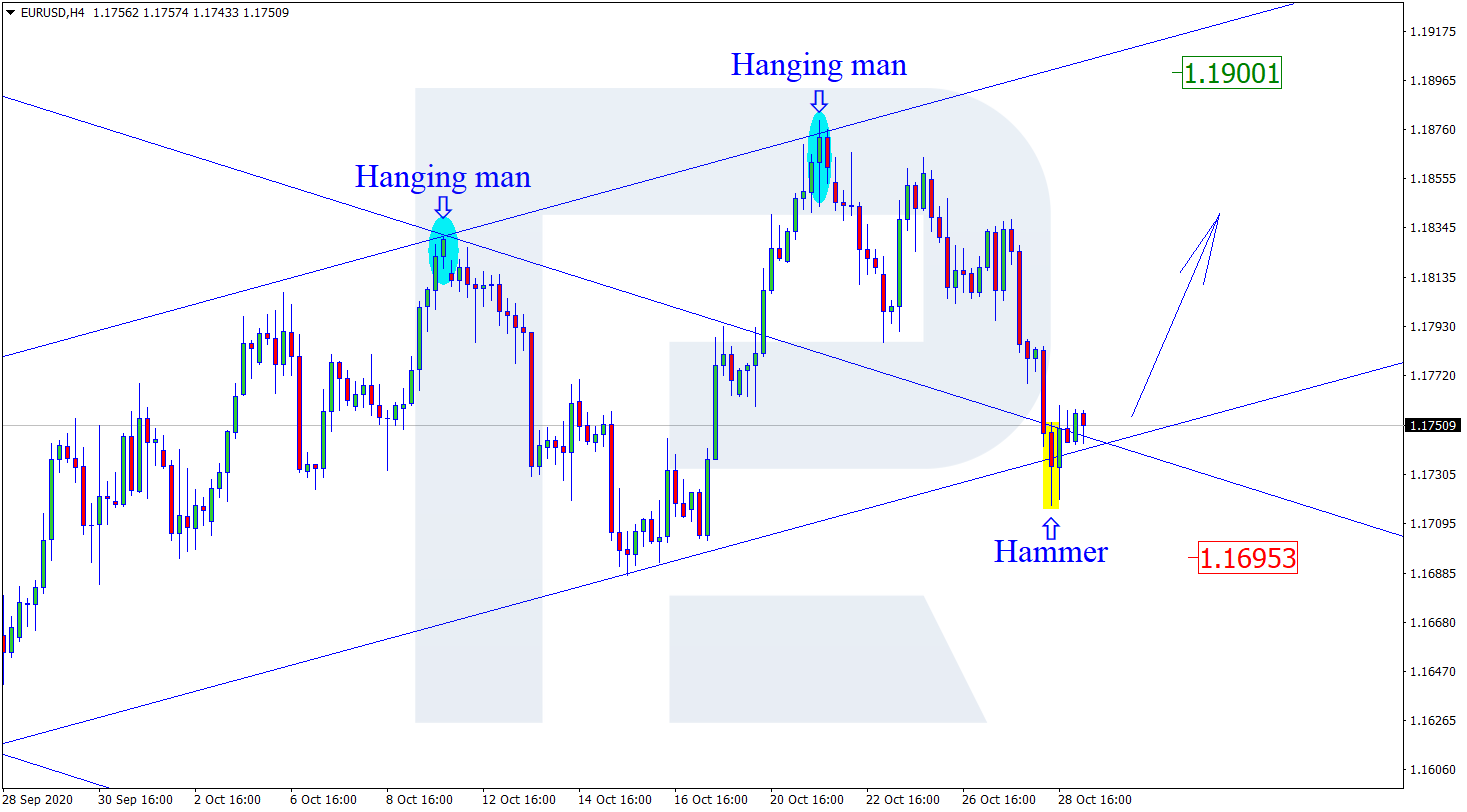
EURUSD, “Euro vs. US Dollar”
As we can see in the H4 chart, the correction within the uptrend continues. Right now, after forming several reversal patterns, such as Hammer, close to the support area, EURUSD is still reversing and may later resume growing to reach the upside target at the resistance level at 1.1900. At the same time, an alternative scenario says that the instrument may fall to reach 1.1695 without correcting towards the above-mentioned resistance level.

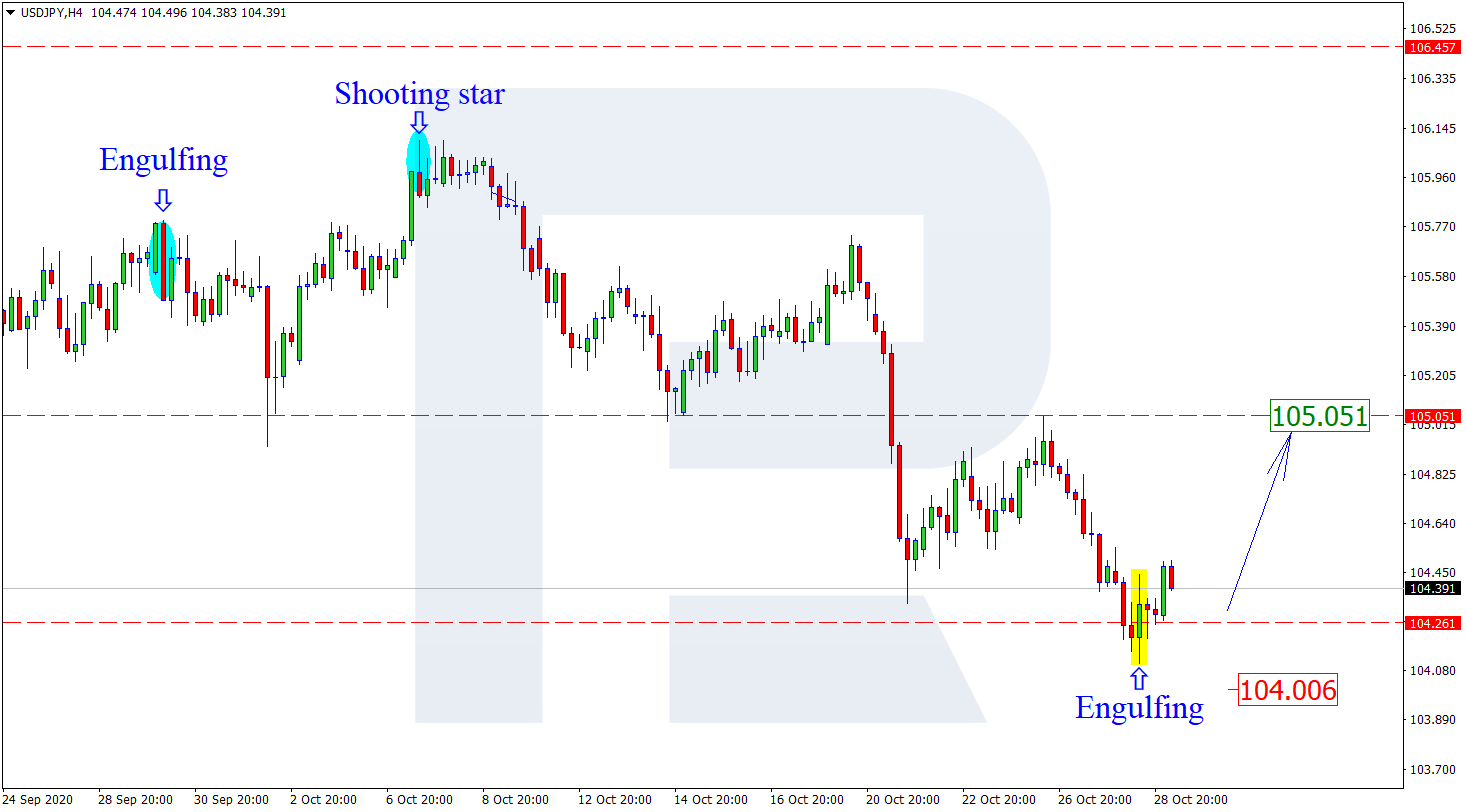
USDJPY, “US Dollar vs. Japanese Yen”
As we can see in the H4 chart, after forming several reversal patterns, such as Inverted Hammer and Engulfing, close to the support area, USDJPY is reversing. In the future, the price may test the resistance area at 105.05, break this level, and then continue the ascending tendency. In this case, the upside target is still the next resistance level at 106.45. Still, there is an opposite scenario, which says that the instrument may continue falling towards 104.00 before resuming its growth.
Free Reports:
 Sign Up for Our Stock Market Newsletter – Get updated on News, Charts & Rankings of Public Companies when you join our Stocks Newsletter
 Get our Weekly Commitment of Traders Reports - See where the biggest traders (Hedge Funds and Commercial Hedgers) are positioned in the futures markets on a weekly basis.
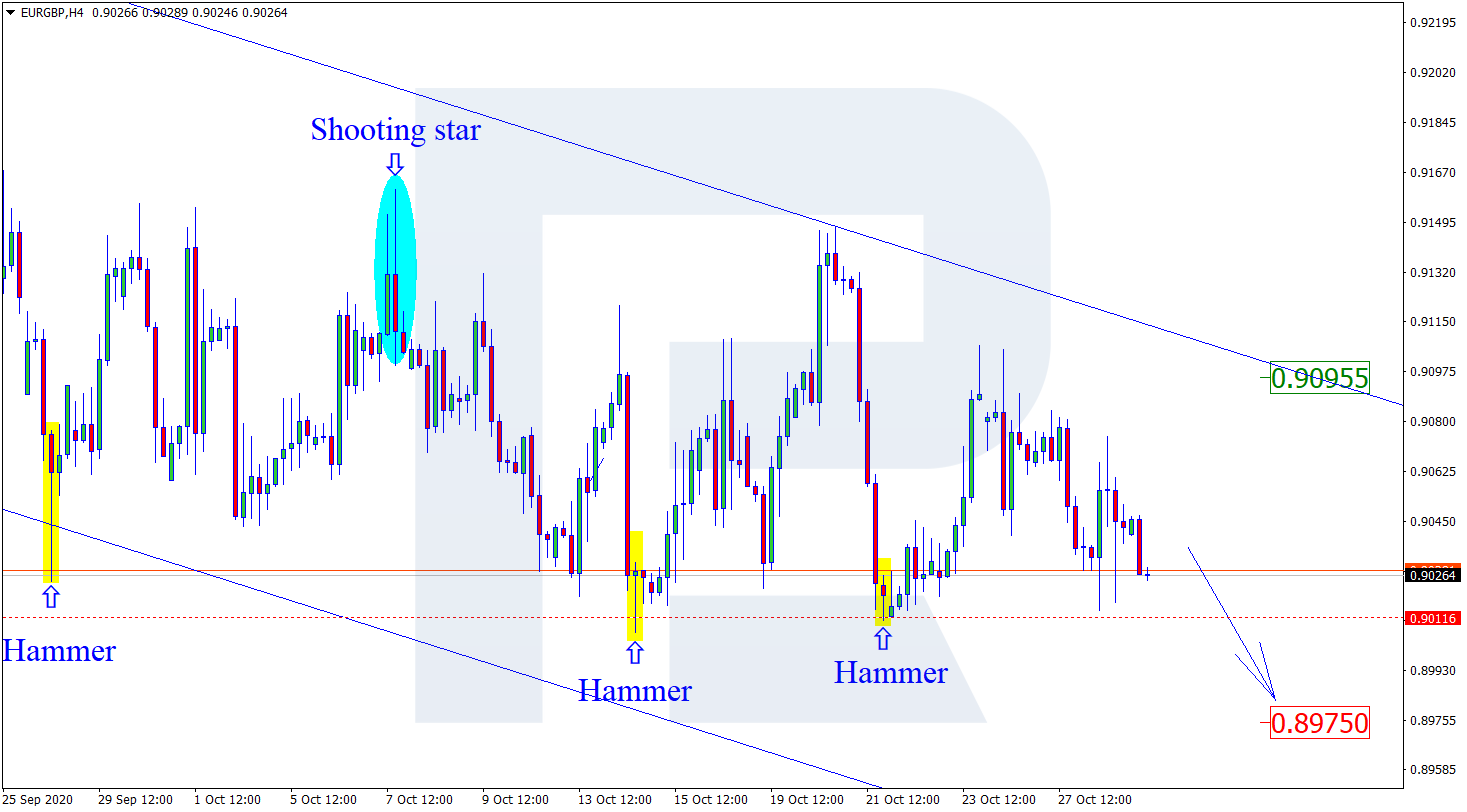
EURGBP, “Euro vs. Great Britain Pound”
As we can see in the H4 chart, the descending tendency continues. In the nearest future, EURGBP may break the horizontal support level and continue falling. In this case, the downside target will be the support area at 0.8975. However, judging by previous movements, the asset may yet rebound from the above-mentioned area once again and resume trading upwards. If it happens, the upside target will be the channel’s upside border at 0.9095.
Article By RoboForex.com
Attention!
Forecasts presented in this section only reflect the author’s private opinion and should not be considered as guidance for trading. RoboForex LP bears no responsibility for trading results based on trading recommendations described in these analytical reviews.

- Pound Awaits Tighter Policy from Bank of England Jul 8, 2026
- The United States carried out airstrikes on Iran after Iran’s attacked tankers in the Strait of Hormuz. The RBNZ raised the interest rate to 2.5% Jul 8, 2026
- RoboForex Brings Full-Scale Trading to Telegram Jul 7, 2026
- Your Bourse Integrates TradingView Charts and Trading Platform Library with Trade Server Jul 7, 2026
- Yen Still Under Pressure: Markets Await Action from Authorities Jul 7, 2026
- Germany’s DAX Index has updated its all‑time high. OPEC+ countries have agreed to increase production Jul 7, 2026
- Oil prices have stabilized. The Canadian dollar continues to trade near yearly lows. Jul 6, 2026
- EUR/USD in a Narrow Range: Focus on Fed Minutes Jul 6, 2026
- Oil prices have fallen to pre‑war levels. AI companies continue to sell off Jul 3, 2026
- Gold Rises Sharply as Markets Reassess Fed Rate Outlook Jul 3, 2026