
Article By RoboForex.com
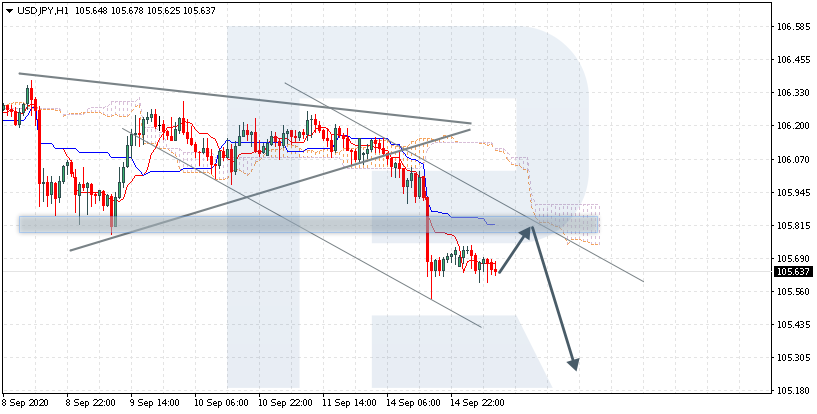
USDJPY, “US Dollar vs Japanese Yen”
USDJPY is trading at 105.63; the instrument is moving below Ichimoku Cloud, thus indicating a descending tendency. The markets could indicate that the price may test Tenkan-Sen and Kijun-Sen at 105.75 and then resume moving downwards to reach 105.25. Another signal in favor of further downtrend will be a rebound from the descending channel’s upside border. However, the bearish scenario may no longer be valid if the price breaks the cloud’s upside border and fixes above 106.05. In this case, the pair may continue growing towards 107.15.

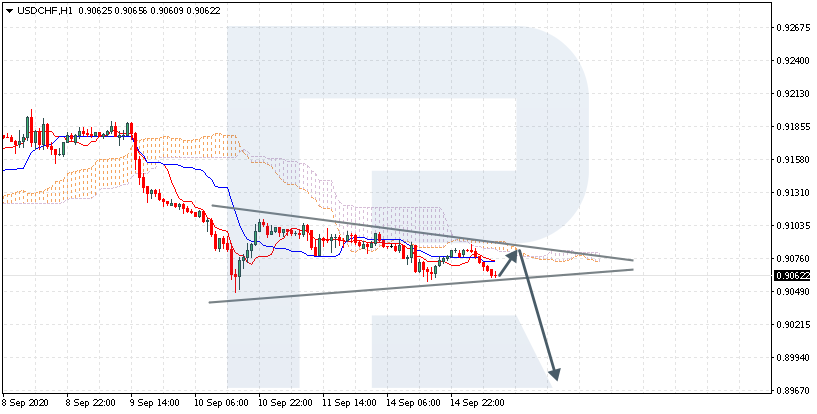
USDCHF, “US Dollar vs Swiss Franc”
USDCHF is trading at 0.9062; the instrument is moving below Ichimoku Cloud, thus indicating a descending tendency. The markets could indicate that the price may test the cloud’s upside border at 0.9080 and then resume moving downwards to reach 0.8985. Another signal in favor of further downtrend will be a rebound from the upside border of the Triangle pattern. However, the bearish scenario may no longer be valid if the price breaks the cloud’s upside border and fixes above 0.9105. In this case, the pair may continue growing towards 0.9210. To confirm further decline, the asset must break the downside border of the Triangle pattern and fix below 0.9020.
Free Reports:
 Download Our Metatrader 4 Indicators – Put Our Free MetaTrader 4 Custom Indicators on your charts when you join our Weekly Newsletter
 Get our Weekly Commitment of Traders Reports - See where the biggest traders (Hedge Funds and Commercial Hedgers) are positioned in the futures markets on a weekly basis.
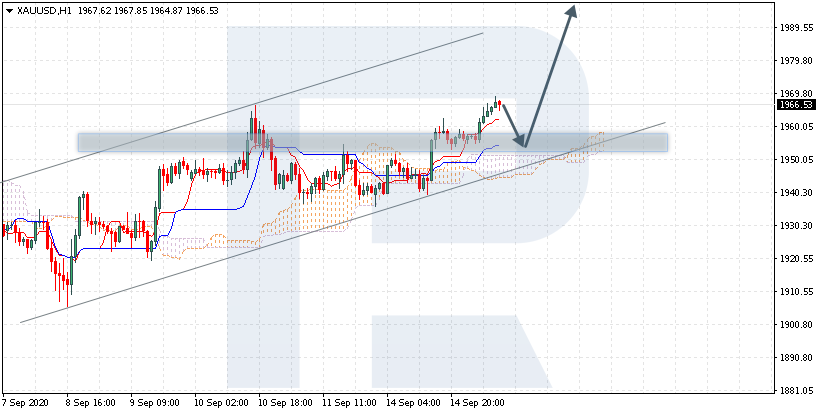
XAUUSD, “Gold vs US Dollar”
XAUUSD is trading at 1966.00; the instrument is moving above Ichimoku Cloud, thus indicating an ascending tendency. The markets could indicate that the price may test Tenkan-Sen and Kijun-Sen at 1955.00 and then resume moving upwards to reach 2005.00. Another signal in favor of further uptrend will be a rebound from the rising channel’s downside border. However, the bullish scenario may no longer be valid if the price breaks the cloud’s downside border and fixes below 1935.00. In this case, the pair may continue falling towards 1910.00.
Article By RoboForex.com
Attention!
Forecasts presented in this section only reflect the author’s private opinion and should not be considered as guidance for trading. RoboForex LP bears no responsibility for trading results based on trading recommendations described in these analytical reviews.

- Oil prices have stabilized. The Canadian dollar continues to trade near yearly lows. Jul 6, 2026
- EUR/USD in a Narrow Range: Focus on Fed Minutes Jul 6, 2026
- Oil prices have fallen to pre‑war levels. AI companies continue to sell off Jul 3, 2026
- Gold Rises Sharply as Markets Reassess Fed Rate Outlook Jul 3, 2026
- The Eurozone has shown a significant slowdown in inflation. Australia has recorded its largest trade deficit since 2015 Jul 2, 2026
- Natural gas prices are rising amid increasing electricity consumption Jul 1, 2026
- USD/JPY at 40-Year High: Multiple Factors Weigh on the Yen Jul 1, 2026
- Gold Declines: Fed Policy and Geopolitics Weigh Jun 30, 2026
- Oil prices have once again risen above 70 dollars per barrel. The Australian dollar has updated a three‑month low Jun 30, 2026
- EUR/USD: The Advantage Remains with the Dollar Jun 29, 2026