
Article By RoboForex.com
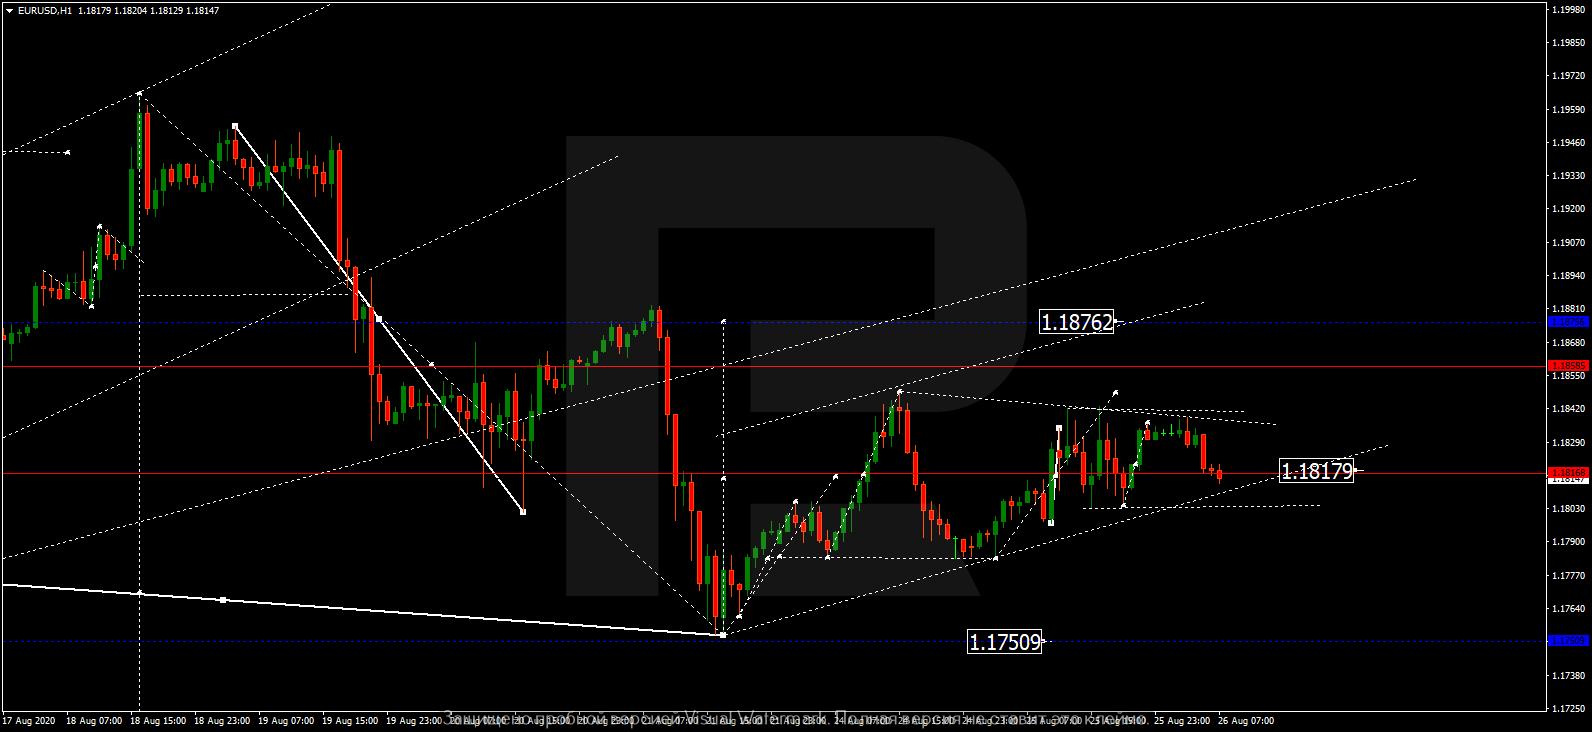
EURUSD, “Euro vs US Dollar”
EURUSD is still consolidating around 1.1820; right now. it is moving towards the downside border. Possibly, the pair may break 1.1780 downwards and continue falling to reach 1.1750. If the latter level is broken as well, the instrument may form a new descending structure with the target at 1.1717, at least.

GBPUSD, “Great Britain Pound vs US Dollar”
After completing another ascending structure at 1.3167, GBPUSD is expected to fall and break 1.3100. After that, the instrument may continue falling to reach 1.3050 or even the short-term target at 1.2950.
Free Reports:
 Download Our Metatrader 4 Indicators – Put Our Free MetaTrader 4 Custom Indicators on your charts when you join our Weekly Newsletter
 Get our Weekly Commitment of Traders Reports - See where the biggest traders (Hedge Funds and Commercial Hedgers) are positioned in the futures markets on a weekly basis.

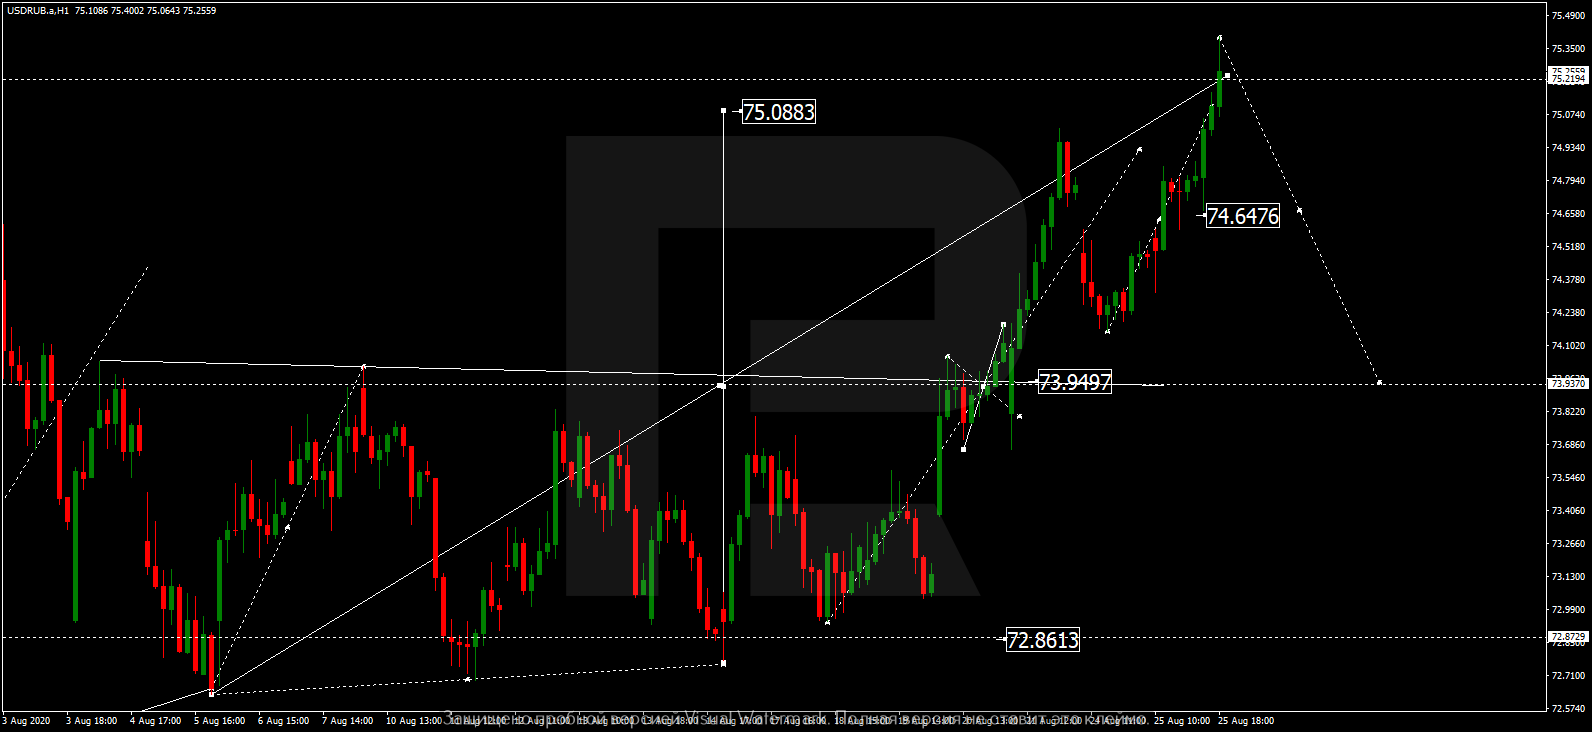
USDRUB, “US Dollar vs Russian Ruble”
After rebounding from 74.20, USDRUB has formed one more ascending structure to complete the wave at 75.22. Today, the pair may break this wave’s channel and correct with the target at 73.93.
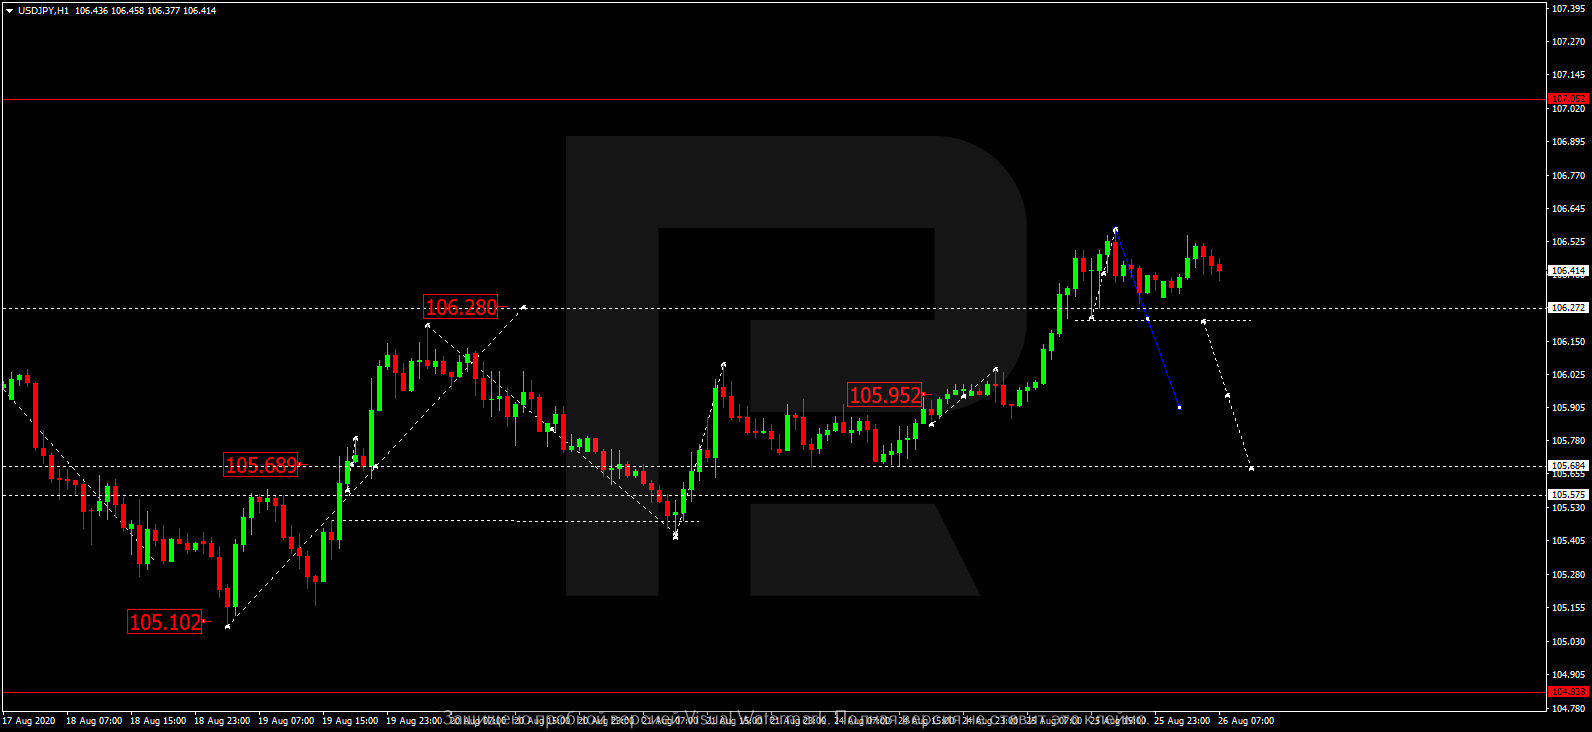
USDJPY, “US Dollar vs Japanese Yen”
USDJPY has finished the ascending wave at 106.60; right now, it is consolidating below this level. If the price breaks this range to the downside, the market may resume trading downwards with the first target at 105.60.
USDCHF, “US Dollar vs Swiss Franc”
USDCHF is consolidating around 0.9111; yesterday, it reached the downside border. Possibly, the pair may choose an alternative scenario and fall towards 0.9060. however, according to the main scenario, the price is expected to return to 0.9111 to break it and then form one more ascending structure with the target at 0.9165.

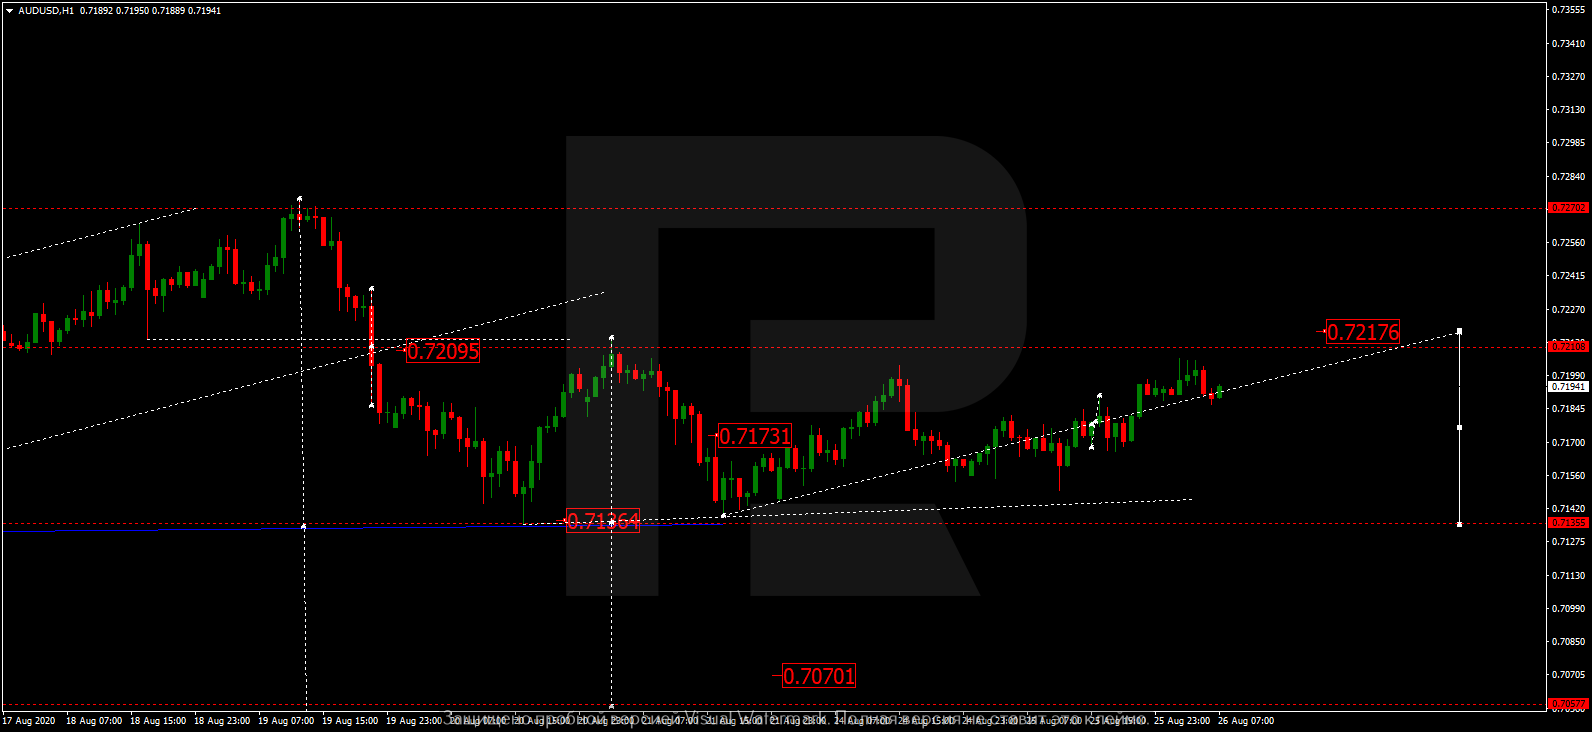
AUDUSD, “Australian Dollar vs US Dollar”
AUDUSD is still consolidating around 0.7173; right now, it is moving upwards. Today, the pair may reach the upside border at 0.7217 and then fall to break 0.7173. Later, the market may continue trading downwards with the target at 0.7130.
BRENT
After finishing the ascending wave at 46.46 and then testing 46.00 from above, Brent is moving to break 46.60 to the upside. After that, the instrument may continue trading upwards to reach 47.30 or even 47.90. however, if the price falls and breaks 46.00, the market may correct with the target at 45.00.

XAUUSD, “Gold vs US Dollar”
Gold is still consolidating around 1934.55ж right now, it is moving towards the downside border at 1909.00. If later the price breaks this level, the market may resume trading downwards with the target at 1860.00 and then 1850.00.

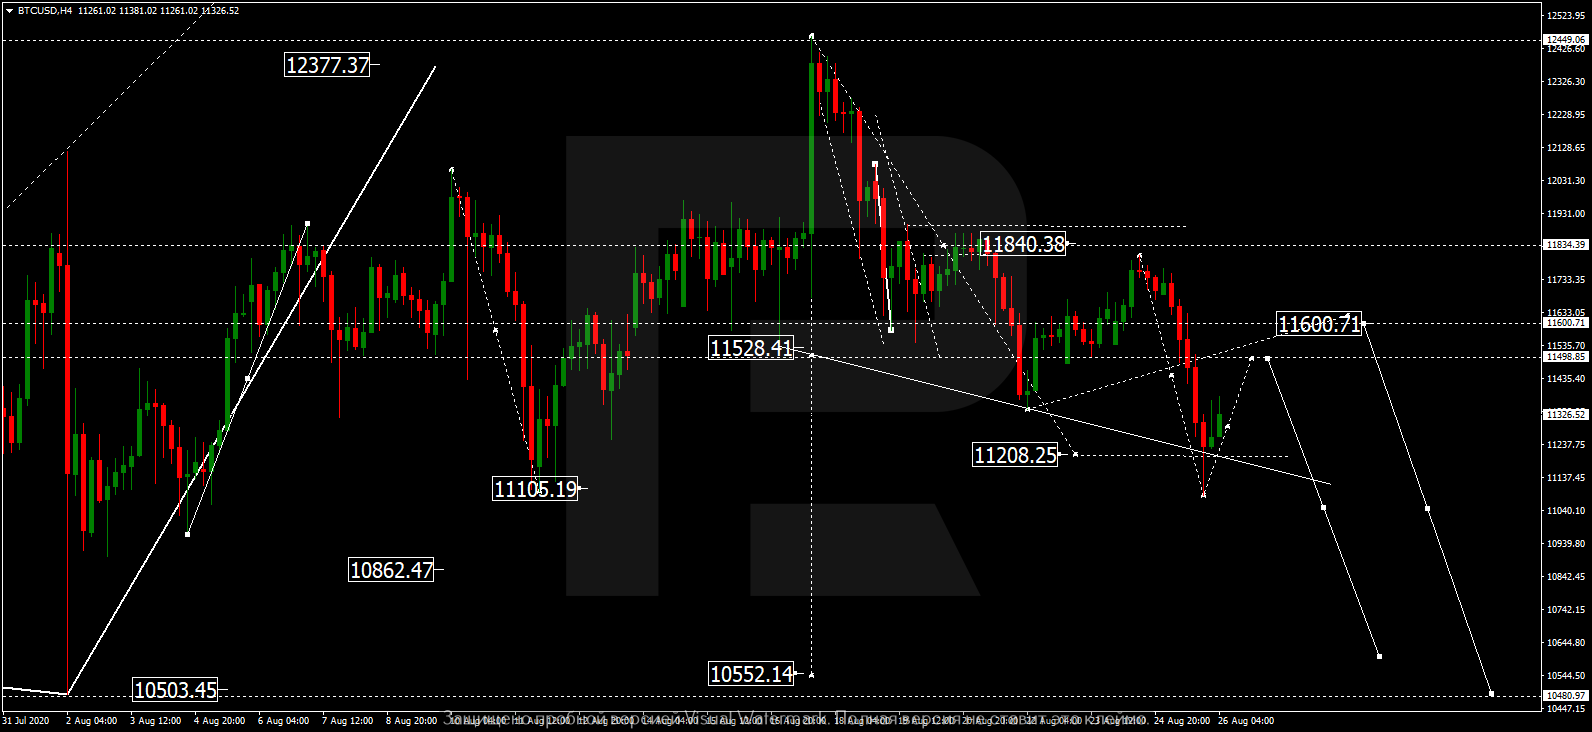
BTCUSD, “Bitcoin vs US Dollar”
After completing the descending structure at 11200.00, BTCUSD is growing towards 11500.00. Possibly, the pair may break this level and correct to test 11800.00 from below. After that, the instrument may resume trading downwards to break 11200.00 and then continue falling with the target at 10500.00.
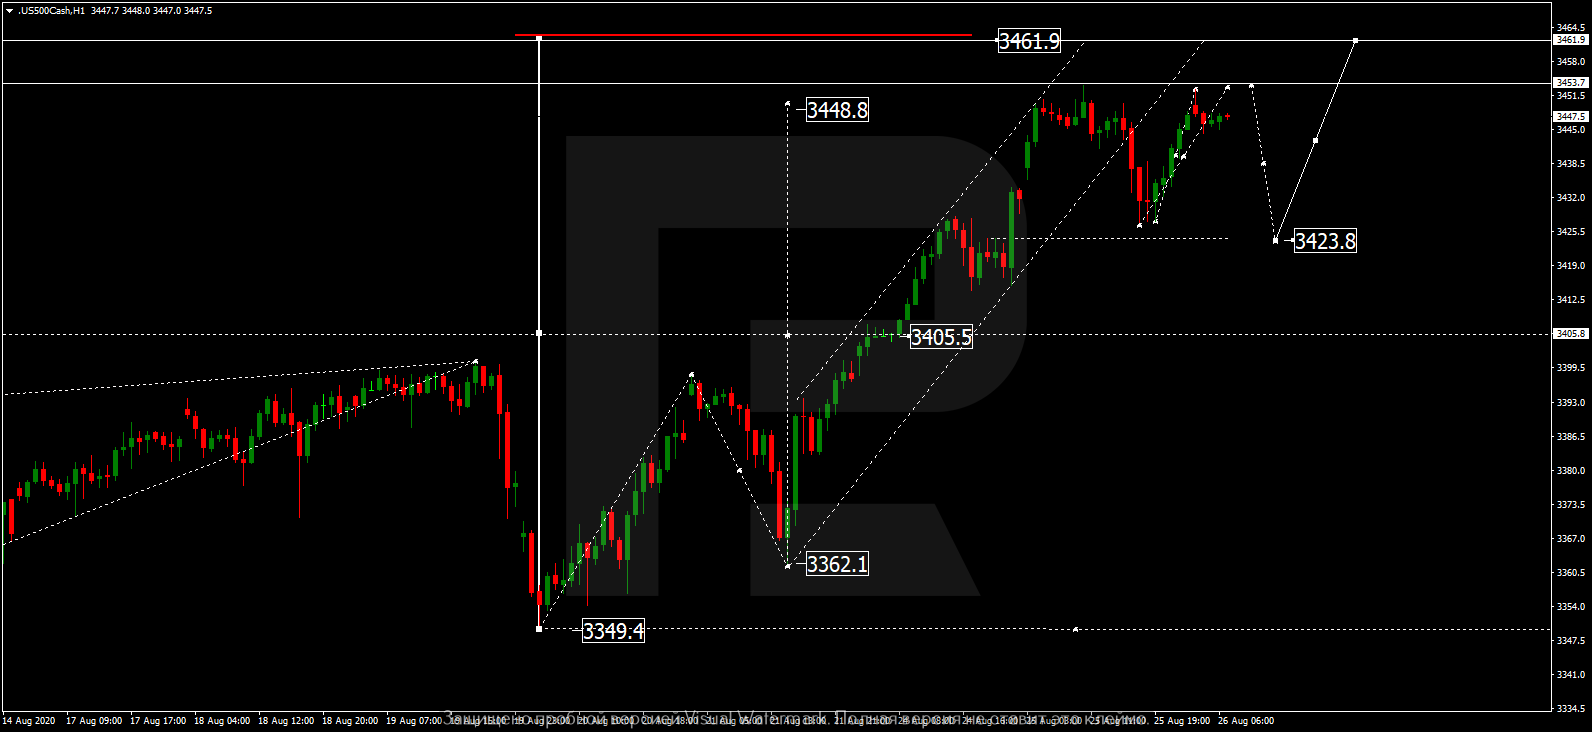
S&P 500
The S&P index is moving close to the highs. Possibly, today the pair may reach 3452.5 and then correct towards 3423.8 Later, the market may resume moving upwards with the target at 3461.9.
Article By RoboForex.com
Attention!
Forecasts presented in this section only reflect the author’s private opinion and should not be considered as guidance for trading. RoboForex LP bears no responsibility for trading results based on trading recommendations described in these analytical reviews.

- The US and European stock indices are rising again amid renewed investor interest in the AI industry. Jul 10, 2026
- USD/JPY Falls as Yen Recovers Weekly Losses Jul 10, 2026
- Crude oil prices surged sharply by 7% in reaction to the rapid escalation of the conflict in the Middle East Jul 9, 2026
- Middle East Tensions Weigh on Gold Jul 9, 2026
- Pound Awaits Tighter Policy from Bank of England Jul 8, 2026
- The United States carried out airstrikes on Iran after Iran’s attacked tankers in the Strait of Hormuz. The RBNZ raised the interest rate to 2.5% Jul 8, 2026
- RoboForex Brings Full-Scale Trading to Telegram Jul 7, 2026
- Your Bourse Integrates TradingView Charts and Trading Platform Library with Trade Server Jul 7, 2026
- Yen Still Under Pressure: Markets Await Action from Authorities Jul 7, 2026
- Germany’s DAX Index has updated its all‑time high. OPEC+ countries have agreed to increase production Jul 7, 2026