
Article By RoboForex.com
GBPUSD, “Great Britain Pound vs US Dollar”
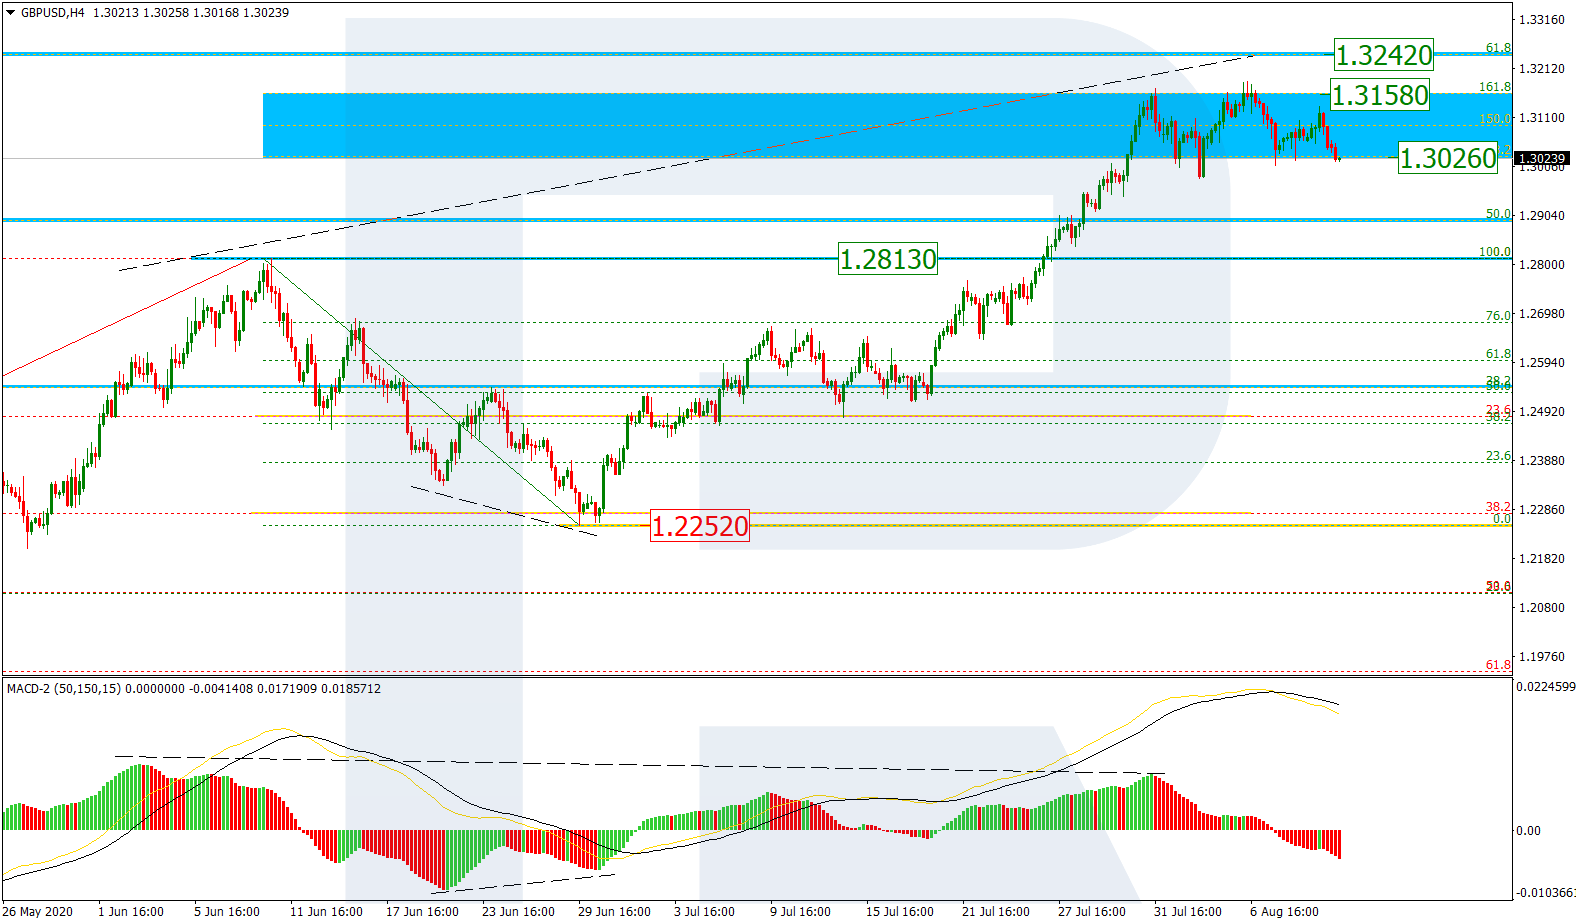
As we can see in the H4 chart, GBPUSD is moving inside the post-correctional extension area between 138.2% and 161.8% fibo at 1.3026 and 1.3158 respectively. At the same time, the MACD indicator is forming a divergence, which may hint at a possible correction. The target of this pullback may be a test of the area close to the earlier broken high at 1.2813. After completing the correction, the next rising impulse may be heading towards the long-term 61.8% fibo at 1.3243.

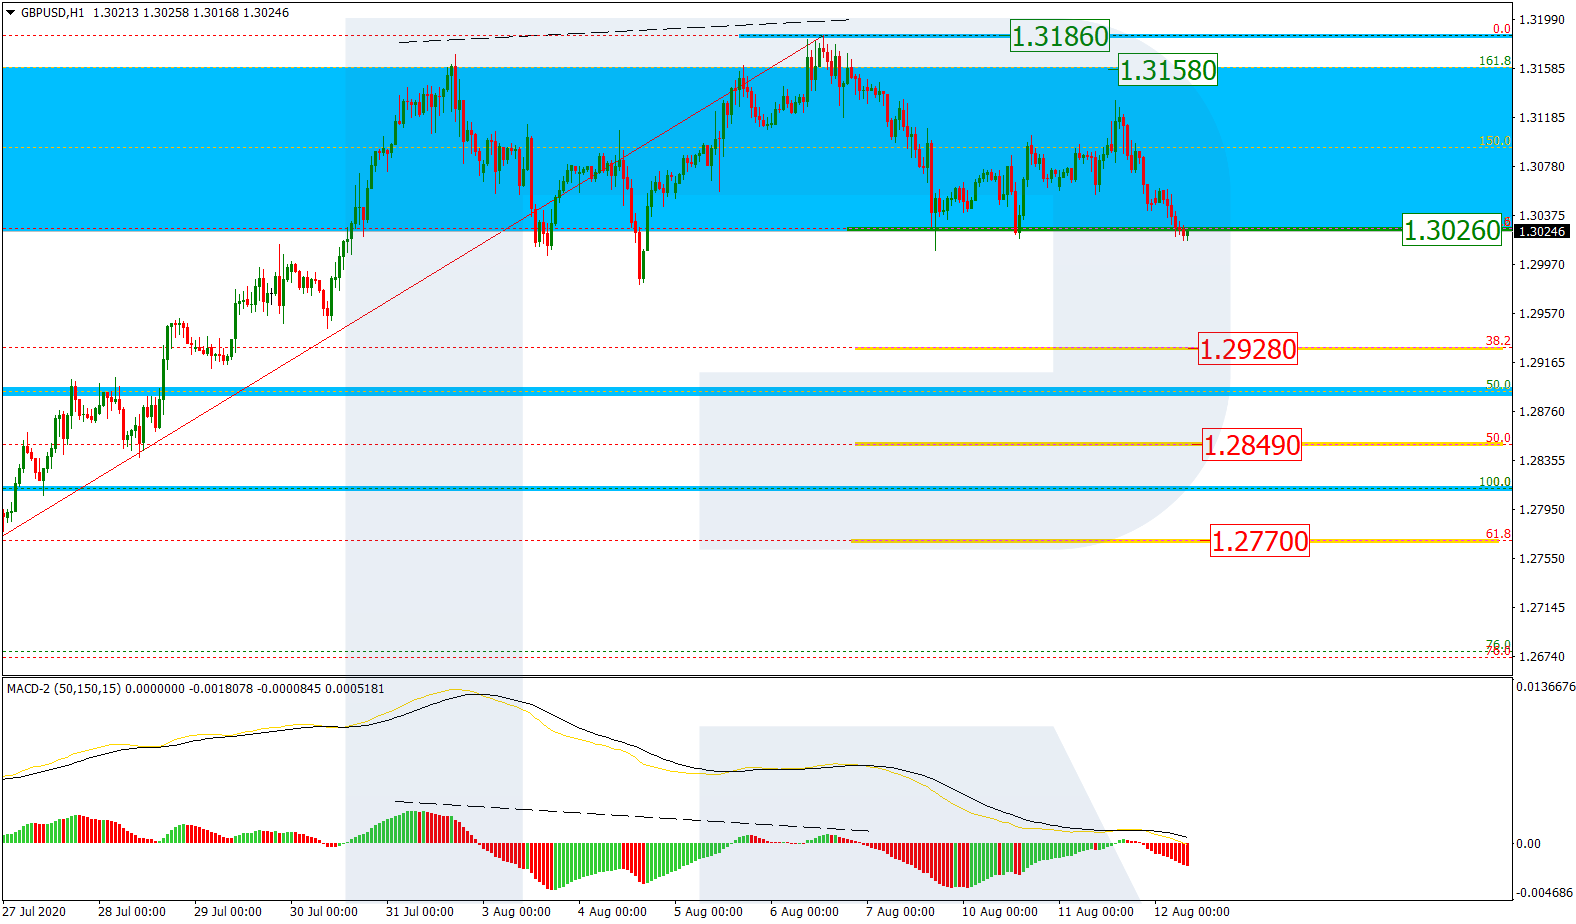
In the H1 chart, the divergence on MACD made the price start a new correction, which has already reached 23.6% fibo. The next correctional downside targets may be 38.2%, 50.0%, and 61.8% fibo at 1.2928, 1.2849, and 1.2770 respectively. However, if the price breaks the high at 1.3186, the instrument may continue the uptrend.
Free Reports:
 Get our Weekly Commitment of Traders Reports - See where the biggest traders (Hedge Funds and Commercial Hedgers) are positioned in the futures markets on a weekly basis.
 Download Our Metatrader 4 Indicators – Put Our Free MetaTrader 4 Custom Indicators on your charts when you join our Weekly Newsletter
EURJPY, “Euro vs. Japanese Yen”
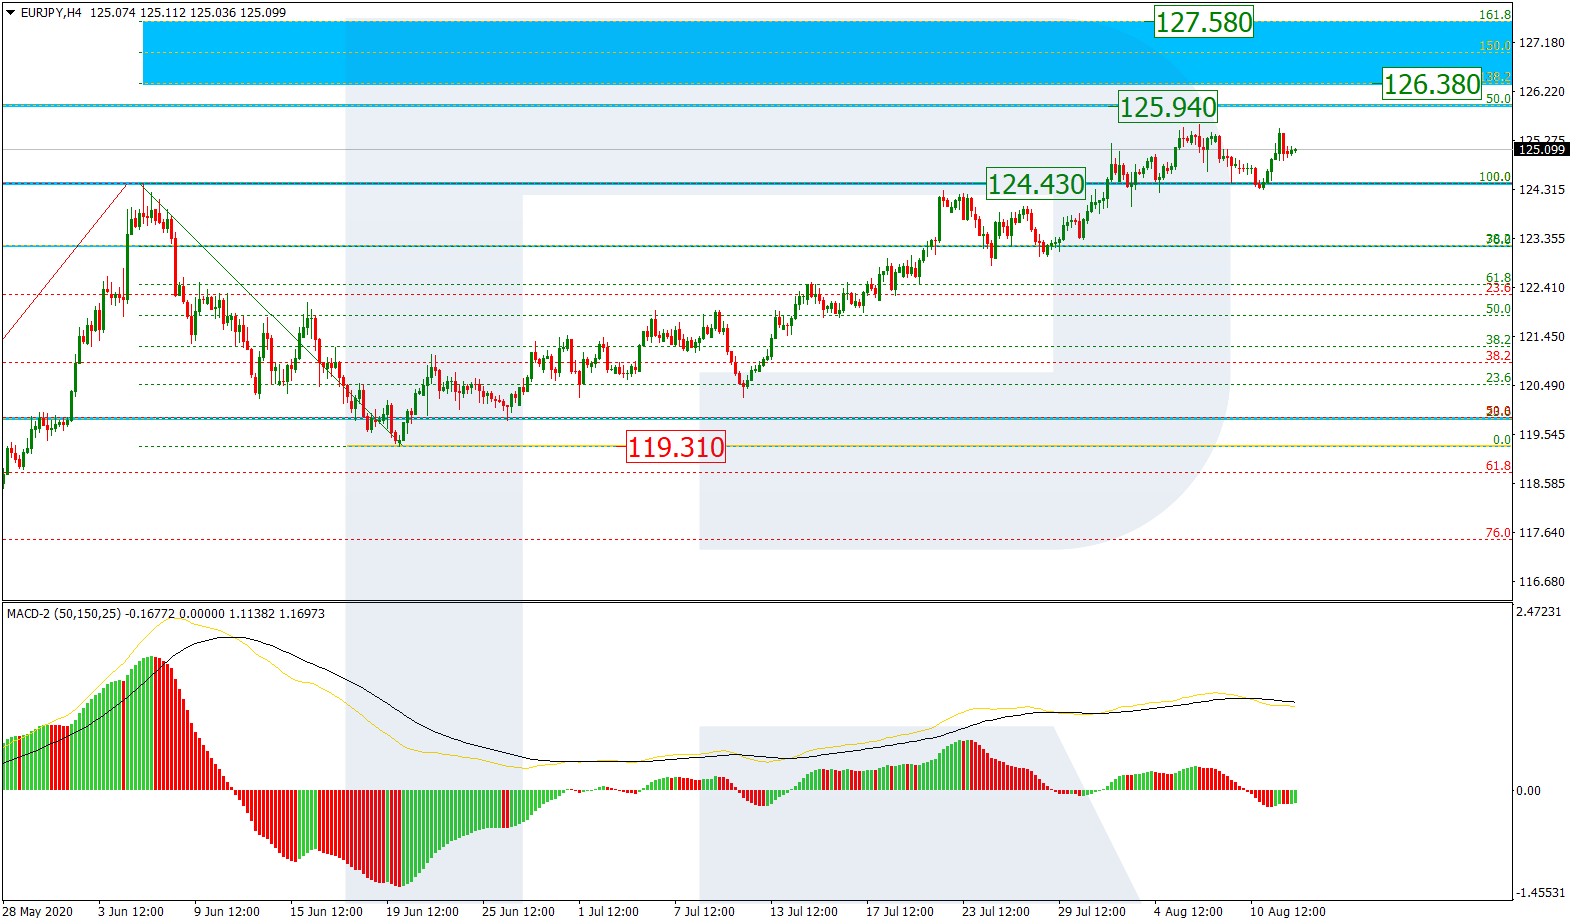
As we can see in the H4 chart, after completing a short-term pullback towards the earlier broken high at 124.43, EURJPY is forming a new rising impulse towards the long-term 50.0% fibo at 125.94 and then the post-correctional extension area between 138.2% and 161.8% fibo at 126.38 and 127.57 respectively. The support is the fractal low at 119.31.
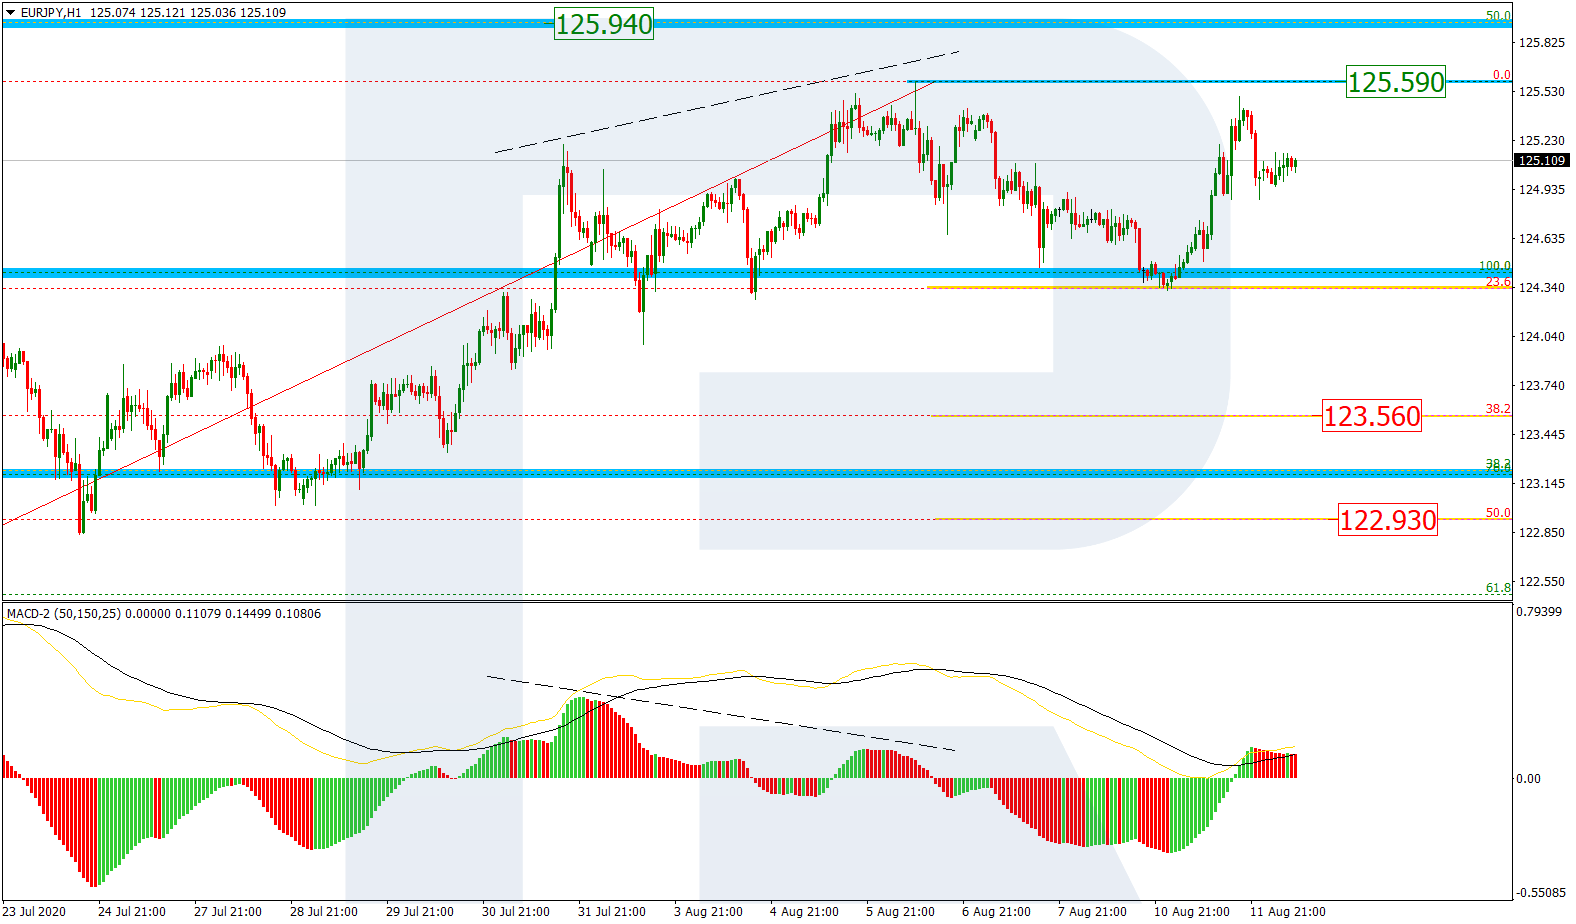
In the H1 chart, the instrument is correcting after a local divergence on MACD. The first descending impulse has already reached 23.6% fibo. However, a following ascending structure may be heading towards the high at 125.59. If the price fails to break the high, the instrument may resume trading downwards to reach 38.2% and 50.0% fibo at 123.56 and 122.93.
Article By RoboForex.com
Attention!
Forecasts presented in this section only reflect the author’s private opinion and should not be considered as guidance for trading. RoboForex LP bears no responsibility for trading results based on trading recommendations described in these analytical reviews.

- COT Metals Charts: Weekly Speculator Bets see small gains for Silver & Gold Jul 12, 2026
- COT Bonds Charts: Speculator Bets led by SOFR 3-Months & 2-Year Bonds Jul 12, 2026
- COT Energy Charts: Weekly Speculator Changes led by Brent Oil Jul 12, 2026
- COT Soft Commodities Charts: Weekly Speculator Changes led by Sugar, Corn & Soybeans Jul 12, 2026
- The US and European stock indices are rising again amid renewed investor interest in the AI industry. Jul 10, 2026
- USD/JPY Falls as Yen Recovers Weekly Losses Jul 10, 2026
- Crude oil prices surged sharply by 7% in reaction to the rapid escalation of the conflict in the Middle East Jul 9, 2026
- Middle East Tensions Weigh on Gold Jul 9, 2026
- Pound Awaits Tighter Policy from Bank of England Jul 8, 2026
- The United States carried out airstrikes on Iran after Iran’s attacked tankers in the Strait of Hormuz. The RBNZ raised the interest rate to 2.5% Jul 8, 2026
